Ebook Analysis and purification methods in combinatorial chemistry Part 1
Bạn đang xem bản rút gọn của tài liệu. Xem và tải ngay bản đầy đủ của tài liệu tại đây (4.5 MB, 267 trang )
Analysis and Purification
Methods in Combinatorial
Chemistry
CHEMICAL ANALYSIS
A SERIES OF MONOGRAPHS ON ANALYTICAL CHEMISTRY
AND ITS APPLICATIONS
Editor
J. D. WINEFORDNER
VOLUME 163
Analysis and Purification
Methods in Combinatorial
Chemistry
Edited by
BING YAN
A JOHN WILEY & SONS, INC., PUBLICATION
Copyright © 2004 by John Wiley & Sons, Inc. All rights reserved.
Published by John Wiley & Sons, Inc., Hoboken, New Jersey.
Published simultaneously in Canada.
No part of this publication may be reproduced, stored in a retrieval system, or transmitted
in any form or by any means, electronic, mechanical, photocopying, recording, scanning, or
otherwise, except as permitted under Section 107 or 108 of the 1976 United States
Copyright Act, without either the prior written permission of the Publisher, or authorization
through payment of the appropriate per-copy fee to the Copyright Clearance Center, Inc.,
222 Rosewood Drive, Danvers, MA 01923, 978-750-8400, fax 978-646-8600, or on the web at
www.copyright.com. Requests to the Publisher for permission should be addressed to the
Permissions Department, John Wiley & Sons, Inc., 111 River Street, Hoboken, NJ 07030,
(201) 748-6011, fax (201) 748-6008.
Limit of Liability/Disclaimer of Warranty: While the publisher and author have used their
best efforts in preparing this book, they make no representations or warranties with respect
to the accuracy or completeness of the contents of this book and specifically disclaim any
implied warranties of merchantability or fitness for a particular purpose. No warranty may
be created or extended by sales representatives or written sales materials. The advice and
strategies contained herein may not be suitable for your situation. You should consult with
a professional where appropriate. Neither the publisher nor author shall be liable for any
loss of profit or any other commercial damages, including but not limited to special,
incidental, consequential, or other damages.
For general information on our other products and services please contact our Customer
Care Department within the U.S. at 877-762-2974, outside the U.S. at 317-572-3993 or fax
317-572-4002.
Wiley also publishes its books in a variety of electronic formats. Some content that appears
in print, however, may not be available in electronic format.
Library of Congress Cataloging-in-Publication Data:
Analysis and purification methods in combinatorial chemistry / edited by Bing Yan.
p. cm.—(Chemical analysis; v. 1075)
Includes bibliographical references and index.
ISBN 0-471-26929-8 (cloth)
1. Combinatorial chemistry. I. Yan, Bing. II. Series.
RS419.A53 2004
615¢.19—dc22
2003014606
Printed in the United States of America.
10 9 8 7 6 5 4 3 2 1
CONTENTS
PREFACE
ix
CONTRIBUTORS
xi
PART I ANALYSIS FOR FEASIBILITY AND
OPTIMIZATION OF LIBRARY SYNTHESIS
1
CHAPTER 1
QUANTITATIVE ANALYSIS IN
ORGANIC SYNTHESIS WITH NMR
SPECTROSCOPY
3
Laura H. Lucas and Cynthia K. Larive
CHAPTER 2
19
F GEL-PHASE NMR
SPECTROSCOPY FOR REACTION
MONITORING AND QUANTIFICATION
OF RESIN LOADING
37
Joseph M. Salvino
CHAPTER 3
THE APPLICATION OF SINGLE-BEAD
FTIR AND COLOR TEST FOR REACTION
MONITORING AND BUILDING BLOCK
VALIDATION IN COMBINATORIAL
LIBRARY SYNTHESIS
53
Jason J. Cournoyer, Clinton A. Krueger, Janice V. Wade,
and Bing Yan
CHAPTER 4
HR-MAS NMR ANALYSIS OF
COMPOUNDS ATTACHED TO
POLYMER SUPPORTS
Meritxell Guinó and Yolanda R. de Miguel
v
71
vi
CHAPTER 5
contents
MULTIVARIATE TOOLS FOR REAL-TIME
MONITORING AND OPTIMIZATION OF
COMBINATORIAL MATERIALS AND
PROCESS CONDITIONS
87
Radislav A. Potyrailo, Ronald J. Wroczynski,
John P. Lemmon, William P. Flanagan,
and Oltea P. Siclovan
CHAPTER 6
MASS SPECTROMETRY AND SOLUBLE
POLYMERIC SUPPORT
125
Christine Enjalbal, Frederic Lamaty, Jean Martinez,
and Jean-Louis Aubagnac
PART II HIGH-THROUGHPUT ANALYSIS FOR LIBRARY
QUALITY CONTROL
CHAPTER 7
HIGH-THROUGHPUT NMR TECHNIQUES
FOR COMBINATORIAL CHEMICAL
LIBRARY ANALYSIS
137
139
Ting Hou and Daniel Raftery
CHAPTER 8
MICELLAR ELECTROKINETIC
CHROMATOGRAPHY AS A TOOL FOR
COMBINATORIAL CHEMISTRY ANALYSIS:
THEORY AND APPLICATIONS
175
Peter J. Simms
CHAPTER 9
CHARACTERIZATION OF SPLIT-POOL
ENCODED COMBINATORIAL
LIBRARIES
209
Jing Jim Zhang and William L. Fitch
PART III HIGH-THROUGHPUT PURIFICATION TO
IMPROVE LIBRARY QUALITY
CHAPTER 10
STRATEGIES AND METHODS FOR
PURIFYING ORGANIC COMPOUNDS
AND COMBINATORIAL LIBRARIES
Jiang Zhao, Lu Zhang, and Bing Yan
253
255
contents
CHAPTER 11
HIGH-THROUGHPUT PURIFICATION:
TRIAGE AND OPTIMIZATION
vii
281
Jill Hochlowski
CHAPTER 12
PARALLEL HPLC IN HIGHTHROUGHPUT ANALYSIS AND
PURIFICATION
307
Ralf God and Holger Gumm
PART IV ANALYSIS FOR COMPOUND STABILITY AND
DRUGABILITY
CHAPTER 13
ORGANIC COMPOUND STABILITY
IN LARGE, DIVERSE PHARMACEUTICAL
SCREENING COLLECTION
321
323
Kenneth L. Morand and Xueheng Cheng
CHAPTER 14
QUARTZ CRYSTAL MICROBALANCE IN
BIOMOLECULAR RECOGNITION
351
Ming-Chung Tseng, I-Nan Chang, and Yen-Ho Chu
CHAPTER 15
HIGH-THROUGHPUT PHYSICOCHEMICAL
PROFILING: POTENTIAL AND
LIMITATIONS
369
Bernard Faller
CHAPTER 16
SOLUBILITY IN THE DESIGN OF
COMBINATORIAL LIBRARIES
407
Christopher Lipinski
CHAPTER 17
HIGH-THROUGHPUT DETERMINATION
OF LOG D VALUES BY LC/MS METHOD
435
Jenny D. Villena, Ken Wlasichuk, Donald E. Schmidt Jr.,
and James J. Bao
INDEX
457
PREFACE
More than 160 volumes of Chemical Analysis: A Series of Monographs on
Analytical Chemistry and Its Applications have been published by John
Wiley & Sons, Inc. since 1940. These volumes all focused on the most important analytical issues of their times. In the past decade one of the most exciting events has been the rapid development of combinatorial chemistry. This
rapidly evolving field posed enormous analytical challenges early on. The
two most-cited challenges are requirements for very high-throughput analysis of a large number of compounds and the analysis of polymer-bound
compounds. Very impressive achievements have been made by scientists
working in this field. However, there are still formidable analytical challenges ahead. For example, the development of highly parallel analysis and
purification technologies and all methods associated with analysis to ensure
combinatorial libraries are “synthesizable,” “purifiable,” and “drugable.”
For these evident reasons, I almost immediately agreed to edit a volume on
the analysis and purification methods in combinatorial chemistry when the
series editor Professor J. D. Winefordner asked me a year ago.
In the past year it has been a great pleasure for me to work with all contributors. The timely development of this volume is due entirely to their collaborative efforts. I have been impressed with their scientific vision and
quality work throughout the year. To these contributors, I owe my very
special thanks. I also owe a great debt to my colleagues especially Dr. Mark
Irving, and Dr. Jiang Zhao for their assistance in my editorial work. Finally
I wish to thank staff at Wiley for their professional assistance throughout
this project.
Part I of the book includes six chapters describing various approaches
to monitor reactions on solid support and optimize reactions for library synthesis: Lucas and Larive give a comprehensive overview of the principle
and application of quantitative NMR analysis in support of synthesis in
both solution and solid phase. Salvino describes in detail the application of
19
F NMR to monitor solid-phase synthesis directly on resin support.
Cournoyer, Krueger, Wade, and Yan report on the single-bead FTIR
method applied in monitoring solid-phase organic synthesis. Guinó and de
Miguel report on HR-MAS NMR analysis of solid-supported samples.
ix
x
preface
A parallel analysis approach combined with chemometrics analysis in
materials discovery and process optimization is presented by Potyrailo,
Wroczynski, Lemmon, Flanagan, and Siclovan. Enjalbal, Lamaty, Martinez,
and Aubagnac report their work on monitoring reactions on soluble
polymeric support using mass spectrometry.
Part II of the book is dedicated to high-throughput analytical methods
used to examine the quality of libraries. Hou and Raftery review the development of high-throughput NMR techniques and their own work on
parallel NMR method. Simms details the theory and application of micellar electrokinetic chromatography as a high-throughput analytical tool for
combinatorial libraries. Zhang and Fitch describe Affymax’s approach on
quality control and encoding/decoding of combinatorial libraries via singlebead analysis methods.
In Part III, various high-throughput purification techniques are discussed. Zhao, Zhang, and Yan review the chromatographic separation and
their application in combinatorial chemistry. Hochlowski discusses various
purification methods and the high-throughput HPLC and SFC methods
developed at Abbott. God and Gumm present the new generation of
parallel analysis and purification instruments and methods.
In Part IV, analytical methods applied in postsynthesis and postpurification stages are reviewed. Morand and Cheng report studies on stability
profile of compound archives. Tseng, Chang, and Chu discuss a novel quartz
crystal microbalance method to determine the binding between library
compounds and biological targets. Faller reviews high-throughput methods
for profiling compounds’ physicochemical properties. Lipinski presents a
detailed study of solubility issue in drug discovery and in combinatorial
library design. Villena, Wlasichuk, Schmidt Jr., and Bao describe a highthroughput LC/MS method for the determination of log D value of library
compounds.
Bing Yan
August 2003
South San Francisco, California
CONTRIBUTORS
Jean-Louis Aubagnac, Laboratoire des aminocides, peptides et protéines,
UMR 5810, Université de Montpellier II, 34095 Montpellier Cedex 5,
France, E-mail:
James J. Bao, Ph.D., Theravance, Inc., 901 Gateway Blvd., S. San Francisco,
CA 94080, E-mail:
I-Nan Chang, ANT Technology Co., Ltd., 7F-4, No. 134, Sec. 1, Fushing S
Road, Taipei 106, Taiwan, ROC
Xueheng Cheng, Abbott Laboratories, Global Pharmaceutical Research
and Development Division, Department R4PN, Building AP9A, 100 Abbot
Park Road, Abbot Park IL 60064-6115, E-mail:
Yen-Ho Chu, Department of Chemistry, National Chung-Cheng University,
Chia-Yi, Taiwan 621, Republic of China, E-mail:
Jason Cournoyer, ChemRx Division, Discovery Partners International,
Inc., 385 Oyster Point Blve., South San Francisco, CA 94080
Yolanda de Miguel, Ph.D., Organic Chemistry Lecturer, Royal Society
Dorothy Hodgkin Fellow, Chemistry Department, King’s College London,
Strand, London WC2R 2LS, E-mail:
Christine Enjalbal, Laboratoire des aminocides, peptides et protéines,
UMR 5810, Université de Montpellier II, 34095 Montpellier Cedex 5, France
Bernard Faller, Ph.D., Technology Program Head, Novartis Institute
for Biomedical Research, WKL-122.P.33, CH-4002 Switzerland,
William L. Fitch, Roche BioScience, Palo Alto, CA 94304
William P. Flanagan, General Electric, Combinatorial Chemistry Laboratory, Corporate Research and Development, PO Box 8, Schenectady, NY
12301-0008
Ralf God, Ph.D., Arndtstraß 2, D-01099 Dresden (Germany), E-mail:
xi
xii
contributors
Meritxell Guinó, Organic Chemistry Lecturer, Royal Society Dorothy
Hodgkin Fellow, Chemistry Department, King’s College London, Strand,
London WC2R 2LS
Holger Gumm, SEPIAtec GmbH, Louis-Bleriot-Str. 5, D-12487 Berlin,
Germany, E-mail:
Jill Hochlowski, Abbott Laboratories, Dept. 4CP, Bldg. AP9B, 100
Abbott Park Road, Abbott Park, IL 60064-3500, E-mail:
Ting Hou, Department of Chemistry, West Lafayette, IN 47907-1393
Clinton A. Krueger, ChemRX Division, Discover Partners International,
Inc., South San Francisco CA 94080
Cynthia K. Larive, University of Kansas, Department of Chemistry, 2010
Malott Hall, 1251 Wescoe Hall Rd, Lawrence, KS 66045, E-mail:
Frederic Lamaty, Laboratoire des aminocides, peptides et protéines, UMR
5810, Université de Montpellier II, 34095 Montpellier Cedex 5, France,
E-mail:
John P. Lemmon, General Electric, Combinatorial Chemistry Laboratory,
Corporate Research and Development, PO Box 8, Schenectady, NY 123010008
Christopher A. Lipinski, Ph.D., Pfizer Global R&D, Groton Labs,
Eastern Point Road, MS 8200-36, Groton, CT 06340, E-mail:
fizer.com
Laura H. Lucas, Dept of Chemistry, 2010 Malott Hall, University of
Kansas, Lawrence KS 66045
J. Martinez, Laboratoire des aminocides, peptides et protéines, UMR 5810,
Université de Montpellier II, 34095 Montpellier Cedex 5, France, E-mail:
Kenneth Morand, Procter & Gamble Pharmaceuticals, Health Care
Research Center, 8700 Mason-Montgomery Road, Mason, OH 45040,
E-mail:
Radislav A. Potyrailo, General Electric, Combinatorial Chemistry Laboratory, Corporate Research and Development, PO Box 8, Schenectady, NY
12301-0008, E-mail:
Daniel Raftery, Department of Chemistry, West Lafayette, IN 47907-1393,
E-mail:
contributors
xiii
Joseph M. Salvino, Ph.D., Rib-X Pharmaceuticals, Inc., 300 George St.,
New Haven, CT 06511, E-mail:
Donald E. Schmidt, Jr., Theravance, Inc., 901 Gateway Blvd., S. San
Francisco, CA 94080
Oltea P. Siclovan, General Electric, Combinatorial Chemistry Laboratory,
Corporate Research and Development, PO Box 8, Schenectady, NY 123010008
Peter J. Simms, Ribapharm Inc., 3300 Hyland Ave., Costa Mesa, CA 92626,
E-mail:
Ming-Chung Tseng, Dept of Chemistry and Biochemistry, National Chung
Cheng University, 160 San-Hsing, Min-Hsiung, Chia-Yi 621, Taiwan, ROC
Jenny D. Villena, Theravance, Inc., 901 Gateway Blvd., S. San Francisco,
CA 94080
Janice V. Wade, ChemRX Division, Discover Partners International, Inc.,
South San Francisco CA 94080
Ken Wlasichuk, Theravance, Inc., 901 Gateway Blvd., S. San Francisco, CA
94080
Ronald J. Wroczynski, General Electric, Combinatorial Chemistry Laboratory, Corporate Research and Development, PO Box 8, Schenectady, NY
12301-0008
Bing Yan, ChemRX Division, Discover Partners International, Inc., South
San Francisco CA 94080, E-mail:
Jing Jim Zhang, Ph.D., Affymax, Inc., 4001 Miranda Avenue, Palo Alto,
CA 94304, E-mail:
Lu Zhang, ChemRx Division, Discovery Partners International, Inc., 9640
Towne Centre Drive, San Diego, CA 92121
Jiang Zhao, ChemRx Division, Discovery Partners International, Inc.,
385 Oyster Point Blve., South San Francisco, CA 94080, E-mail:
PART
I
ANALYSIS FOR FEASIBILITY
AND OPTIMIZATION OF
LIBRARY SYNTHESIS
CHAPTER
1
QUANTITATIVE ANALYSIS IN ORGANIC SYNTHESIS
WITH NMR SPECTROSCOPY
LAURA H. LUCAS and CYNTHIA K. LARIVE
1.1.
INTRODUCTION
The development of combinatorial methods of synthesis has created a great
need for robust analytical techniques amenable to both small- and largescale syntheses as well as high-throughput analysis. A variety of spectroscopic methods such as mass spectrometry (MS), infrared spectroscopy
(IR), and nuclear magnetic resonance (NMR) spectroscopy have been
widely used in the combinatorial arena.1–4 Many of these methods have
been coupled online with high-performance liquid chromatography
(HPLC), and such hyphenated techniques afford high-resolution structural
data on library compounds.5–7 NMR has an advantage over other spectroscopic techniques because it is a universal analytical method that potentially reveals the identity and purity of any organic compound. Since organic
molecules contain 1H and 13C, nuclei that are NMR active, no analyte derivitization is necessary. NMR can also distinguish isomers or structurally
similar compounds that may coelute when analyzed by HPLC. This selectivity is especially important when attempting to resolve and quantitate
structures of library compounds or natural products.8 Furthermore the noninvasive nature of NMR allows the sample to be recovered for additional
analyses or used in a subsequent reaction.
Although traditionally thought of as a low-sensitivity technique, technological improvements in NMR instrumentation have significantly reduced
sample mass requirements and experiment times. Sensitivity enhancements
have been achieved with higher field magnets, small-volume flow probes for
solution-phase analysis,9 the introduction of cryogenically cooled NMR
receiver coils and preamplifiers,10–13 and high-resolution magic-angle spinning (HR-MAS) NMR technology for solid-phase systems, making routine
analysis of mg quantities (or less) possible.14,15 These advancements comAnalysis and Purification Methods in Combinatorial Chemistry, Edited by Bing Yan.
ISBN 0-471-26929-8 Copyright © 2004 by John Wiley & Sons, Inc.
3
4
quantitative analysis in organic synthesis with nmr spectroscopy
bined with developments in automated sample handling and data processing have improved the throughput of NMR such that entire 96-well microtitre plates can be analyzed in just a few hours.16
Besides the structural information provided by NMR, quantitation is
possible in complex mixtures even without a pure standard of the analyte,
as long as there are resolved signals for the analyte and reference compound. This is a particular advantage in combinatorial chemistry, where the
goal is the preparation of large numbers of new compounds (for which no
standards are available). Since the NMR signal arises from the nuclei (e.g.,
protons) themselves, the area underneath each signal is proportional to the
number of nuclei. Therefore the signal area is directly proportional to the
concentration of the analyte:
Area
µ Concentration
Number of nuclei
(1.1)
This relationship holds true when experimental parameters are carefully
optimized, which may require some additional experimental time.
Consider the example shown in Figure 1.1 for the quantitation of a
maleic acid solution, containing a known concentration of the primary standard potassium hydrogen phthalate (KHP). A primary analytical standard
is a material of very high purity for which the mass of the compound can
be used directly in the calculation of solution concentration. The area of the
KHP peak is divided by 4.0, the number of protons that contribute to the
KHP aromatic resonances, so that its normalized area is 1773.1. Similarly
the maleic acid peak area is normalized by dividing by 2.0 to give a normalized area of 1278.3.A simple proportion can then be established to solve
for the concentration of maleic acid:
Normalized area ( Maleic acid ) Normalized area ( KHP )
=
,
[Maleic acid]
[KHP]
[KHP] ¥ Normalized area ( Maleic acid )
,
[Maleic acid] =
Normalized area ( KHP )
28.5 mM ¥ 1278.3
,
1773.1
[Maleic acid] = 28.5 mM ¥ 0.72094.
[Maleic acid] =
The concentration of maleic acid in this solution is therefore about 72%
that of the primary standard KHP. In this example the concentration of the
KHP is 28.5 mM and the calibrated concentration of maleic acid is 20.5 mM.
Even though maleic acid is not a primary standard, this standardized maleic
fundamental and practical aspects of the nmr experiment
5
Area KHP =
7092.2
Area Maleic Acid =
2556.5
8.5
8.0
7.5
7.0
6.5
6.0
ppm
1
Figure 1.1. 600 MHz H NMR spectrum of potassium hydrogen phthalate (KHP) and maleic
acid dissolved in D2O. The KHP is a primary standard by which the maleic acid concentration
can be quantitated. The data represents 8 FIDs coadded into 28,800 points (zero-filled to 32K
points) across a spectral width of 7200.1 Hz. An exponential multiplier equivalent to 0.5 Hz
line broadening was then applied.
acid solution can now be used to quantitate additional samples in a similar
manner (e.g., ibuprofen as discussed in more detail below). This approach
allows the selection of a quantitation standard based on its NMR spectral
properties and does not require that it possess the properties of a primary
analytical standard.
1.2.
FUNDAMENTAL AND PRACTICAL ASPECTS OF
THE QUANTITATIVE NMR EXPERIMENT
1.2.1.
Experimental Parameters
For a detailed description of NMR theory and practice, the reader is encouraged to see one of the many excellent books on the subject.17–20 A brief
description of the NMR experiment is presented below, with an emphasis
6
quantitative analysis in organic synthesis with nmr spectroscopy
z´
z´
Mo
x´
z´
Mz’
90x’°
Mx’y’ t
y´ x´
y´ x´
Mx’y’
y´
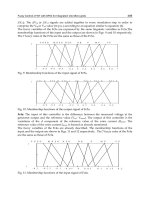
Figure 1.2. The equilibrium population difference of the nuclei in an applied magnetic field
can be represented as a vector Mo. Disturbing this macroscopic magnetization away from its
equilibrium position creates the NMR signal. This is accomplished by application of a radio
frequency pulse (90° along the x¢ axis in this example) to tip the magnetization into the x¢y¢
plane of the rotating frame of reference. During a time delay t, following the pulse the
detectable magnetization Mx¢y¢, decays by T2 relaxation in the transverse plane while the longitudinal magnetization Mz¢ begins to recover through T1 relaxation.
on the important parameters for proper acquisition and interpretation of
spectra used for quantitation. When the sample is placed in the magnetic
field, the nuclei align with the field, by convention along the z¢ axis in the
rotating frame of reference, as illustrated in Figure 1.2 by the vector, Mo,
representing the macroscopic magnetization. A radio frequency pulse (B1)
applied for time tp tips the magnetization through an angle, q:
q = gB1t p ,
(1.2)
where g is the gyromagnetic ratio of the nucleus of interest. A 90° radio frequency (rf) pulse along the x¢ axis tips the magnetization completely into
the x¢y¢ plane to generate the observable signal, Mx¢y¢. After the pulse the
magnetization will relax back to equilibrium via two mechanisms: spin-spin
(T2, transverse) relaxation and spin-lattice (T1, longitudinal) relaxation. This
is shown in Figure 1.2 as a decrease in the magnitude of the x¢y¢ component
of the vector Mo and an increase in the magnitude of the z¢ component at
time t following the pulse. Acquisition of Mx¢y¢ for all nuclei in the sample
as a function of time results in the free induction decay (FID), which upon
Fourier transformation is deconvolved into the frequency domain and displayed as the familiar NMR spectrum. The FID decays exponentially
according to T2, the spin-spin or transverse relaxation time. In addition to
the natural T2 relaxation times of the nuclei that comprise the FID, magnetic field inhomogeneity contributes to the rate at which the transverse
magnetization is lost. The apparent transverse relaxation time, T *2 , is the
summation of the natural relaxation time and the component induced by
fundamental and practical aspects of the nmr experiment
7
magnetic field inhomogeniety and can be calculated from the width at halfheight of the NMR signals:
w1 2 =
1
.
pT *2
(1.3)
The acquisition time during which the FID is detected is often set to three
to five times T *2 to avoid truncation of the FID.
1.2.2.
T1 Relaxation
Just as the NMR signal decays exponentially in the transverse plane, the
magnetization also relaxes back to its equilibrium state in an exponential
fashion during the time t following the rf pulse. For the longitudinal component (Mz¢), this occurs as a first-order rate process:
È
Ê -t ˆ ˘
M z¢ = M o Í1 - exp
.
Ë T1 ¯ ˙˚
Î
(1.4)
Equation (1.4) reveals that when the magnetization is fully tipped into the
x¢y¢ plane by a 90° pulse, the magnetization will recover to 99.3% of its equilibrium value along z¢ at t = 5T1. The T1 relaxation time can be measured
with an inversion-recovery experiment,21 where a 180° pulse inverts the
magnetization to the negative z¢ axis and allows the magnetization to
recover for various times until the curve described by Eq. (1.5) is adequately characterized:
È
Ê -t ˆ ˘
M z¢ = M o Í1 - 2 exp
.
Ë T1 ¯ ˙˚
Î
(1.5)
Equation (1.5) is equivalent to (1.4), except the factor of 2 reflects the use
of a 180° pulse, meaning that the magnetization (signal intensity) now
should take twice as long to recover as when a 90° pulse is used. The results
of the inversion-recovery experiment are illustrated in Figure 1.3, where the
recovery of ibuprofen and maleic acid resonances are shown as a series of
spectra and as signal intensities (inset) fit to Eq. (1.5).
It should be noted that if the sample contains multiple components, the
90° pulse will not be exactly the same for all spins. Equations (1.3) to (1.5)
will not hold rigorously, leading to errors in T1 measurements. Correction
factors can be performed mathematically22 or by computer simulation,23
depending on the complexity of the sample. In practice, the average 90°
pulse or the 90° pulse for the peaks of interest is used.
quantitative analysis in organic synthesis with nmr spectroscopy
Signal Intensity
8
10
5
0
-5
-10
0
10 20 30 40 50 60 70
t (s)
Figure 1.3. Inversion-recovery experimental results for determining T1 relaxation times of
ibuprofen and maleic acid. The spectral region from 5.6 to 7.6 ppm is displayed as a function
of the variable delay time t. The t values used were (from left to right across the figure):
0.125 s, 0.25 s, 0.50 s, 1.0 s, 2.0 s, 4.0 s, 8.0 s, 16 s, 32 s, and 64 s. The acquisition and processing
parameters are the same as for Figure 1.1. The inset shows the signal intensities of the maleic
acid peak (5.93 ppm) fit to Eq. (1.5).
1.2.3.
Repetition Time
As mentioned previously, the T1 relaxation time affects the repetition time
(acquisition time + relaxation delay), which must be carefully chosen to
ensure that the magnetization returns to equilibrium between pulses. If the
time between FIDs is insufficient to allow for complete relaxation, the
intensity of the detected magnetization will be reduced:
M x¢y¢
È
Ê -t r ˆ ˘
M o Í1 - exp
sin q
Ë T1 ¯ ˙˚
Î
=
,
È
Ê -t r ˆ ˘
ÍÎ1 - expË T1 ¯ ˙˚ cos q
(1.6)
where tr is the repetition time and q is the tip angle.24 If the sample contains
multiple components, tr should be set based on the longest T1 measured for
results to be fully quantitative. The 1H spectrum in Figure 1.4 for an ibuprofen-maleic acid mixture measured using an average 90° pulse shows that
the ibuprofen T1 relaxation times range from 0.721 to 2.26 s, but maleic acid
fundamental and practical aspects of the nmr experiment
HOD
0.980 s
g
g
CH3
g
e
d
H3C
b
a
5.16 s
*
f
9
b
a
c
H3C
COOH
0.721 s
f
2.08 s
a b
0.920 s
d
2.26 s
c
7
6
5
4
1.80 s
e
3
2
1
ppm
1
Figure 1.4. 600 MHz H NMR spectrum of the ibuprofen-maleic acid mixture. The average T1
relaxation times are displayed above each peak. The asterisk (*) indicates the maleic acid peak
while the ibuprofen peaks are labeled a to g to correspond with the structure. The acquired
data were zero-filled to 32 K, and other acquisition and processing parameters are as listed for
Figure 1.1.
has a T1 of 5.16 s. Therefore, to quantitate the ibuprofen concentration using
the internal standard maleic acid, the repetition time should be >25 s if a
90° pulse is used. Because multiple relaxation mechanisms exist (e.g.,
dipole-dipole interactions, chemical shift anisotropy, and spin-rotation
relaxation),17 T1 values for different functional groups may vary significantly, as illustrated by ibuprofen.
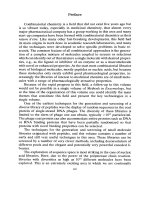
The consequences of a truncated repetition time are shown in Figure 1.5
for the ibuprofen aromatic protons and maleic acid singlet. Repetition times
of 0.7, 1, 3, and 5T1 (based on the measured T1 of maleic acid, 5.16 s) were
used. The intensities of the ibuprofen aromatic proton resonances are less
affected by decreased repetition times, since their T1 values are much
shorter, and appear to have recovered fully when a repetition time of 3T1
(15.5 s) is used. The intensity of the maleic acid singlet is more significantly
affected because its T1 is longer. The integral of the maleic acid resonance
10
quantitative analysis in organic synthesis with nmr spectroscopy
0.7T1 1T1 3T1 5T1
0.7T1 1T1 3T1 5T1
1
Figure 1.5. H spectra for the ibuprofen-maleic acid mixture acquired with different repetition times. Only the spectral region including the aromatic ibuprofen protons and maleic acid
singlet is shown. The repetition times were selected on the basis of the measured T1 of maleic
acid (5.16 s) and are as follows: 0.7T1 (3.57 s), 1T1 (5.16 s), 3T1 (15.5 s), and 5T1 (25.8 s). All
spectra were acquired and processed as described for Figure 1.1.
is the basis for the quantitation of the ibuprofen concentration, and repetition times shorter than 5T1 lead to reduced integral values for maleic acid.
This results in positive systematic errors in the calculated ibuprofen concentration as shown in Table 1.1. The quantitation errors are greater when
shorter repetition times are used, resulting in a gross overestimation of the
ibuprofen concentration.
To efficiently utilize instrument time, it may be necessary to use repetition times less than 5T1. Theoretically the signal intensities obtained using
a repetition time less than 5T1 should be correctable according to Eq. (1.1).
For example, the data acquired with a repetition time of 1T1 (5.16 s) should
give a maleic acid signal that is 63.2% recovered. The ibuprofen aromatic
proton signals are 91.6% recovered at this repetition time because of their
faster T1 recovery. The signal areas can be corrected to determine their
value at 100% recovery. Using the corrected integrals, an ibuprofen concentration of 50.4 mM was obtained. This result reflects an approximate
10% error relative to the fully relaxed data (acquired with a repetition time
of 5T1) and may result from pulse imperfections as well as T1 differences
for the two ibuprofen aromatic protons (which were not completely baseline resolved and hence integrated together). These results show that the
repetition time is probably the most important experimental parameter in