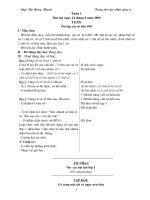
IFSL research Derivatives 2009
Bạn đang xem bản rút gọn của tài liệu. Xem và tải ngay bản đầy đủ của tài liệu tại đây (602.71 KB, 8 trang )
In partnership with:
IFSL RESEARCH
JUNE 2009
DERIVATIVES 2009
OVERVIEW
Rapid growth in the derivatives industry seen over a long period was checked
in 2008. This overview summarises developments in both OTC and
exchange-traded derivatives and reviews the influence of derivatives on the
financial crisis.
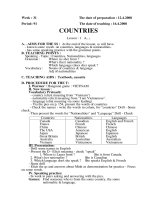
OTC Derivatives Markets The notional outstanding value of OTC
derivatives contracts fell by 13% from the peak of $684 trillion in June to
$592 trillion at end-2008: the first fall since BIS started collecting figures in
1998 (Chart 1). Key contributor to this decline was the move to central
counterparty clearing of some contracts following concern over systemic
risks posed by OTC derivatives. In addition, voluntary terminations of
contracts reduced the total value of credit default swaps (CDS) contracts.
Gross market value more than doubled from $16 trillion to $34 trillion
during 2008, as a result of volatility of prices associated with greater risks in
many derivatives contracts (Table 1). Higher market value was reflected in a
rise in gross credit exposure, up over a half to $5.0 trillion.
Interest rate instruments remain the mainstay, accounting for 71% of global
notional value. Derivatives based on foreign exchange contracts make up a
further 8%. The balance consists of foreign exchange, CDS, commodities and
equity linked derivatives, all of which declined in 2008. The euro and the US
dollar are the most widely traded currencies in single currency interest rate
derivatives, with 37% and 35% shares respectively in 2008. UK was the
leading derivatives centre for trading OTC derivatives worldwide in April
2007 with its share of turnover stable at 43%. The US was the only other
major location with 24% of trading.
Exchange-traded derivatives Notional outstanding value of exchangetraded derivatives fell by 29% in the second half of 2008 (Chart 1), while
value of turnover dropped by 47% in the 12 months to Q1 2009 (Chart 2).
Strong trading in the first half meant that annual turnover fell by only 3% in
2008 to $2,214 trillion, having risen by about a quarter annually in each of
the four previous years. BIS notes that the decline in trading during the
second half of 2008 reflects a combination of significantly reduced risk
appetite, expectations of stable low interest rates in major markets and lower
hedge fund activity. The decline in turnover slowed to 3% in the first quarter
of 2009, although over the whole of 2009 turnover could be 25% down on
2008. Exchanges have seen considerable consolidation in recent years. Based
on notional value of trading, the biggest exchange groups worldwide are
CME Group, NYSE Euronext (largely based on NYSE Liffe) and Eurex.
These three exchanges account for over a half of turnover value.
London has a prominent role in global exchange-traded derivatives. NYSE
Liffe is the leading exchange in the trading of short-term euro interest rate
contracts: 98% of NYSE Liffe turnover by value takes place on the London
exchange. At least 45% of Eurex trades have originated in the UK since 2003.
More than 90% of international business in non-ferrous metal futures is
transacted at the London Metals Exchange. ICE Futures Europe is the
WWW.IFSL.ORG.UK
Chart 1 International derivatives markets
$ trillion, notional amounts outstanding, June & December
700
Over-the-counter
600
500
400
300
200
Exchange-traded
100
0
1998
2000
2002
2004
2006
*Exchange-traded March 2009
Source: Bank for International Settlements
2008
2009*
Table 1 Measures of activity in international
derivatives markets
$ trillion (except contracts traded)
OTC market
2006 2007
Notional value
414.8 595.3
Gross market value 9.8
15.8
Gross credit exposure 2.0
3.3
2008
592.0
33.9
5.0
----% change---2007 2008
44
-1
62
114
60
54
Exchange-traded derivatives
Notional value
79.1
69.4
57.9
Turnover
1807.7 2288.0 2213.3
Contracts traded (bn)12.0
15.6
17.8
14
27
30
-27
-3
14
Source: Bank for International Settlements, Futures Industry Association
Chart 2 International exchange-traded
quarterly turnover by value
$ trillion, quarterly value of turnover
700
600
500
400
300
200
100
0
2005
2006
2007
2008
2009
Source: Bank for International Settlements
1
IFSL
leading electronic global exchange for energy products. European Climate
Exchange, part of ICE Futures Europe, is the leading carbon markets
exchange in Europe for futures and options trading. Derivatives account for
the majority of UK banking sector spread earnings on derivatives, foreign
exchange trading and other securities transactions, which combined totalled
£9.5bn in 2007 and an estimated £10bn in 2008.
Derivatives and the financial crisis While there are differing views on the
role of OTC derivatives as a contributory cause to the crisis, the drive for
regulatory repair will include much closer oversight of these markets, the
imposition of comprehensive trade reporting to the regulatory authorities and
widespread use of central clearing.
Although the regulatory authorities are concentrating on collateralised debt
obligations (CDOs) and the central clearing of CDS, it is clearly the intention
in both the EU and the US to propose tighter regulation for OTC markets in
general. The underlying issue for market users is whether closer regulatory
oversight and the pressure to standardise contracts will result in a reduction
in product diversity and a scaling back of the capability of customers to
manage their diverse and often complicated underlying risks. The position is
further complicated by strong indications in the US that standardised OTC
contracts will be required to be executed on (and not just cleared through) an
exchange or by a regulated trading system.
Other measures under consideration include the application of higher capital
requirements to cover the proprietary trading of banks and other institutions,
particularly in high-risk products and the imposition of leveraged ratios. This
could impact on market liquidity in both OTC and exchange-traded contracts.
The emerging focus on development of “safety first” regulation could also
reduce innovation, which has always been at the forefront of the OTC and
derivative markets in general.
The aim of US authorities is to facilitate expansion of exchange-traded
products and downplay OTC contracts. While exchanges would benefit from
such a move, some major exchanges have said that OTC derivatives should
not be forced onto clearing houses which are not equipped to deal with the
associated risks. The exchanges said that market participants should have a
role in determining the extent to which OTC products are standardised.
Whatever the eventual outcome the regulatory climate needs to preserve the
widespread availability of derivatives products, both OTC and exchangetraded, as important risk management tools. The derivatives industry is also
concerned about any moves that disadvantage London, as the leading global
centre for OTC derivatives, relative to other centres.
OVER THE COUNTER DERIVATIVES MARKETS
Data on global OTC derivatives markets is generated mainly from statistics
compiled by the Bank for International Settlements (BIS): the six-monthly
survey of major market participants and the triennial central bank surveys.
Five triennial surveys have been undertaken, the most recent in April 2007.
I. Six monthly BIS survey of major market participants
Size Indicators of activity in OTC markets have shown divergent trends in the
past year. Notional value fell in the second half of 2008, while gross market
2
Derivatives 2009
Measures used in BIS survey
Nominal or notional amounts outstanding provide a
measure of market size, and can also provide a rough
proxy for the potential transfer of price risk in
derivatives markets. They are also comparable to
measures of market size in related underlying cash
markets.
Gross market value supplies information about the scale
of gross transfer of price risks in the derivatives
markets. Essentially it represents of the cost of replacing
all existing contracts. It provides a measure of market
size and economic significance that is readily
comparable across derivatives markets and products.
Gross credit exposure represents the current value of
contracts that have a positive market value after taking
account of legally enforceable bilateral netting
agreements, i.e. it measures netted credit exposures
between counterparties.
Turnover data collected in the triennial survey provide a
measure of market activity, and can also provide a rough
proxy for market liquidity. Turnover is defined as the
absolute gross value of all new deals entered into during
the month of the surveys, and is measured in terms of
nominal or notional amount of the contracts.
Chart 3 OTC derivatives markets
$ trillion, June & December
Gross market value
40
Gross credit exposure
5
Gross credit
exposure
35
4
30
25
3
20
2
15
10
Gross market
value
5
0
1998
2000
2002
2004
Source: Bank for International Settlements
2006
1
2008
0
IFSL
Derivatives 2009
value and gross credit exposure both rose:
-
-
-
Notional value Moves to greater centralised clearing have contributed to
a 13% fall in the notional value of OTC derivatives from $684 trillion in
June to $592 trillion in December 2008 (Chart 1). This is the first such
fall to be recorded by BIS since it started compiling the statistics in 1998.
Notional value of exchange-traded derivatives declined by 27% in the
second half of 2008, and was only one tenth the value of OTC
derivatives at the year end.
Gross market value more than doubled from $15.8 trillion to
$33.9 trillion between the end of 2007 and 2008 (Chart 3). This was a
result of volatility of prices associated with increasing risk in many
derivatives contracts.
Gross credit exposure reflected the rise in gross market value although
the rise was less, up by 53% from $3.3 trillion to $5.0 trillion (Chart 3).
Risk instruments Interest rates are the main instrument in the OTC
derivatives market, having accounted for around 70% of contracts in recent
years (Table 2). The share of derivatives based on foreign exchange contracts
has fallen from 11.3% to 8.4% since 2004. Declining prices in equity markets
have contributed to a lower share of equity derivatives over the past two
years. More recently the slump in commodity prices in 2008 halved
commodities share from 1.4% to 0.7%. CDS share fell from 9.7% to 7.1%
(see paragraph on CDS on page 4)
Currency composition The euro and the US dollar are the most widely
traded currencies in single currency interest rate derivatives, with 37% and
35% shares respectively in 2008 (Table 3). They were followed by the
Japanese yen with over 13% and pound sterling 7%. Swedish krona and
Swiss franc each made up just over 1% and other currencies 5%.
Table 2 Risk instruments in global OTC markets
Notional amounts outstanding in December
$ trillion
2002 2004
2006 2007
Interest rates
102
191
393
292
Foreign exchange
18
29
56
40
Credit default swaps --6
58
29
Equity-linked
2
4
8
7
Commodity
1
1
8
7
Unallocated
18
27
71
43
Total contracts
142
259
595
418
2008
419
50
42
6
4
71
592
% share
Interest rates
71.8
Foreign exchange
13.0
Credit default swaps
--Equity-linked
1.6
Commodity
0.7
Unallocated
12.9
Total contracts
100.0
70.7
8.4
7.1
1.1
0.7
12.0
100.0
73.7
11.3
2.5
1.7
0.6
10.3
100.0
69.7
9.6
6.9
1.8
1.7
10.3
100.0
66.0
9.4
9.7
1.4
1.4
12.0
100.0
Source: Bank for International Settlements
Table 3 Currency breakdown of single currency
interest rate derivatives
Notional amounts outstanding
$ trillion, by currency, end-year
Euro
US dollar
Japanese yen
£ sterling
Swedish krona
Swiss franc
Others
All currencies
2007
146
130
53
28
5
4
27
393
2008
155
146
56
30
5
5
22
419
-----% share------
2007
37.2
33.0
13.5
7.2
1.3
1.0
6.7
100.0
2008
37.0
34.9
13.5
7.1
1.2
1.2
5.2
100.0
Source: Bank for International Settlements
II. BIS coordinated triennial central bank survey (April 2007)
Location International OTC derivatives trading is heavily concentrated in the
UK and US (Table 4). The share of global turnover of the UK and US
remained stable at 43% and 24%, respectively, in the April 2007 survey.
Over the longer period the UK’s share has risen from 36% in 2001, while the
US share has grown from 18%. Germany’s market share dropped from 13%
in 2001 to 4% in 2007 and France from 10% to 7%. Ireland showed the
largest gain with its share rising from less than 1% in previous Table 4 Location of OTC derivatives turnover
surveys to over 3% in 2007. Japan’s share also edged up to just
Average daily turnover in April
over 3%.
Counterparties The major feature of the global counterparty
breakdown was a further rise in the share of other financial
institutions to 44%, close to the 46% share of reporting dealers.
The global share of non-financial customers also edged up to
10%. Distribution of trading by counterparty in the UK was
more closely aligned with global shares in 2007 than
previously.
Concentration The OTC derivatives market in the UK became
even more concentrated between 2004 and 2007, with the share
-------------------$bn------------------1998 2001 2004 2007
UK
275
171
643 1081
US
135
90
607
355
France
67
46
183
154
Germany
97
34
93
46
Japan
22
42
85
39
Ireland
6
3
85
13
Switzerland
15
16
73
18
Singapore
6
11
69
17
Italy
24
5
32
41
Others
141
62
268
223
Total
764 1508 2544
475
-----------------% share-----------------2004 2007
1998
2001
42.6
42.5
36.0
36.0
23.5
23.9
18.9
17.7
10.2
7.2
9.7
8.8
3.1
3.7
7.2
12.7
2.6
3.3
8.8
2.9
0.9
3.3
0.6
0.8
1.2
2.9
3.4
2.0
1.1
2.7
2.3
0.8
2.7
1.3
1.1
3.1
14.8
10.5
13.1
18.5
100.0 100.0 100.0 100.0
Source: Bank for International Settlements
3
IFSL
of the largest 10 institutions rising from 79% to 81%. In 1995 the share of the
top ten had been 52%. In the US, the other major location, survey data
indicates that in 2007 the share of the largest ten institutions was even
higher than in the UK at over 90% of turnover.
III. Other developments in OTC derivatives markets
Centralised clearing Concerns about the systemic risk posed by some OTC
derivatives contracts were raised in the wake of the credit crunch. These
focused on the potential impact of the collapse of Lehman Brothers on other
brokers; and the potential threat posed by the huge volume of toxic securities.
As a result some classes of standardised OTC derivatives contracts,
including interest rate swaps, commodities and CDS have been brought into
centralised clearing.
Derivatives 2009
Chart 4 Credit default swaps
$ trillion, notional amounts outstanding, end-year
ISDA
60
50
40
30
BIS
20
10
Credit default swaps (CDS) In CDS one party promises to pay another party
0
2000 2001 2002 2003 2004 2005 2006 2007 2008
a fixed fee in exchange for a guarantee that if a bond defaults it will be
Source: International Swaps and Derivatives Association (ISDA),
Bank for International Settlements (BIS)
redeemed. Centralised clearing and voluntary termination of contracts has
contributed to a 39% drop in notional amounts outstanding of CDS from
$62 trillion at end-2007 to $38 trillion at end-2008, according to the
Table 5 Gas & power derivatives
International Swaps and Derivatives Association (ISDA) (Chart 4). This
Contracts transacted by brokers in the UK,
decline is slightly larger than the 28% fall in the BIS data, although
Twelve months ending July
% change
previously the two series have moved closely in parallel. ISDA’s longer
Size of market, TWH* 2004 2005 2006 2007 2008 2008
12
1311 688 646 985 1104
UK power
time series show that notional value of CDS had mushroomed over the
-23
4206 5089 6131 12810 9919
UK gas
previous four years from less than $4 trillion at end-2003.
-41
2879 2525 3127 6337 3758
Euro power
Energy derivatives There are a range of participants actively trading
energy-related financial instruments including oil and gas producers,
utilities, refiners and other industrial consumers, investment banks and
hedge funds. Following several years of strong growth in the energy OTC
derivatives markets covering power and gas forward contracts, trends in the
year to end-July 2008 were more mixed. The FSA’s annual survey of
energy market brokers showed that volumes in 2008 in the UK gas and
European power were down by 23% and 41% respectively having both
doubled in 2007 (Table 5). These two markets remain the largest by
volume. By contrast the other four markets all saw growth in trading in
2008, particularly emissions trading.
Applied prices rose by between 50% and 100% in the markets covered in the
survey. This is consistent with the strong rise in global commodity prices that
was in evidence across the survey period. As a result, the notional value of
four of the six markets - UK power, Euro gas, coal and emissions - more than
doubled in 2008. Notional value of gas contracts also rose, by 31% to
£176bn, as the jump in prices more than offset the 23% fall in volume. In the
case of European power notional market value fell by 9% as the 54% rise in
price was insufficient to counter the drop in volume. Between a half and three
quarters of business in the various markets was traded through screen-based
electronic platforms.
Freight derivatives A number of the large broking houses are using freight
derivatives to hedge or take a position on the future movement of freight
rates. According to Baltic Exchange estimates, the notional value of trading
in Forward Freight Agreements (FFAs) in the OTC derivatives market rose
from $142bn in 2007 to $163bn in 2008, although the steep decline in
4
895
Euro gas
576
Coal (m tonnes)
1
Emissions (m tonnes)
689
415
121
673 1110 1509
926 1305 1595
379 780 1956
36
22
151
Notional value of market, £bn
35
UK power
40
UK gas
45
Euro power
3.5
Euro gas
--Coal
--Emissions
25
54
77
7
45
1.5
30
108
147
11
107
5.5
30
134
193
11
46
8.8
110
31
-9
145
143
302
63
176
178
27
111
36
*TWH: terawatt hours
Source: FSA survey of energy derivatives markets
Chart 5 Freight derivatives
$bn, notional freight value of Forward Freight Agreements
traded each year
160
140
120
100
80
60
40
20
0
2000 2001 2002 2003 2004 2005 2006 2007 2008
Source: Baltic Exchange, Forward Freight Agreement Brokers' Association
IFSL
shipping markets is likely to result in a much smaller market in 2009
(Chart 5). Previously the market expanded rapidly from $7bn in 2002 to
$61bn in 2006. Up until the drop in the market in autumn 2008, FFAs were
being increasingly used by larger charterers, shipowners and also by
financial institutions such as investment banks. The dry bulk market, such as
grain and coal, accounted for 95% of the total value of contracts in 2007 and
2008 with wet cargoes, such as oil, making up the remaining 5%. The
predominance of dry bulk is due to the much higher share of freight costs in
the dry market.
EXCHANGE-TRADED DERIVATIVES MARKETS
Derivatives 2009
Chart 6 International exchange-traded
derivatives turnover by region
$ trillion, annual value of turnover
2250
2000
Europe
1750
8%
North America
1500
7%
1250
7%
9%
750
International trading on the exchanges is most easily compared on the basis
of the number of contracts traded, although these comparisons are heavily
influenced by the contract sizes selected by individual exchanges. Small
contract sizes raise the number of contracts traded, a particular feature of the
Korean, Mexican and Brazilian exchanges, where trading is dominated by
individual rather than institutional investors. Comparisons based on the
nominal value of turnover therefore provide a better indicator of the relative
size of the exchanges.
Value of turnover Notional outstanding value of exchange-traded
derivatives fell by 29% in the second half of 2008 (Chart 1), while value of
turnover dropped by 47% in the 12 months to Q1 2009 (Chart 2). Strong
trading in the first half of 2008 meant that annual turnover fell by only 3% to
$2,213 trillion, having risen by about a quarter annually in each of the four
previous years (Chart 6). BIS notes that the decline in trading during the
second half of 2008 reflects a combination of significantly reduced risk
appetite, expectations of stable low interest rates in major markets and lower
hedge fund activity. The decline in turnover slowed to 3% between Q4 2008
and Q1 2009 (Chart 2).
500
15%
9%
32%
250 34% 59%
0
Number of contracts traded The number of contracts transacted
through derivatives exchanges worldwide has continued to rise in
2008 to 17.8bn. CME Group, with 3.3bn contracts, is the largest
2
3
4
5
6
7
8
9
10
11
12
13
14
21
35%
39%
51%
8%
33%
41%
56%
53%
59%
50%
32%
35%
38%
60%
54%
58%
2000 2001 2002 2003 2004 2005 2006 2007 2008
Source: Bank for International Settlements
Chart 7 Largest derivatives exchanges
Value of derivatives turnover, $ trillion
1200
CME
1000
800
NYSE Liffe
600
400
Eurex
200
0
Turnover of exchange-traded derivatives is heavily concentrated on the Source: CME Group, NYSE Liffe & Eurex
exchanges of North America and Europe, which have accounted for over
90% of trading by value in recent years. According to BIS data, 53%
of turnover by value in 2008 was based in the North American Table 6 Largest derivatives exchange groups
exchanges, 39% in Europe, 7% in Asia/Pacific and 1% in other Annual number of contracts traded, millions
regions of the world (Chart 6). Europe’s share has picked up from
Exchange
2005 2006 2007
1940 2443 3158
1 CME Group
32% in 2006, while North America’s has fallen back from 60%.
Mergers and acquisitions in recent years have produced a number of
exchange groups that each own several subsidiary exchanges. The
largest such exchange group is CME Group, which includes the
Chicago Mercantile Exchange, the Chicago Board of Trade and New
York Mercantile Exchange. NYSE Euronext, which incorporates the
NYSE Liffe, is the second largest on value of trading, followed by
Eurex (Chart 7). Over a half of the value of turnover on financial
exchanges is concentrated amongst these three exchange groups.
8%
Other regions
1000
International exchange trading
9%
2000 2001 2002 2003 2004 2005 2006 2007 2008
Eurex
1697
Korea Futures Exchange
2593
NYSE Euronext1
1106
CBOE Holdings
468
BM & F Bovespa
466
Nasdaq OMX Group
266
National Stock Exchange of India
132
SAFEX Securities Exchange
51
Dalian Commodity Exchange
198
Russian Trading Systems Stock Exch. 53
Intercontinental Exchange2
82
Zhengzhou Commodity Exchange
28
Boston Options Exchange
78
London Metal Exchange
79
2119
2475
1124
675
571
396
194
105
120
80
140
46
94
87
2704
2777
1525
946
794
551
380
330
186
144
196
93
130
93
2008
3278
3173
2865
1674
1195
742
722
590
514
313
238
237
223
179
113
1Includes
NYSE Liffe markets in London, Amsterdam, Paris, Brussels & Lisbon
ICE Europe basd in London
Source: Futures Industry Association
2Includes
5
IFSL
exchange based on the number of contracts traded (Table 6), followed by
Eurex 3.2bn, the Korea Futures Exchange 2.9bn, and NYSE Euronext 1.7bn.
Looking at other UK-based exchanges, ICE Futures Europe accounts for the
majority of trading in Intercontinental Exchange, the 12th exchange listed,
while the London Metal Exchange is 21st. Based on the location of the
subsidiary exchanges, the US accounted for 39% of the number of contracts
traded in 2008 followed by South Korea 16%, Germany 12% and the UK 6%
(Table 7).
Electronic trading European financial exchanges have been electronic since
the late 1990s, and electronic trading on the US derivatives exchanges has
become predominant. On CME Group, the share of electronic trading has
risen from 20% in 2001 to 83% in 2008.
Exchange traded derivatives in the UK
There are four derivatives exchanges operating in the UK, all of which had a
record year in 2008 for number of contracts traded:
NYSE Liffe Following the merger of Liffe’s parent Euronext with NYSE, it
was renamed NYSE Liffe. Turnover at NYSE Liffe rose by 11% in 2008 to
1.05bn contracts (Table 8). Trading in short term euro interest rate contracts,
for which NYSE Liffe is the leading exchange, has accounted for 97% of the
exchange’s annual turnover by value in recent years. Trading on the London
platform accounted for 98% of the value of all Liffe turnover in 2008.
London Metal Exchange Turnover of LME contracts rose by 23% in 2008 to
reach 113m contracts. Primary aluminium has been the most widely traded
metal in recent years. It accounted for 46% of trading in 2008, followed by
copper 25% and zinc 15%: these shares are much in line with previous years.
ICE Futures Europe ICE Futures Europe turnover rose by 10% to 153m
contracts in 2008, but had risen much more rapidly in the previous two years
partly due to the introduction of the West Texas Intermediate launched in
2006. Brent Crude futures remains the biggest contract with 45% of turnover
in 2008. Trading in the two key oil contracts rose by over 50% to 111m.
European Climate Exchange (ECX), which is part of ICE Futures Europe, is
the dominant exchange for futures and options trading in the EU Emissions
Trading Scheme. ECX accounted for 91% of futures and options contracts
traded in the EU ETS in 2008 and 98% in the first five months of 2009
(Table 9).
EDX London Trading in the exchange’s indices and single stock products
totalled 60m contracts in 2008 up from 43m in 2007.
Remote trading from the UK The UK is an important source of remote
trading for the increasing volume of derivatives business globally that is
transacted electronically. A geographic breakdown for the origination of
Eurex derivatives contracts data shows that, since the move from floor to
remote electronic trading in the mid-1990s, UK-based traders have become
increasingly prominent. The share of Eurex contracts sourced from the UK
has been at least 45% each year since 2003 (Chart 8). Liffe estimates that
60% of its business originates in London.
Derivatives 2009
Table 7 Exchange-traded derivatives turnover,
based on location of subsidiary exchanges
Annual number of contracts traded, millions
2006
US
4573
Korea
2475
Germany
1527
UK
724
Brazil
571
India
293
China
225
South Africa
105
Russia
120
Japan
218
Other countries 1180
Total
12011
% share
2006 2007
38.1 39.1
20.6 17.8
12.7 12.2
6.2
6.0
5.1
4.8
3.1
2.4
2.3
1.9
2.1
0.9
1.5
1.0
1.9
1.8
8.6
9.8
100.0 100.0
2008
39.1
16.1
12.2
6.4
4.2
4.0
3.8
2.9
2.1
1.8
7.5
100.0
Source: Futures Industry Association
Table 8 Turnover of London-based
derivatives exchanges
Millions of contracts traded each year
NYSE
EDX
ICE Futures
Liffe2
LME London3
Europe1
1990
34.3
13.4
--6.9
1995
136.4
47.2
--15.0
2000
131.1
66.4
--25.5
2005
759.3
78.6
20.3
42.1
2006
730.3
86.9
28.8
92.9
2007
949.0
92.1
43.1
138.5
2008
113.2
59.9
153.0 1049.7
20094
439.4
44.8
26.0
64.6
Total
54.6
198.6
223.0
900.3
939.0
1222.8
1375.7
574.7
1IPE before 2005 2Includes other NYSE Liffe exchanges after 2000
3EDX London was created in 2003
4First 5 months of 2009
Source: Exchanges
Table 9 EU ETS futures & options exchange trading
Volume of emissions transacted through futures & options,
million tonnes CO2 (mtCO2)
Nord
Other
Pool exchanges
Total
ECX/ICE
2005
28
123
94
--2006
59
517
453
4
2007
95
1159
1038
26
2008
107
2441
2234
101
2009*
15
1922
1892
15
Source: Thomson Reuters
*First five months of 2009
Chart 8 Turnover of Eurex participants
by country of origin
Millions of derivatives contracts traded each year
2200
2000
Other countries
1800
Germany
1600
UK
35%
38%
1400
35%
1200
35%
800
600
17%
20%
400
0
19%
16%
1000
200
6
2007 2008
6091 6952
2777 2865
1900 2165
970 1135
794
742
484
709
364
676
330
514
229
370
292
316
1338 1266
15570 17771
38%
12%
81%
7%
1997
Source: Eurex
46%
46%
2007
2008
48%
32%
30%
45%
2000
2003
2006
IFSL
CONTRIBUTION OF DERIVATIVES TO THE UK ECONOMY
Derivatives provide a set of risk management tools for a wide range of
organisations, so the wider economic contribution of derivatives is seen in the
benefits they bring to individuals and businesses - access to finance at lower
costs, achieving more stable commodity prices and controlling foreign
exchange risk for importers and exporters.
The estimation of derivatives' contribution to the economy in terms of shares
of GDP, employment and overseas earnings is not straightforward. In other
financial markets the value of activity is related to revenue and profits of the
firms involved. With derivatives the measures of market activity cannot be so
easily ascertained, partly because the value of a derivative is related to the
shifting value of the underlying asset. Available data for the UK is set out
below.
Employment related to the derivatives markets is widely spread across
trading floors in investment banks, derivatives exchanges, other dealers of
futures, options and commodities, and various support and back office
functions. It is estimated that there are about 10,000 people employed in
derivatives in central London.
Derivatives 2009
Chart 9 UK banks' net exports from
spread earnings
£bn, spread earnings on derivatives, foreign exchange
trading & other securities' transactions
10
8
6
4
2
0
1997
1999
2001
2003
2005
2007
Source: Office for National Statistics, Bank of England
Overseas service earnings include banks’ spread earnings and net fee income
on derivatives contracts; fee income of futures and options dealers; and fees
and commissions on exchange contracts of UK-based derivatives exchanges.
Banks’ spread earnings and fee income Banks generate substantial earnings
from spread earnings on derivatives, foreign exchange trading and other
securities transactions. These net exports, currently published as an
aggregate, have grown rapidly since 2000, reaching £9.5bn for 2007, the
latest available year, and 35% up on £7.0bn in 2006 (Chart 9). Overall
figures for UK financial sector exports showed surprising buoyancy in 2008,
so spread earnings are likely to have remained in the region of £10bn in 2008.
Derivatives are estimated to account for the majority of banks’ spread
earnings.
Separate data on banks’ net fee income is based on gross derivative fees
receivable from foreign residents for derivatives services, netted off against
fees payable. Because of the move to inclusion of the commission in the
spread, data reported by banks’ to the Bank of England on their net overseas
service earnings from derivatives is modest, although a surplus of £218m in
2007 reversed a deficit of £118m in 2006.
Fee income of futures and options dealers Net exports of futures and options
dealers have not been separately identified in balance of payments statistics
since 2002 when they totalled around £250m.
Fees and commissions on exchange contracts and clearing These are
significant as a majority of customers of UK exchanges and clearing
organisations are based overseas or owned by overseas companies,
three-quarters in the case of Liffe and over 90% at the LME.
International investment position Growing derivatives business of the UK
financial sector is also reflected in the rising value of financial derivatives in
the international asset position of UK financial institutions. Data shows that
financial derivatives assets rose by 62% between end-2006 and end-2007 to
Chart 10 Financial derivatives: international
assets of UK financial institutions
Financial derivatives, assets valued at end-year, £bn
1800
1600
Securities dealers etc.
Banks
1400
1200
1000
800
600
400
200
0
1999 2000 2001 2002 2003 2004 2005 2006 2007
Source: Office for National Statistics, Bank of England
7
IFSL
Derivatives 2009
reach £1,824bn (Chart 10). Data published by the ONS, based on Bank of
England data, is at present experimental, and so is not yet included in the
financial account of the UK balance of payments.
Banks account for around three quarters of financial derivatives assets - 76%
in 2006 and 2007 - with securities dealers making up nearly all of the
remainder. Insurance companies and pension funds contribute less than 1%
of the total. The share of securities dealers has doubled from around 12%
between 1999 and 2002 to about 24% in 2006 and 2007.
OTHER SOURCES OF
INFORMATION
Alternative Investment Management
Association.
www.aima.org
Association of Corporate Treasurers
www.treasurers.org
Bank for International Settlements
Triennial surveys of OTC derivatives
markets
International Banking and Financial
Market Developments (quarterly).
www.bis.org
Eurex
www.eurexchange.com
Futures and Options Association
www.foa.co.uk
Futures Industry Association
www.futuresindustry.org
ICE Futures Europe
www.theice.com
International Swaps and Derivatives
Association
www.isda.org
Bank of England
www.bankofengland.co.uk
LCH.Clearnet
www.lchclearnet.com
Bourse Consult
Current issues affecting the OTC
derivatives market and its importance
to London, April 2009
www.bourse-consult.com
London Metal Exchange
www.lme.co.uk
NYSE Liffe
www.euronext.com/derivatives
Financial Services Authority
Analysis of activity in the energy
markets 2008
www.fsa.gov.uk
Thomson Reuters
Carbon Market Community
/Carbon
EDX London
www.londonstockexchange.com/edx/
IFSL Research:
Report author: Duncan McKenzie
Director of Economics, Duncan McKenzie
+44 (0)20 7213 9124
Senior Economist: Marko Maslakovic
+44 (0)20 7213 9123
International Financial Services London
29-30 Cornhill, London, EC3V 3NF
This report on Derivatives is one of 15 financial sector reports
published by IFSL. All IFSL’s reports can be downloaded at:
www.ifsl.org.uk
© Copyright June 2009, IFSL
Data files
Datafiles in excel format for all charts and tables
published in this report can be downloaded from the Reports
section of IFSL’s website www.ifsl.org.uk
Sign up for new reports
If you would like to receive immediate notification by email of
new IFSL reports on the day of release please send your email
address to
In partnership with:
International Financial Services
London is a private sector organisation, with
nearly 40 years experience of promoting the
UK-based financial services industry
throughout the world.
8
City of London Corporation administers
and promotes the world’s leading international
finance and business centre and provides free
inward investment services.
UK Trade & Investment helps UK-based
companies succeed in international markets
and assists overseas companies to bring high
quality investment to the UK’s vibrant
economy.
This brief is based upon material in IFSL’s possession or supplied to us, which we believe to be reliable. Whilst every effort has been made to ensure its accuracy, we
cannot offer any guarantee that factual errors may not have occurred. Neither International Financial Services London nor any officer or employee thereof accepts any
liability or responsibility for any direct or indirect damage, consequential or other loss suffered by reason of inaccuracy or incorrectness. This publication is
provided to you for information purposes and is not intended as an offer or solicitation for the purchase or sale of any financial instrument, or as the provision of
financial advice. Copyright protection exists in this publication and it may not be reproduced or published in another format by any person, for any purpose. Please
cite source when quoting. All rights are reserved.