Influence of adsorption on the photocatalytic properties of tio2 AC composite materials in the acetone and cyclohexane vapor photooxidation reactions
Bạn đang xem bản rút gọn của tài liệu. Xem và tải ngay bản đầy đủ của tài liệu tại đây (1.46 MB, 9 trang )
Journal of Photochemistry and Photobiology A: Chemistry 229 (2012) 11–19
Contents lists available at SciVerse ScienceDirect
Journal of Photochemistry and Photobiology A:
Chemistry
journal homepage: www.elsevier.com/locate/jphotochem
Influence of adsorption on the photocatalytic properties of TiO2 /AC composite
materials in the acetone and cyclohexane vapor photooxidation reactions
D.S. Selishchev, P.A. Kolinko, D.V. Kozlov ∗
Boreskov Institute of Catalysis, Novosibirsk 630090, Russian Federation
a r t i c l e
i n f o
Article history:
Received 14 June 2011
Received in revised form 5 December 2011
Accepted 10 December 2011
Available online 19 December 2011
Keywords:
Gas-phase photocatalysis
Adsorption
Titanium dioxide
Activated carbon
a b s t r a c t
A series of TiO2 /AC composite photocatalysts with various TiO2 contents was prepared by thermal hydrolysis method of a TiOSO4 water solution in the presence of activated carbon particles. XRD, SEM and BET
methods revealed that in all cases deposited TiO2 is an anatase with ∼170 m2 /g specific surface area. All
samples were tested in gaseous acetone and cyclohexane vapor photocatalytic oxidation in static and
continuous flow reactors. Complete photocatalytic mineralization of both model pollutants without formation of gaseous intermediates was observed. Only TiO2 /AC catalysts with TiO2 content higher than
50% demonstrated good photocatalytic activity. The same amounts of individual TiO2 and AC powders
as in the case of 70%-TiO2 /AC composite photocatalyst were placed separately in the static reactor and
kinetic curves of the cyclohexane photocatalytic oxidation were compared for both cases. When TiO2 and
AC were used separately complete mineralization of cyclohexane was not observed even after 4 h of the
PCO. Whereas in the case of 70%-TiO2 /AC sample expected CO2 level was almost achieved after 120 min.
The most likely reason of this difference is the absence of reagents and intermediates surface transfer
between separated individual TiO2 and AC powders.
L.-H. kinetic model was used to describe experimental data in the flow reactor. Obtained results demonstrated that effective adsorption constants for TiO2 /AC photocatalysts were about 2 times higher than
for pure TiO2 . Model of TiO2 /AC composite photocatalyst with increased photocatalytic and adsorption
properties was suggested.
© 2011 Elsevier B.V. All rights reserved.
1. Introduction
Well-known methods for water and air purification are based
on the usage of certain types of adsorbents. The most popular
adsorbent is activated carbon (AC) due to its high pore volume
and surface area and high adsorption capacity [1]. Main drawback
of pollutants removal with adsorbent is the decrease of purification efficiency with time and importance of regular regeneration.
There also exists a problem of further utilization of accumulated
pollutants.
Heterogeneous photocatalytic oxidation (PCO) is promising
method to remove volatile organic compounds (VOCs) from indoor
air especially at low concentrations, because it allows a lot of pollutants to be oxidized with formation of CO2 and H2 O as final products
[2,3]. Most of researches are focused on the application of TiO2 as
photocatalyst due to its high activity [4–6]. Titanium dioxide allows
many type of organic compound to be decomposed effectively both
in air and in water [7–9]. However, there are some limitations of
TiO2 -mediated photocatalytic oxidation. The first drawback is the
∗ Corresponding author. Tel.: +7 383 3331617; fax: +7 383 3331617.
E-mail address: (D.V. Kozlov).
1010-6030/$ – see front matter © 2011 Elsevier B.V. All rights reserved.
doi:10.1016/j.jphotochem.2011.12.006
low adsorption capacity of TiO2 and insufficient PCO rate. As a result
it is usually required a long time to mineralize organic admixtures
completely. The second drawback is a formation of intermediates,
which could cause photocatalyst deactivation, for example, in the
case of aromatic and heteroatom containing organic compounds
PCO [10,11]. Sometimes intermediates could be more harmful than
starting pollutant [12], and in this case the PCO could become the
source of even higher air or water pollution.
Photocatalytic process could be considered as substrate adsorption on the catalyst surface and subsequent oxidation by active
species forming under UV irradiation. On this basis it is possible
to modify photocatalysts to increase efficiency of photocatalytic
oxidation process at every step: adsorption and oxidation. Kinetic
constant could be increased, for example, by noble metals depositions on the catalysts surface [13]. In this case metal particles
accumulate electrons improving charge separation and reducing
electron–hole recombination rate giving the overall enhancement of photoreactions efficiency. Adsorption constant could be
increased by H2 SO4 treatment of the TiO2 surface [13].
An alternative way of improving photocatalyst adsorption
ability is addition of adsorbent in the photocatalytic system or
making TiO2 /adsorbent composite system, in which TiO2 would
be deposited on adsorbent surface. In the first case photocatalyst
12
D.S. Selishchev et al. / Journal of Photochemistry and Photobiology A: Chemistry 229 (2012) 11–19
and adsorbent are used separately [14]. Shiraishi et al. [15] used
a photocatalytic reactor combined with a continuous adsorption
and desorption apparatus for treatment of gaseous formaldehyde
in a small chamber. Other researchers [16] used aqueous suspended
mixture of TiO2 and AC for the photocatalytic degradation of phenol. They revealed that the apparent first-order rate constants were
higher for mixed TiO2 + AC system than for TiO2 alone.
Earlier we reported the computer simulation study and demonstrated that in the case of separate adsorbent and photocatalyst
usage adsorbent works as a buffer [17]. On the other hand the
use of supported TiO2 /adsorbent photocatalyst could be more
beneficial due to reversible surface transfer of reagents and
intermediates from catalyst to adsorbent surface. In this case
the gaseous intermediates concentration as well as the effective
time of substrate removal could be decreased [17]. Supported
TiO2 /adsorbent photocatalysts have been extensively investigated
in the recent time. A number of materials were used as a TiO2
support: glass [18], organic and inorganic fibers [19], activated carbon [20], SiO2 [18] and Al2 O3 [21]. Torimoto and co-workers [22]
demonstrated that the rate of CO2 accumulation for propyzamide
oxidation over 70%-TiO2 /adsorbent photocatalysts was reduced in
the adsorbent sequence AC–SiO2 –mordenite–pure TiO2 . It correlated with amount of adsorbed substrate. Takeda and co-workers
[23] reported that the highest formation rate of final product –
CO2 in the photodecomposition of gaseous propionaldehyde was
observed for a TiO2 /adsorbent photocatalysts with medium adsorption constant.
Many researchers investigated carbon materials, and AC in particular, in combination with TiO2 . A lot of methods were applied
to prepare photocatalytically active TiO2 /AC samples: aggregation
into solution [24], sol–gel [25], hydrothermal synthesis [26], CVD
[27]. Some good reviews regarding preparation routes and their
effects on photocatalytic activity of TiO2 /AC have been published
recently [28,29]. Most investigations are devoted to photocatalytic
oxidation of pollutants over TiO2 /AC in water solutions [26,27,30].
Enhanced photocatalytic activity of TiO2 /AC in comparison to TiO2
alone (synergism) are often explained by adsorption of substrate
on AC surface followed by surface transfer to photocatalytically
active TiO2 . This conclusion is often based on the analysis of substrate removal kinetic curve only. According to our opinion such
approach is not sufficient because faster substrate removal could
be explained by adsorption whereas photocatalytic activity of composite TiO2 /AC system could be decreased. In this way analysis of
products accumulation kinetic curves should be done also.
A quantity of papers about gas-phase oxidation with mixed
TiO2 /adsorbent photocatalysts is much smaller. Kuo et al. [31]
used TiO2 (P25)/AC photocatalyst in a fluidized bed photoreactor for
toluene oxidation at 200–1000 ppm toluene concentration in flow
reactor. They revealed that TiO2 /AC catalysts had high adsorption
capability and steady-state toluene conversion was about 3 times
higher with TiO2 /AC photocatalyst than with pure TiO2 . In some
conditions toluene concentration could be reduced to the maximum contaminant level (about 100 ppm) and kept in this stage for
at least 11 h. Other researchers [32] immobilized TiO2 on an activated carbon (TiO2 /AC) filter installed in a commercial air cleaner
and tested it in the PCO of NO and toluene removal at ppb level.
Bouazza and co-workers [33] prepared pellets of TiO2 P25 and pellets of 70%-TiO2 /AC and used them in photocatalytic oxidation of
propene and benzene in dry and humidified conditions. In humidified air the agglomerated TiO2 /AC photocatalyst was the most
active for benzene PCO. On the other hand Torimoto et al. [34]
reported that in gaseous dichloromethane oxidation the photocatalytic activity of chemically prepared 80%-TiO2 /AC catalyst was
lower than for unmodified TiO2 .
To summarize it could be concluded that presence of AC
in photocatalysts composition could be positive or negative for
different type of organic compounds and this effect depends on
the nature of interaction between substrate and support. Investigations of pollutant photooxidation in gas phase have received
insufficient researcher’s attention. In present work we compared
kinetics of gaseous substrates photocatalytic oxidation in static and
flow reactors for TiO2 /AC catalysts since this question still remained
without attention. Acetone and cyclohexane were chosen as polar
and nonpolar model substrates and kinetics of their PCO was investigated using different TiO2 /AC photocatalysts prepared by thermal
hydrolysis method.
2. Materials and methods
2.1. Reagents
Activated carbon powder (SORBENT Inc., Russia) was chosen as a
porous support for TiO2 deposition. Before synthesis it was washed
out thoroughly by distilled water. The other reagents were purity
grade and used for synthesis of catalysts and oxidation experiments as purchased: sulfuric acid (H2 SO4 , 93.5–95.6%, PKF ANT Inc.,
Russia), titanyl sulfate (TiOSO4 ·2H2 O, >98%, VEKTON Inc., Russia),
acetone (CH3 COCH3 , >99.8%, MOSREAKTIV Inc., Russia), cyclohexane (C6 H12 , >99%, PIRIMIDIN Inc., Ukraine).
Titanyl sulfate water solution used for thermal hydrolysis synthesis was approximately 10 wt.% concentration and was prepared
by dissolution of 50–55 g of TiOSO4 ·2H2 O in 450 ml of distilled
water during 24 h at constant mixing. Finally, small amount of the
undissolved TiOSO4 was separated by centrifugation. As prepared
solution was then stabilized by addition of H2 SO4 to adjust its concentration to about 0.1 M value. Final TiOSO4 solution was kept in
cold.
2.2. Catalysts preparation
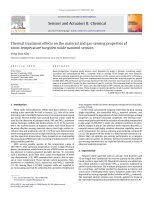
Brief description of thermal hydrolysis synthesis is shown in
Fig. 1. The main varying parameter was the TiO2 content in the
sample. To prepare 1 g of TiO2 /AC sample with X wt.% TiO2 content (1 − (X/100)) g of AC were suspended into the V = (X/8C) ml of
TiOSO4 water solution with concentration C (mol/l). Samples in this
series were marked as X-TC where X was the TiO2 content (wt.%).
TiO2 sample (without AC) synthesized by thermal hydrolysis was
marked as s-TiO2 .
2.3. Characterization of catalysts
TiO2 content in X-TC series was measured using the X-ray
fluorescence spectrometer VRA-30 with chromic anode. The morphology of samples was studied by scanning electron microscopy
(SEM) using the LEO-430 spectrometer (Carl Zeiss). N2 adsorption
isotherms were measured at 77 K using a Micromeritics ASAP 2020
instrument. The specific surface area was calculated by the BET
method. For pore volume characterization was used single point
adsorption total pore volume at (P/Po ) ∼ 1. The crystal phase identification was carried out by the X-ray powder diffraction with a
X’tra (Thermo) diffractometer using CuK␣ radiation and scanning
in the 2Â range of 15–85◦ . The (2 0 0) plane diffraction peak for
anatase (2Â = 48.09◦ ) was used to calculate TiO2 crystallite size on
the assumption of spherical shape. UV–vis diffuse reflectance spectra were measured using Lambda 35 spectrophotometer (Perkin
Elmer) equipped a diffuse reflectance accessory with reference to
MgO powder.
2.4. Kinetic measurements
In the present work two types of reactor were used for kinetic
experiments.
D.S. Selishchev et al. / Journal of Photochemistry and Photobiology A: Chemistry 229 (2012) 11–19
13
Fig. 2. The static reactor for kinetic measurements. Experimental conditions: reactor volume 300 cm3 ; temperature 25 ◦ C; optical path length 10 cm; irradiation by
light of 1000 W high pressure Hg lamp DRSH 1000 (Russia) which was passed
through a BS-4 300 nm cutoff filter, UV light intensity 13 mW/cm2 .
Table 1
TiO2 content and textural properties of TC series samples.
Sample
TiO2 content
(wt.%)
BET surface area,
A (m2 /g)
Single point total
pore volume, V
(cm3 /g)
AC
s-TiO2
80-TC
70-TC
50-TC
30-TC
20-TC
–
100
78.0
67.0
50.1
31.9
21.0
825
167
317
389
510
639
696
0.54
0.20
0.29
0.34
0.35
0.40
0.42
(Thermo) FTIR spectrometer. The PCO rate was calculated according
to the following formula: WCO2 = CCO2 · U, where CCO2 is the
difference of CO2 concentrations in the outlet and inlet of the flow
reactor, U is volumetric flow rate.
3. Results and discussion
Fig. 1. Brief description of TiO2 /AC photocatalysts preparation by TiOSO4 thermal
hydrolysis.
Static reactor (Fig. 2) was used for acetone and cyclohexane
vapor PCO kinetic measurements. This reactor was installed in the
cell compartment of Nicolet 380 (Thermo) FTIR spectrometer.
Samples were uniformly deposited onto the glass support so
that illuminated area was about 3.1 cm2 for acetone oxidation
and 7 cm2 for cyclohexane oxidation. Photocatalyst density was
1 mg/cm2 to provide complete light absorption. Before the beginning of every experiment photocatalyst samples were irradiated
with UV light during 3–4 h in order to completely oxidize some previously adsorbed surface species. Then a certain amount of liquid
acetone (0.4 l) or cyclohexane (0.8 l) was injected and evaporated for 30 min until adsorption–desorption equilibrium was
established. Finally the illumination was turned on and gas-phase
IR spectra were taken periodically.
Steady-state values of cyclohexane PCO rate were measured in
a flow-circulating reactor (Fig. 3). The cyclohexane PCO was studied
at substrate concentration range 0–30 mol/l. Other operational
parameters were: temperature – 40 ◦ C, relative humidity (RH) –
46 ± 2%, volumetric flow rate (U) – 28 cm3 /min, Phillips 9 W 365 nm
UV-A light source, irradiated area of the sample ∼ 7 cm2 , sample
density – 1 mg/cm2 .
The CO2 and cyclohexane concentrations were measured using
gas cell (Fig. 3(7)) installed in the cell compartment of Nicolet 380
3.1. Characteristics of synthesized photocatalysts
Five samples of TC series were synthesized with TiO2 content
20, 30, 50, 70 and 80 wt.%. Results of X-ray fluorescence analysis
indicated that quantities of TiO2 in the synthesized catalysts were
close to calculated values (Table 1).
SEM photographs of AC, TiO2 and some TiO2 /AC demonstrate
that the original AC powder consists of fragments of carbonized
matter (Fig. 4A). The synthesized TiO2 particles have spherical
shape. Small TiO2 particles with sizes in the range from 3 to
8 m form large agglomerates with average size about 50–200 m
(Fig. 4B).
SEM photos illustrate that TiO2 deposition by thermal hydrolysis of TiOSO4 solution leads to formation of 3–5 m size crystallites
on the AC external surface (Fig. 4C) which becomes completely covered with TiO2 particles as the TiO2 content reaches 80 wt.% value
(Fig. 4D).
XRD patterns of TiO2 and some TiO2 /AC samples (Fig. 5) demonstrate that pure and deposited TiO2 have only anatase modification.
Rutile phase was not observed. It is typically for TiO2 preparation
by TiOSO4 thermal hydrolysis [35]. The size of TiO2 crystallites
remains approximately constant in the s-TiO2 and 80-, 70-TC samples and is equal to about 6 nm. It indicates that TiO2 deposited on
the AC surface in the case of high TiO2 content is the same as s-TiO2
sample, and it should not be expected change of TiO2 itself spectral
characteristics.
14
D.S. Selishchev et al. / Journal of Photochemistry and Photobiology A: Chemistry 229 (2012) 11–19
Fig. 3. Flow-circulating setup: (1) – air purification system; (2)–(3) – mass flow controllers, (4) – saturator with distilled water, (5) – saturator with cyclohexane, (6) –
microdispenser, (7) – gas cell installed in an IR spectrometer.
Fig. 4. SEM photographs of activated carbon (A), s-TiO2 (B), 50-TC (C) and 80-TC (D) samples.
According to N2 isotherms analysis (Table 1) the s-TiO2 sample has large specific surface area SBET = 167 m2 /g and pore volume
V = 0.20 cm3 /g. The AC specific surface area is equal 825 m2 /g
whereas micropore surface area calculated by t-plot analysis is
equal 614 m2 /g. It means that AC structure mainly consists of micropores. Specific surface areas and pore volume of TC series samples
are a superposition of the TiO2 and AC individual characteristics
(Fig. 6).
In visible region ( > 400 nm) reflection intensity for TC series
is lower than for the pure s-TiO2 sample (Fig. 7). The reason of
such behavior is light absorption by AC particles, which are not
completely covered with TiO2 , because AC absorbs light both in visible and UV regions. Probably, it is one of the reasons of reducing
oxidation rates for these composite catalysts as it will be demonstrated later.
Results of the physical–chemical analyses indicate that there
does not occur considerable blocking of AC surface with supported
TiO2 particles and there is no difference between the pure synthesized TiO2 powder and TiO2 particles supported on the AC surface
because TC series properties are a sum of s-TiO2 and AC properties.
3.2. Photocatalytic oxidation experiments
3.2.1. Acetone vapor oxidation in the static reactor
In the beginning all synthesized samples were tested in the PCO
of acetone vapor in the static reactor to choose the most active
D.S. Selishchev et al. / Journal of Photochemistry and Photobiology A: Chemistry 229 (2012) 11–19
15
Fig. 5. XRD patterns of s-TiO2 , 80- and 70-TC samples.
Table 2
Reaction parameters of acetone vapor PCO in the static reactor.
Sample
s-TiO2
80-TC
70-TC
50-TC
30-TC
20-TC
C/C0 (%)a
60
68
71
77
78
80
WAc (ppm/min)
WCO2 (ppm/min)
3.8
3.0
2.9
1.2
1.1
0.9
28
22
23
10
9
6
a
Amount of acetone adsorbed on the sample after establishment of
adsorption–desorption equilibrium.
Fig. 6. Dependencies of specific surface area and pore volume on the TiO2 content
for TC series.
Fig. 7. Pure TiO2 and TiO2 /AC diffuse reflectance spectra.
samples. Only water, carbon dioxide and CO were detected as products of oxidation. Amount of formed CO was about 15–30 ppm and
was much lower than the final amount of evolved CO2 ∼ 1250 ppm
so we did not take it into account in mass-balance.
The experimental data of acetone vapor removal and CO2 accumulation during acetone photooxidation on the TC series and
s-TiO2 sample are presented in Fig. 8.
It could be seen that for s-TiO2 , 80- and 70-TC samples
CO2 concentration reached constant value after 60 min of irradiation (Fig. 8) and this value was slightly less than 100% of
acetone conversion level. The rest carbon was in forms of gaseous
CO and carbonates adsorbed on the catalyst surface. Samples
with 20, 30 and 50 wt.% TiO2 content demonstrated low oxidation rates therefore PCO reactions for these samples were not
completed.
Table 2 summarizes the initial rates of acetone removal (WAc )
and CO2 accumulation (WCO2 ) calculated by linear approximation of experimental data for the first 40 min of PCO reaction.
Amount of acetone adsorbed on the catalyst surface after establishment of the adsorption–desorption equilibrium ( C/C0 ) increased
with increasing AC content in the sample. At the same time the
rates of acetone removal (WAc ) and CO2 accumulation (WCO2 )
became less. In the other words the higher AC content corresponded to higher adsorption capacity and lower photocatalytic
activity.
Acetone is a polar substance, probably that is a reason of the
negative influence of AC content in composite photocatalyst on
the kinetics of acetone vapor removal. So the next experiments
were conducted with cyclohexane which adsorptivity on the AC
surface has to be higher than for acetone.
16
D.S. Selishchev et al. / Journal of Photochemistry and Photobiology A: Chemistry 229 (2012) 11–19
Fig. 8. Acetone vapor PCO in the static reactor with TC1 series photocatalysts and s-TiO2 .
3.2.2. Cyclohexane vapor oxidation
Cyclohexane vapor PCO on the composite TiO2 /AC photocatalysts was investigated in the static and flow reactors. The purpose
of experiments in the static reactor was to understand the influence of AC presence on the reaction kinetics whereas flow reactor
was used for measuring rate and adsorption constants.
3.2.2.1. Kinetics in the static reactor. Water, CO2 and CO were
detected as products of cyclohexane PCO. Final concentration of
evolved CO in the static reactor was about 60–80 ppm whereas
the final CO2 concentration was about 3500 ppm that is why CO
formation was neglected in mass-balance like in previous case.
Kinetic curves of C6 H12 removal and CO2 accumulation are
shown in Fig. 9 for s-TiO2 , 70-TC samples and for control experiment. The reason of control experiment was to understand
difference between supported TiO2 /AC and spaced TiO2 + AC cases.
This control experiment will be described in detail later.
Starting C6 H12 concentration had to be C0 = 603 ppm if to neglect
adsorption. In the case of s-TiO2 sample this starting concentration
was decreased by C = 39 ppm so that C/C0 ∼ 6.5% whereas in the
case of composite photocatalysts the initial concentration drop was
about C ∼ 210 ppm, C/C0 ∼ 35% (Table 3). It means that TiO2 has
lower adsorption capacity in relation to nonpolar substrate – cyclohexane. The composite TiO2 /AC catalysts demonstrated substrate
adsorption increased and its concentration in the gas phase was
lower during the initial time period of photocatalytic reaction for
70-TC sample than for s-TiO2 sample. However it should be noted
that that there exists a cross-point time ts ∼ 39.2 min when gaseous
cyclohexane concentration become higher for 70-TC than for s-TiO2
samples. In other words the PCO rate becomes lower with TiO2 /AC
photocatalyst.
Important characteristic of photocatalytic process is the time of
maximum contaminant level (MCL) establishment (tMCL ) in static
conditions. According to Russian sanitary regulations the cyclohexane MCL for working areas is 80 mg/m3 which corresponds to
24 ppm concentration. The prolongation of cyclohexane removal
kinetics for 70-TC photocatalysts and the increase of tMCL time from
55 to 60 min also indicate that 70-TC sample is less efficient.
Activated carbon filters are often used in combination with photocatalytic filters in commercial air cleaning devices to decrease
concentration of pollutants by adsorption. It was interesting to
compare this way of adsorbent usage with the case of deposited
TiO2 /AC photocatalyst. Therefore we carried out a control experiment, in which 4.8 mg of s-TiO2 and 2.2 mg of AC powders were
placed separately in the static reactor. TiO2 and AC were taken in
the same amounts as it was in the 7 mg of 70-TC sample.
Kinetics curves of cyclohexane removal and CO2 accumulation
during the control experiment are presented in Fig. 9 along with
the data for s-TiO2 and 70-TC samples. A significant decrease of
the initial substrate concentration was observed: C ∼ 296 ppm
C/C0 ∼ 49%. This value is even higher than for 70-TC sample
although BET analysis demonstrated that specific surface area of
70-TC is equal to the algebraic sum of AC and s-TiO2 surface areas
(Fig. 6). To our opinion the explanation is that N2 is a small molecule
and the entire surface of 70-TC sample is available for it whereas
cyclohexane molecule is bigger and a part of 70-TC sample surface
is inaccessible due to partial blocking of AC with TiO2 particles.
In control experiment cyclohexane concentration in gas phase
was lowest during the initial time period of the PCO and maximum contaminant level was reached rapidly – tMCL = 51.8 min
(Table 3). On the other hand there was also observed a cross-point
time t s = 57.6 min. After that time cyclohexane concentration in
the control experiment became higher than in the case of s-TiO2
sample and decreased very slowly. After 80 min of PCO for a long
time period a trace level of cyclohexane vapor (about 3–7 ppm)
was detected, whereas in case of s-TiO2 or 70-TC samples it was
removed from gas phase completely after 90 min of the PCO. It is
the first difference between composite TiO2 /AC photocatalyst and
simple combination of TiO2 and AC.
The second observed difference could be seen from kinetic
curves of CO2 formation. In the control experiment (Fig. 9) the initial
rate of CO2 formation (WCO2 ) was 57 ppm/min but after 30 min of
the PCO CO2 formation rate decreased rapidly. Even after 4 h of the
cyclohexane PCO carbon dioxide concentration in the static reactor
reached only 3070 ppm level which corresponded to 85% mineralization ratio. It indicates that even after 4 h part of cyclohexane was
remained adsorbed on the AC surface. In the case of 70-TC sample
expected CO2 level was almost achieved after 120 min of the PCO.
It is to be noted that total decrease of photocatalytic activity in
case of composite catalyst or the separate use of TiO2 and AC could
D.S. Selishchev et al. / Journal of Photochemistry and Photobiology A: Chemistry 229 (2012) 11–19
17
Fig. 9. Kinetics of C6 H12 PCO (unfilled markers) and CO2 accumulation (filled markers) in the static reactor for s-TiO2 , 70-TC samples and control experiment.
Table 3
Characteristics of cyclohexane PCO kinetic curves presented in Fig. 9.
C/C0 a (%)
Sample
s-TiO2
70-TC
Control experiment (4.8 mg s-TiO2 + 2.2 mg AC)
a
b
c
6.3
35.2
49
ts b (min)
tMCL c (min)
WCO2 d (ppm/min)
–
39.2
57.6
55.4
60.4
51.8
68
50
57 (for the first 30 min)
The amount of acetone adsorbed on the sample after establishment of adsorption–desorption equilibrium.
The cross-point time of cyclohexane kinetic curves for TiO2 and 70TC or TiO2 + AC photocatalysts.
The time of maximum contaminant level establishment; the MCL for cyclohexane is 24 ppm.d The initial rate of CO2 formation for the first 40 min of the PCO.
be explained by the decrease of effective gaseous substrate concentration due to its adsorption on AC surface. This phenomenon
has been previously studied by computer simulation of the PCO
using L.-H. model [17]. But why is there exists different behaviors
of 70-TC and separate TiO2 –AC systems? When TiO2 and AC are
used separately then substrate could transfer from adsorbent onto
the TiO2 surface only through gas phase and in the case of composite TiO2 /AC photocatalysts in addition there could occur a surface
migration of substrate and intermediates. For example, cyclohexanone, carbonyl and carboxyl compounds [36] were detected as
intermediates of the cyclohexane PCO. Thereby the separate use of
photocatalyst and adsorbent results in considerable prolongation
of substrate removal.
Experiments described above demonstrate that adsorption of
oxidizing substrate strongly influence the kinetics of PCO in static
conditions. Therefore to exclude this influence and determine the
activity of TC samples experiments were carried out in flow conditions.
Experimental data for 70-TC and 80-TC as well as for unmodified TiO2 were good approximated by the L.-H. equation. Resulting
approximation curves are shown in Fig. 10 by dashed lines. Values
of calculated effective rate and adsorption constants are presented
in Table 4.
According to presented data TiO2 /AC samples revealed lower
activity towards s-TiO2 during cyclohexane oxidation in flow
conditions if compare with experiments in the static reactor:
3.2.2.2. Kinetics in the flow reactor. Dependencies of cyclohexane
steady-state PCO rate on its concentration for s-TiO2 , 80-TC and
70-TC samples in the flow reactor are presented in Fig. 10. Rate of
CO2 formation was taken as the rate of the PCO. Effective rate and
adsorption constants were of interest in these steady-state experiments. L.-H. kinetic model was used to calculate them. This model
corresponds to the following rate equation:
WCO2 =
kr · Kads · C
,
1 + Kads · C
where (WCO2 ) is the rate of CO2 , (kr ) is effective rate constant, (Kads )
is effective adsorption constant, (C) is the steady-state concentration of cyclohexane.
Fig. 10. Dependencies of cyclohexane steady-state oxidation rate on its concentration in the flow reactor. Dashed lines correspond to the approximation of
experimental data by L.-H. equation.
18
D.S. Selishchev et al. / Journal of Photochemistry and Photobiology A: Chemistry 229 (2012) 11–19
Table 4
Results of cyclohexane kinetics approximation by L.-H. model.
Sample
Rate constant,
kr (mol/min)
Adsorption
constant, Kads
(l/mol)
Product
kr ·Kads
s-TiO2
80-TC
70-TC
0.115 (±0.003)
0.040 (±0.002)
0.040 (±0.001)
0.3 (±0.03)
0.6 (±0.2)
0.5 (±0.1)
0.035
0.024
0.020
kr = 0.040 mol/min for 70-TC and 80-TC and 0.115 mol/min for sTiO2 . On the other hand the increase of adsorption constant (Kads )
was observed for the 70-TC and 80-TC composite photocatalysts.
Probably during the formation of TiO2 on the AC surface by thermal hydrolysis additional adsorption sites with higher absorptivity
could form at TiO2 –AC interface.
Matos et al. [37] defined synergy factor (R) as:
R=
kapp (TiO2 +AC)
kapp (TiO2 )
Cyclohexane kinetic curves from Fig. 9 could be used for estimation of R-factor in the first-order assumption. Apparent rate
constant values for s-TiO2 , 70-TC and control experiment are equal
to 0.044, 0.040 and 0.048 min−1 respectively. The corresponding
R-factor values are:
R1 =
kapp (70−TC)
kapp (s−TiO2 )
= 0.91 and
R2 =
kapp (control exp.)
kapp (s−TiO2 )
= 1.2.
Although control experiment revealed that C6 H12 traces
remains for a very long time the calculated synergy effect was R2 > 1.
R-factor for composite sample (R1 ) was close to 1. However if we
will use L.-H. rate constant for product formation in steady sate
experiments as activity criteria of the samples then this value will
be lower: R1flow = (0.040/0.115) = 0.35 (Table 4). This short example supports the statement that correct R-factor has to be calculated
only from product formation kinetic curves.
In our work we have managed to increase adsorption constant
for composite TiO2 /AC system as compared with unmodified TiO2 .
To our opinion lower value of rate constants is explained by lesser
quanta quantity absorbed by AC particles incompletely covered
with TiO2 .
3.3. Suggestion about structure of photocatalytically active
TiO2 /AC catalysts with improved adsorption properties
Activated carbons still remain the most widely used adsorbents
for air and water purification since this material has unique morphological properties which provide its high adsorption capacity
against many types of organic molecule. But there exists certain
difficulties of its wide application as a support for TiO2 to prepare
composite photocatalysts [29]. The main drawback is the UV light
absorbance by AC particles. As it was demonstrated in the present
work, all positive effects of AC are diminished by decrease of the
oxidation rate due to lesser amount of light quanta absorbed by
supported TiO2 . To improve the situation we suggest to synthesize composite systems based on specially structured or granulated
activated carbon. External surface of such AC particles should be
entirely covered with porous TiO2 film. It is necessary for complete
UV light absorption just by supported TiO2 . Therefore its thickness
should be no less than 1 m or about 2–3 wave lengths of absorbing
light. If thickness of TiO2 film would be less that a part of incident
light will pass through this film and will be absorbed by AC. It is
also necessary that internal surface of AC (surface of mesopores
and micropores) would be unoccupied and unblocked by supported
TiO2 particles in order to enlarge adsorption of organic substrate
to be oxidized. Proposed model is schematically shown in Fig. 11.
In our opinion such structure of composite photocatalyst particles
Fig. 11. Model of TiO2 /AC composite photocatalyst with increased photocatalytic
and adsorption properties.
would be avoided of decreasing rates of photoreaction and would
be able to improve the adsorption properties of photocatalysts.
4. Conclusions
In the present work a synthesis of photocatalytically active composite TiO2 /AC catalysts with TiO2 in anatase form was carried out.
Photocatalytic activity was investigated in the PCO of acetone and
cyclohexane vapor in the static and flow reactors. Complete photocatalytic mineralization of both model pollutants was observed
without forming gaseous intermediates. Increase of adsorption
capacity was observed for TiO2 /AC catalysts. This effect was pronounced in the case of nonpolar substrate – cyclohexane.
The same amounts of TiO2 were used for PCO of equal portions
of cyclohexane in the static reactor but in the first case this TiO2
amount was deposited onto the AC and in the second case the
same AC quantity was placed separately. A synergistic effect was
observed and it was consisted in higher rate of CO2 formation in
the case of supported system whereas in the second case complete
mineralization of cyclohexane was not achieved even after 4 h of
the PCO. The most likely reason of such difference is the reversible
surface transfer of reagents and intermediates between TiO2 and
AC surfaces. Such surface transfer was eliminated when TiO2 and
AC were used separately.
Approximation of steady-state kinetic data with the L.-H. model
demonstrated that effective adsorption constants for TiO2 /AC photocatalysts became about 2 times higher than for pure TiO2 during
cyclohexane PCO.
To our opinion composite TiO2 /AC particles, which will demonstrate increase of both characteristics – adsorption capacity and
mineralization activity – should be constructed of AC granules with
available internal surface (micro- and mesopores) covered with
porous TiO2 layer. The thickness of this TiO2 layer should be no
less than 1–2 m to absorb UV light completely.
Acknowledgements
We gratefully acknowledge the support of the Federal Special
Program “Scientific and Educational Cadres of Innovative Russia”
D.S. Selishchev et al. / Journal of Photochemistry and Photobiology A: Chemistry 229 (2012) 11–19
(2009–2013 years) via contract P1360, SB RAS Integration projects
70 and 36, Presidium RAS grant 27.56 as well as the Ministry of
Education and Science of Russia via contract 16.513.11.3091.
One of the authors (D.S.) appreciates the grant program
“U.M.N.I.K.” of “The Fund of Assistance to Development Small Forms
of the Enterprises in Scientific and Technical Sphere”.
References
[1] D.R.U. Knappe, Chapter 9: Surface chemistry effects in activated carbon adsorption of industrial pollutants, in: G. Newcombe, D. Dixon (Eds.), Interface Science
and Technology, vol. 10, 2006, pp. 155–177.
[2] D.F. Ollis, H. Al-Ekabi (Eds.), Photocatalytic Purification and Treatment of Water
and Air, Elsevier, 1993.
[3] M. Kaneko, I. Okura (Eds.), Photocatalysis: Science and Technology, Springer,
2002.
[4] A.L. Linsebigler, G. Lu, J.T. Yates, Chem. Rev. 95 (1995) 735–758.
[5] O. Carp, C.L. Huisman, A. Reller, Prog. Solid State Chem. 32 (2004) 33–177.
[6] A. Fujishima, T.N. Rao, D.A. Tryk, J. Photochem. Photobiol. C 1 (2000) 1–21.
[7] H. Einaga, S. Futamura, T. Ibusuki, Appl. Catal. B 38 (2002) 215–225.
[8] P.A. Kolinko, D.V. Kozlov, A.V. Vorontsov, S.V. Preis, Catal. Today 122 (2007)
178–185.
[9] K.Y. Foo, B.H. Hameed, Adv. Colloid Interface Sci. 159 (2010) 130–143.
[10] M.D. Hernández-Alonso, I. Tejedor-Tejedor, J.M. Coronado, M.A. Anderson,
Appl. Catal. B 101 (2011) 283–293.
[11] D.V. Kozlov, A.V. Vorontsov, P.G. Smirniotis, E.N. Savinov, Appl. Catal. B 42
(2003) 77–87.
[12] H.-H. Ou, S.-L. Lo, J. Hazard. Mater. 146 (2007) 302–308.
[13] D.V. Kozlov, A.V. Vorontsov, J. Catal. 258 (2008) 87–94.
19
[14] W.-K. Jo, Ch.-H. Yang, Sep. Purif. Technol. 66 (2009) 438–442.
[15] F. Shiraishi, S. Yamaguchi, Y. Ohbuchi, Chem. Eng. Sci. 58 (2003) 929–934.
[16] J. Matos, J. Laine, J.-M. Herrmann, D. Uzcategui, J.L. Brito, Appl. Catal. B 70 (2007)
461–469.
[17] D.S. Selishchev, P.A. Kolinko, D.V. Kozlov, Appl. Catal. A 377 (2010) 140–149.
[18] P. Pucher, M. Benmami, R. Azouani, G. Krammer, K. Chhor, J.-F. Bocquet, A.V.
Kanaev, Appl. Catal. A 332 (2007) 297–303.
[19] B. Herbig, P. Löbmann, J. Photochem. Photobiol. A 163 (2004) 359–365.
[20] Q. Zhang, J. Liu, W. Wang, L. Jian, Catal. Commun. 7 (2006) 685–688.
[21] X. Zhang, M. Zhou, L. Lei, Appl. Catal. A 282 (2005) 285–293.
[22] T. Torimoto, S. Ito, S. Kuwabata, H. Yoneyama, Environ. Sci. Technol. 30 (1996)
1275–1281.
[23] N. Takeda, T. Torimoto, S. Sampath, S. Kuwabata, H. Yoneyama, J. Phys. Chem.
99 (1995) 9986–9991.
[24] T. Guo, Z. Bai, C. Wu, T. Zhu, Appl. Catal. B 79 (2008) 171–178.
[25] B. Tryba, A.W. Morawski, M. Inagaki, Appl. Catal. B 41 (2003) 427–433.
[26] S.X. Liu, X.Y. Chen, X. Chen, J. Hazard. Mater. 143 (2007) 257–263.
[27] X. Zhang, L. Lei, J. Hazard. Mater. 153 (2008) 827–833.
[28] G.L. Puma, A. Bono, D. Krishnaiah, J.G. Collin, J. Hazard. Mater. 157 (2008)
209–219.
[29] R. Leary, A. Westwood, Carbon 49 (2011) 741–772.
[30] R. Yuan, R. Guan, J. Zheng, Scr. Mater. 52 (2005) 1329–1334.
[31] H.P. Kuo, C.T. Wu, R.C. Hsu, Powder Technol. 195 (2009) 50–56.
[32] C.H. Ao, S.C. Lee, Chem. Eng. Sci. 60 (2005) 103–109.
[33] N. Bouazza, M.A. Lillo-Rodenas, A. Linares-Solano, Appl. Catal. B 84 (2008)
691–698.
[34] T. Torimoto, Y. Okawa, N. Takeda, H. Yoneyama, J. Photochem. Photobiol. A 103
(1997) 153–157.
[35] D.M. Bavykin, V.P. Dubovitskaya, A.V. Vorontsov, V.N. Parmon, Res. Chem.
Intermed. 33 (2007) 449–464.
[36] A.R. Almeida, J.A. Moulijn, G. Mul, J. Phys. Chem. C 115 (2011) 1330–1338.
[37] J. Matos, J. Laine, J.-M. Herrmann, Carbon 37 (1999) 1870–1872.