The effect of money growth on inflation in vietnam from 2004 to 2010
Bạn đang xem bản rút gọn của tài liệu. Xem và tải ngay bản đầy đủ của tài liệu tại đây (2.95 MB, 97 trang )
UNIVERSITY OF ECONOMICS
INSTITUTE OF SOCIAL STUDIES
HO CHI MINH CITY
THE HAGUE
THE NETHERLANDS
VIETNAM
VIETNAM- NETHERLANDS
PROGRAMME FOR M.A IN DEVELOPMENT ECONOMICS
THE EFFECTS OF
MONEY GROWTH ON INFLATION IN
VIETNAM FROM 2004 TO 2010
A thesis submitted in partial fulfilment of the requirements for the degree of
MASTER OF ARTS IN DEVELOPMENT ECONOMICS
By
BUI DINH PHUONG THAO
Academic Supervisor:
NGUYEN VAN NGAI
CONTENTS
CHAPTER 1: INTRODUCTION ...................................................................................... !
1.1 PROBLEM STATEMENT ............................................................................................. 1
1.2 RESEARCH OBJECTIVES AND QUESTIONS ......................................................... .3
1.3 METHODOLOGY ........................................................................................................... 3
1.4 STRUCTURE OF THESIS ............................................................................................. 4
CHAPTER 2: LITERATURE REVIEW .......................................................................... 6
2.1 THEORETICAL LITERATURE ................................................................................... 6
2.1.1 INFLATION ................................................................................................................ 6
2.1.2 SOURCES OF INFLATION ....................................................................................... 7
Keynesian View ......................................................................................................... 7
Demand-pull inflation ............................................................................................... . 11
Cost-push or structuralist inflation .......................................................................... . 13
Monetarists View ....................................................................................................... 15
2.1.3 MONEY GROWTH ..................................................................................................... 17
2.2 EMPIRICAL LITERATURE .......................................................................................... 21
2.3 AN OVERVIEW OF VIETNAM INFLATION AND MONEY GROWTH FROM
2000 TO 2010 ....................................................................................................................... 29
2.3.1 INFLATION ................................................................................................................ 29
2.3.2 MONEY GROWTH ..................................................................................................... 31
2.4 CHAPTER REMARK .................................................................................................... 32
CHAPTER 3: RESEARCH METHODOLOGY, MODEL SPECIFICATION
AND DATA SOURCES ...................................................................................................... 34
3.1 ANALYTICAL FRAMEWORK .................................................................................... 34
3.2 MODEL SPECIFICATION ........................................................................................... 35
3.3 DATA SOURCES ........................................................................................................... 42
3.4 ECONOMETRICS TECHNIQUES .............................................................................. .42
3.4.1 STATIONARITY AND UNIT-ROOT TEST ............................................................ .42
3.4.2 COINTEGRATION ..................................................................................................... 44
3.4.3 ERROR CORRECTION MODEL (ECM) ................................................................. .47
3.4.4 SHORT-RUN CAUSALITY TESTS ......................................................................... .49
Granger causality tests ................................................................................................ 49
Variance decomposition .............................................................................................. 51
Impulse response function ......................................................................................... 51
CHAPTER 4: THE EFFECTS OF MONEY GROWTH ON INFLATION IN
VIETNAM FROM 2004 TO 2010 ..................................................................................... 52
4.1 DESCRIPTIVE STATISTIC .......................................................................................... 51
4.2 ECONOMETRIC RESULTS ....................................................................... ,................. 54
4.2.1 UNIT ROOT TESTS .................................................................... ,............................... 54
4.2.2 BIVARIATE TESTS ............................... ,................................................................... 55
Engle-Granger cointegration tests .............................................................................. 55
Error correction model ................................................................................................ 56
4.2.3 MULTIVARIATE TESTS ........................................................................................... 51
Johansen cointegration tests ..... ,.................................................................................. 57
Vector error correction model (VECM), Granger causality tests, variance
decomposition and impulse response function ............................................................. 59
4.3 MODEL FORECASTS ................................................................................................... 66
4.4 RESULTS COMPARISON ............................................................................................ 66
4.5 CHAPTER REMARK .................................................................................................... 70
CHAPTER 5: CONCLUSIONS AND POLICY IMPLICATION ................................. 73
5.1 CONCLUSIONS ............................................................................................................. 73
5.2 POLICY IMPLICATION ............................................................................................... 74
5.3 LIMITATION ................................................................................................................. 76
REFERENCES
APPENDIX
LIST OF TABLES
Table 3.1: Variables Description, Expected Signs and Data Sources ................................... 36
Table 4.1: Description of Variables ...................................................................................... 52
Table 4.2: Correlation among Variables ............................................................................... 54
Table 4.3: Unit Root Tests Results ....................................................................................... 54
Table 4.4: Unit Root Tests for Residual ofCPI and M2 ....................................................... 55
Table 4.5: Error Correction Model ....................................................................................... 56
Table 4.6: Johansen's Cointegration Tests With 9 Lags ....................................................... 58
Table 4.7: Granger Causality Tests: P-Values For The lTests ........................................... 60
Table 4.8: Variance Decomposition ofCPI (Order Reflects Cholesky Ordering) ............... 62
Table 4.9: The Thesis' Results in Comparison with Empirical Studies' Results .................. 67
•
LIST OF FIGURES
Figure 2.1: The Long-Run Macroeconomic Equilibrium .................................................... 9
Figure 2.2: Recessionary and Inflationary Gap .................................................................... 10
Figure 2.3: Government Intervention When Recessionary Gap Occurs ............................... 10
Figure 2.4: An Increase In Aggregate Demand .................................................................... 12
Figure 2.5: Demand-pull Inflation Spiral .............................................................................. 13
Figure 2.6: An Increase in Short-run Aggregate Supply ...................................................... 14
Figure 2.7: A Cost-push Inflation Spiral ............................................................................... 14
Figure 2.8: CPI in December and Average CPI from 2001 to 2010 ..................................... 31
Figure 2.9: Broad Money Growth From 2002 To 2010 ........................................................ 32
Figure 3.1: Analytical Framework ........................................................................................ .34
Figure 4.1: Impulse Response Functions ............................................................................. 65
CHAPTER 1: INTRODUCTION
This chapter will explain the importance of this thesis, its objectives and research
questions. In addition, a brief of methodology is also mentioned in this part. Finally, the
structure of thesis will be presented.
l.lPROBLEM STATEMENT
Money plays important role to the economy. Greco (200 1) suggested money has five
functions which are "a medium of exchange, a standard of value, a unit of account, a
store of value and a standard of deferred payment". As a medium of exchange, money
helps to divide the goods exchange process into two separate parts which are purchase
process and sales process. Therefore, people can buy goods at different places and sell
goods in different time; hence money promotes trading activities. Furthermore, money is
used as standard to measure and present value of goods as well as prices of goods. It
extremely supports business to quote and record costs, products' prices and calculates
value of gross domestic products (GDP), gross national products. In addition, money is
preferred to keep for future consumption and prevent risks. As a standard of deferred
payment, money makes payment become easier, more flexible and time-saving. It
increases the liquidity of debts, thus supports businesses and economic growth.
Based on its importance to the economy, money growth can affect the economy in many
channels. People receiving more money are willing to consume more, thus it stimulates
consumption and encourages imports. More money means more capital to make
investment in order to expand companies' business. Besides, growth in money supply
will sponsor government's expenditure and decrease governmental budget deficit.
•
Consequently, an increase in money stock may lead to growth in aggregate demand and
positively affect the economy. On the other hand, high growth in money may reduce its
value and cause an increase in price level. Monetarists suggested that money is the main
determinant of inflation while Keynesian views argued money which leads aggregate
•
demand to exceed aggregate supply is only one of determinants of inflation. However,
Mishkin (1995) concluded that both monetarists and Keynesians believed that high
inflation only possibly occurs with high money growth rate.
There are also a majority of empirical studies examining the effects of money growth on
inflation. Several studies suggested that money supply significantly positively influences
inflation such as Moroney (2002), De Grauwe and Poland (2005), Thornton (2008),
Kaufmann and Kugler (2008), Gingting and Bird (2009) and Basco, et al (2009). In
contrast, some papers, for example Fie (2003), argued that the effects of money growth
on inflation is insignificant. In case of Vietnam, there are different findings regarding the
dependence of inflation on money supply. According to Baker, et al (2006), Goujon
(2006) and Thanh (2008), money positively impacts price level. On the other hand, a
research of Hung and D. Pfau (2008) pointed out this effect is unobvious.
In addition, according to the Vietnam's Prime Minister Nguyen Tan Dung (2011), the
primary goals of the government at present are to stabilize macroeconomic and to control
inflation at an appropriate level. If money growth does affect inflation in Vietnam,
monetary policy becomes a powerful policy for the government to maintain inflation at
its target level. However, there is few studies examined and quantified the effects of
money growth on inflation in Vietnam in order to define the level of increases in money
supply to meet the target inflation. Therefore, this thesis aims to not only examine the
influence of money growth on inflation but also estimate the level of money growth to
achieve the expected inflation of the Vietnamese government in 2011.
2
1.2 RESEARCH OBJECTIVES AND QUESTIONS
Analyzing the impact of money supply on inflation is extremely important for the
•
government to conduct an appropriate monetary policy. Therefore, this thesis aims to
examine the effects of money growth on price level in long-run and short-run in Vietnam.
In order to meet this overall goal, the research will obtain following objectives:
(i)
Analyze the effects of money growth on inflation in Vietnam in long-run.
(ii) Analyze the effects of money growth on inflation in Vietnam in short-run.
(iii) Advise the level of money growth to meet the target inflation of the Vietnamese
government in 20 11.
The research questions are proposed:
(i)
Does money affect inflation in Vietnam in long-run?
(ii) Does money affect inflation in Vietnam in short-run?
(iii) Which level of money growth does meet the target inflation m 2011 of
Vietnam's government?
1.3METHODOLOGY
In order to examine the dependence of inflation on money growth in Vietnam in long-run
and short-run, monthly data from December 2003 to June 2010 are collected from
International Monetary Fund and Vietnam General Statistics Office. The research will
employ descriptive statistics and econometric techniques.
Descriptive analysis will firstly give a summary of all variables to provide an overview of
data collection such as their distribution, central tendency and variation. Then the
correlation matrix will suggest the potential relationship between each pair of variables.
3
In addition, the unit root tests are used to test for stationary of all variables to ensure the
validation oft-tests and F-tests. After that, four econometric techniques will be applied in
this thesis in order to examine the long-run and short-run effects of money growth on
inflation.
Firstly, to investigate the long-run influence of money growth on inflation to answer the
first research question, the Enge-Granger cointegration test and error correction
mechanism (ECM) are employed.
Secondly, the thesis will add other determinants of inflation into a model with money
growth then apply the Johansen co integration tests to re-test the effects of money growth
on inflation in long-run and confirm the number of co integration equations.
After that, in order to answer the second research question, vector error correction model
(VECM), Granger causality tests, variance decomposition and impulse response
functions are used to examine the short-run impact of money on inflation.
Finally, a level of money growth is forecasted by applying VECM to meet the target
inflation level of the Vietnamese government in 2011 to answer the third research
question.
1.4 STRUCTURE OF THESIS
The thesis consists of five chapters.
Chapter 1 presents the important of the thesis' findings and its objectives. It also briefly
presents the methodology is applied in the thesis.
4
Chapter 2 demonstrates the literature review. It starts with definitions of money growth
and inflation. Then the chapter focuses on Keynesian views and the quantity theory of
money. After that, empirical studies regarding the effects of money growth on inflation
are introduced. An overview of inflation rate and growth in money supply in Vietnam
from 2000 to 2010 is also presented in this chapter.
Chapter 3 is based on theories and empirical research to present an analytical framework
then develop a model explaining inflation in short-run in Vietnam. This chapter will
mention data sources as well as economic techniques used in the thesis.
Chapter 4 presents results of hypotheses testing and suggests the level of money growth
to achieve the target inflation ofVietnamese government in 2011.
Chapter 5 will give the conclusion, policy implications and suggest for further studies.
5
CHAPTER 2: LITERATURE REVIEW
This chapter will briefly describe the definitions of inflation and money supply. In
addition, theories which are applied in this thesis are introduced. After that, the thesis will
present empirical studies' results regarding the effects of money growth on inflation in
other countries and in Vietnam. Finally, a summary of inflation growth and money
growth in Vietnam from 2000 to 2010 is given to have an overview about inflation and
money supply in Vietnam in this period of time.
2.1 THEORETICAL LITERATURE
2.1.1 INFLATION
Inflation is a term to indicate the continuous growth in price level over a period of time.
In the words of Ackley (1978) "inflation may be defined as a persistent and appreciable
rise in general level of average of price". Mankiw (2002) defined inflation is as "an
abnormal increase in the quantity of purchasing power". According to Pi ana (200 1), there
are four types:
(i)
Hyperinflation occurs when yearly price level mcreases of three-digits
percentage points and an explosive acceleration.
(ii) Extremely high inflation occurs when inflation rate is between 50% and 100%.
High inflation is a situation when the price level increases of 30% to 50% per
year. These kinds of inflation can stable or dangerously enter in an
hyperinflation condition.
(iii) Moderate inflation can be differently defined around the world, given the
different inflation histories. As an indication only, inflation can be considered at
moderate rate when it ranges from 5% to 25-30%.
(iv) Low inflation can be defined from 1-2% to 5%. Around zero there is no inflation
(price stability) and a country will face deflation when price level is below zero.
6
2.1.2 SOURCES OF INFLATION
Causes of inflation raise many macroeconomic debates. This thesis only mentions
theories which are related to the topic are Keynesian view and the quantity theory of
money.
Keynesian View
Implied from Keynesian view, economists believed that there are two main groups of
inflation which are demand-pull or excess-demand inflation and cost-push or structuralist
inflation. Inflation occurred due to the fluctuations of aggregate demand (AD) and
aggregate supply (AS). Therefore, in order to deeply understand two kinds of inflation, it
is necessary to remind the concepts of AD and AS.
AD is the quantity of real GDP demanded or the total amount of final goods and services
produced in a country that people (C), business (I), government (G) and foreigners (NX)
plan to buy. Another definition is AD is the sum of consumption expenditures (C),
investment (1), government expenditure (G) and net exports (NX). That is
AD=C+I+G+NX
AD curve presents the relationship between the quantity of real GDP demanded and the
price level. The curve is downward sloping due to wealth effect and substitution effect.
Wealth effect informs that changes in price level with other things remain the same will
lead to changes in real wealth. Thus, people will try to restore their wealth by increasing
saving and decreasing consumption. Substitution effect said that people will substitute
future consumption for present consumption as a result of higher interest rate. In addition,
changes in prices leads consumers to spend less on domestic items and more on imported
items. A change in price level can cause a movement along the AD curve whereas
changes in consumption or investment as well as government expenditure or net exports
may lead AD to shift leftward or rightward.
7
AS or aggregate production function is the aggregate quantity of goods and services
supplied. It presents how quantity of real GDP supplied (Y) depends on the quantity of
labor (L ), the quantity of capital (K) and the state of technology (T). That is
AS
=
f(L, K, T)
At any given time, K and T are fixed, thus the higher the real wage rate is, the smaller the
quantity of labor demanded is and the greater the quantity of labor supplied is.
AS is divided into two time frames which are the short-run AS (SRAS) and the long-run
AS (LRAS) associated with the different state of labor market. The macroeconomic
short-run is a period which real GDP is smaller or greater than potential GDP. The
unemployment rate at that time has fallen below or risen above the natural employment
rate. SRAS curve demonstrates the relationship between the quantity of real GDP
supplied and the price level in short-run when the money wage rate, other resources
prices and potential GDP are constant. The price level increases, holding the money wage
rate and other resources prices constant, the quantity of real GDP increases and there is a
movement along the SRAS curve.
On the other hand, the macroeconomic long-run is a time frame that is sufficient long for
all adjustment to be made; thus real GDP is equal to potential GDP and there is full
employment. As a result, LRAS curve shows the relationship between the quantity of real
GDP supplied and the price level when real GDP equals potential GDP. This curve is
vertical as potential GDP is independent of the price level. A change in the price level
with an equal percentage change in the money wage and other resources prices, results in
a movement along the LRAS curve. Changes in both the SRAS curve and the LRAS
curve may cause by changes in potential GDP which depend on changes in the fullemployment quantity of labor, changes in the quantity of capital or technological advance.
Besides, changes in money wage rate and other input prices only result in changes in the
SRAS curve, not affect the LRAS curve.
8
The short-run macroeconomic equilibrium occurs when the quantity of real GDP
demanded equals the quantity of real GDP supplied at the point of intersection of the AD
curve and the SRAS curve while the long-run macroeconomic equilibrium happens when
real GDP equals potential GDP (Y*)
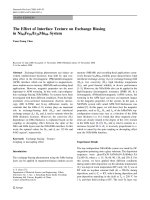
Figure 2.1: The Long-Run Macroeconomic Equilibrium
LRAS
Price level
p
/
Y*
Real GDP
In case the macroeconomic equilibrium is below full-employment equilibrium or the
potential GDP exceeds real GDP, the difference is named a recessionary gap. On the
other hand, it is called an inflationary gap.
9
Figure 2.2: Recessionary and Inflationary Gap
LRAS
SRAS
Price level
Price level
./
/
LRAS
'\
'\.
SRAS
/
I
Y*
Real GDP
Real GDP
Recessionary gap
Inflationary gap
According to Keynesian view, fiscal policy and monetary policy will offset changes in
aggregate demand and cause recessionary· gap. The economy will return its fullemployment equilibrium if governmental policies stimulus AD but at higher price level.
This view bases on assumptions that expectations are the most significant influence on
AD and the money wage rate behind short-run aggregate supply does not fall.
Figure 2.3: Government Intervention When Recessionary Gap Occurs
LRAS
Price level
~
SRAS
P2
Pl
AD2
Y*
Real GDP
Recessionary gap
10
Based on effects of changes in AD and AS on price level, Keynesian economists suggest
two kinds of inflation which are demand-pull inflation and cost-push inflation argued
below:
Demand-pull Inflation
This kind of inflation occurs when aggregate demand (AD) exceeds aggregate supply
(AS). McTaggart, et al (2007) advised three main influences on aggregate demand which
are the world economy, fiscal policy and monetary policy and expectations. The world
economy impacts AD through foreign exchange rate and foreign income. An appreciation
in foreign exchange rate will lower the prices of domestic goods and services relating
foreign goods and services; hence it increases exports, reduces import and rises AD. In
addition, growth in foreign income may lead the demand for home country's exports to
go up and increase AD. Furthermore, changes in fiscal policy, for example a tax cut, will
increase the households disposal income, encourage consumption and raise AD. A
loosening monetary policy which increases the quantity of money and reduces the interest
rate may support investment, stimulate consumption and exports. As a result, AD may go
up. Finally, expectations about future income, future inflation and future profits can
influence AD as increases in expected future income will increase present consumption
and rise AD. In case people predict higher inflation rate in the future, they will buy
cheaper goods at present, resulting in higher consumption expenditure. Consequently,
AD goes up. Firms also increase investment at present time if they believe their future
profits will increase; hence AD rises.
Keynesian argued that an increase in aggregate demand when real GDP equals potential
GDP will lead both GDP and price level initially increase. At that time, AD curve shifts
from ADl to AD2, output grows from Y* to Yl and price level rises from Pl to P2. On
the other hand, demand growth may force firms to increase production and employ more
labor to meet the high demand. The unemployment rate is below the natural
11
unemployment rate and leads a shortage of labor and wages to begin to go up.
Consequently, the SRAS curve will shift leftward from SRASl to SRAS2. The price
level will rise from P2 to P3 then real GDP begins to decrease to return to the fullemployment. This is a one-time rise in the price level.
Figure 2.4: An Increase In Aggregate Demand
LR.A.S
Price
SR.A.S2
h~Yel
SRASl
P3
P2
Pl
·····-
\~
AD2
~AD!
RealGDP
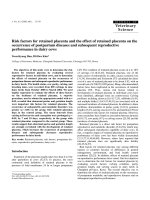
However, in case the government intervenes to the market, for example increases in the
quantity of money, the AD curve will continuously shift rightward to AD3 and the price
level rises to P4. Yet again, the money wage rate increases and the SRAS curve shift
leftward to SRAS3. The price level will rise further to PS. The continuous increases in
aggregate demand and price level are named demand-pull inflation spiral.
12
•
Figure 2.5: Demand-pull Inflation Spiral
LRAS
Price
le•:el
SRAS3
SR..<\ 52
P5
SR.AS1
P-+
P3
P2
Pl
"
" ' AD3
"'- AD2
ADl
Y"'
RealGDP
Cost-push or Structuralist Inflation
Cost-push inflation is a result of increases in costs of production caused by rises in
inputs' prices, money wage rate or supply shocks. An increase in prices of inputs will
lead production costs to rise. Therefore, firms have to cut down production and reduce
the quantity of labor employed. The SRAS curve will shift leftward to SRAS2 resulting
in a fall in output and an increase in price level from P 1 to P2. A decrease in real GDP
causes the unemployment rate to rise above the natural unemployment rate.
Keynes ( 1940) suggested that the government should intervene the market by using fiscal
policy or monetary policy to stimulus aggregate demand in order to restore the full
employment. In case the central bank rises the money supply, the aggregate demand will
shift rightward to AD2. Consequently, the economy is returned to the full employment
but price level rise further to P3.
13
Figure 2.6: An Increase in Short-run Aggregate Supply
LRAS
Price
SRAS2
level
SR.-\S1
P3
P2
Pl
-
~
"', AD2
AD1
RealGDP
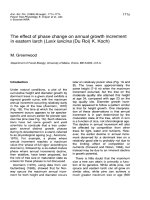
However, when price level increases, the relative revenue of input' suppliers may rise
modestly. Thus, they probably continuously increase input' price to restore its new high
relative price. As a result, the SRAS curve constantly shifts leftward to SRS3 and the
price level goes up to P4. The real GDP falls again while the unemployment rate is above
its natural rate. If the central bank responds yet again with another increase in money
supply, the AD curve will shift rightward to AD3. Consequently, the price level goes up
to higher level and the full employment is restored. A cost-push inflation spiral occurs.
Figure 2.7: A Cost-push Inflation Spiral
LR.A.S
Price
level
SRA.S3
SRAS2
P5
p~
P3
P2
Pl
/ SR.ASl
~AD3
Real GDP
14
Besides, structuralisms suggest the exchange rate is one of main sources of inflation.
Insufficient foreign reserve or depreciation in exchange rate will accelerate prices of
imported goods, thus costs of production grows and consumer prices go up. The fall in
value of domestic currency can also lead to reduction in real wage. Employees will
require higher salary; hence it contributes to increase production costs and consumer
prices. The consecutive depreciation in exchange rate may result in continuous increases
in consumer prices. As a result, inflation rises.
Post Keynesians, in addition, pointed out the importance of global prices to domestic
inflation. A surge in prices of energy, raw materials or other inputs used in production
will raise domestic production costs and significantly affect products' prices. Higher
prices of goods and services will rise consumer prices. These effects are especially
serious in small opened economies which depend much on importing inputs, energy and
equipments. In case the world prices of energy or inputs increase constantly, domestic
consumer prices will go up continuously; thus inflation will rise.
Monetarists View
On the other hand, monetarists believed that money growth is taken into account as the
main determinant of inflation and they argued against the concept of cost-push inflation.
Their argument is that this kind of inflation can not occur without the interventions of
government in increasing money supply when production costs rise. If the quantity of
money is constant, increases in cost of production of a product or service will reduce the
money available for other goods and services. Therefore, the price of some those goods
may decrease and overcome growth in price of those goods whose prices have increased.
According to Friedman (1956), inflation is always a monetary phenomenon. He
mentioned the quantity theory of money expressed by equation of exchange of Fisher
15
( 1911) to explain for his definition of inflation. The equation of exchange is presented
following
M.Vr =PrT
Where
PT is the price level associated with transactions for the economy during the period
Tis an index of the real value of aggregate transactions.
However, it is extremely difficult to estimate the above equation due to insufficient data
of transactions. Therefore, an alternative equation which is more familiar is suggested
MV=P.Q
where
Vis the velocity of money in final expenditures.
Q is an index of the real value of final expenditures or real output.
The equation of exchange can be changed to the below version
P=M.V
Q
If V and Q are constant, then:
dP
p
dM
-=-
M
and thus
dPIP
dt
dMIM
dt
--=---
Where t is time.
Therefore, if
Vand Q are constant, then the inflation rate ( d~ P) will equal the growth
rate of the money supply ( dM~ M). It means that the inflation rate is a function of the
monetary growth rate.
16
•
With time-varying V and Q, the unrestricted equation is
dP I P
dt
dM I M dV IV dQ I Q
---+--dt
dt
dt
which says that the inflation rate equals the monetary growth rate plus the growth rate of
the velocity of money minus the growth rate of real expenditure. If in the long run, the
monetary growth rate is controlled by the central bank; the growth rate of velocity is
purely determined by the evolution of payments mechanisms and the growth rate of real
output is determined by the rate of technological progress plus the rate of labor force
growth, an x percentage point rise in the monetary growth rate will result in an x
percentage point rise in the inflation rate.
However, according to Mishkin ( 1995), both monetarists and Keynesians believed that
high inflation may only occur with repeatedly increases in aggregate demand caused by
persistently increases in the quantity of money. In order to promote sustainable economy
growth with low inflation, both monetary policy and fiscal policy should be applied.
However, recent economists prefer monetary policy than fiscal policy due to the long
time lag of the latter and the thread of government budget deficit.
2.1.3 MONEY GROWTH
Money supply or money stock is defined as the total amount of money available in an
economy at a particular point of time. According the Federal Reserve Department (FED),
the money stock consists of currency held by the public; transaction, savings, and time
deposits held by the public at depository institutions; the assets of money market mutual
funds; and certain other depository institution liabilities. Money supply data are
frequently recorded and updated by the government or central bank of the country.
As there are different types of deposits at banks and other financial institutions, there are
several different official measures of money. The types of money stock are classified as
17
i. • r:·.
'
'
('-r
"M"s and ranged from the narrowest MO to the broadest M3. Definition of "M"s depends
on the central bank of each country or region. According to Bernanke (2006), in the
United States, FED defined money aggregate as Ml, M2 and M3. Ml is currency and
demand deposits at commercial banks. M2 equals M 1 plus commercial bank savings and
small time deposits, deposits at mutual savings banks, savings and loans, and credit
unions. M3 is equal to M2 plus large time deposits.
On the other hand, European Central Bank defined Ml is currency, such as banknotes
and coins, as well as balances which can be immediately converted into currency or used
for cashless payments, i.e. overnight deposits. M2 which is the intermediate money
equals Ml plus deposits with a maturity of up to two years and deposits redeemable at a
period of notice of up to three months. M3 comprises M2, money market fund
shares/units, repurchase agreements and debt securities up to two years.
McTarggart (2007) suggested that there are three measures of money stock in Australia.
Ml consists of currency held by households and firms plus current deposits at banks and
excludes currency held by banks and governments. M3 equals Ml plus all other deposits
at banks, including term deposits and certificates of deposits. Broad money is defined as
M3 plus deposits at financial institutions other than banks.
The role of money stock in explaining inflation and economic growth is demonstrated in
the quantity theory of money. The theory emphasizes the following relationship of the
nominal value of expenditures PQ and the price level P to the quantity of money M:
+
(2.1)
PQ=f(M)
+
(2.2)
P=g(M)
The plus signs indicate that a change in the money supply is believed to change nominal
expenditures and the price level in the same direction, given other variables are constant.
18
Friedman ( 1987) suggested that empirical studies have found relations consistent with
above models and with the role of money to prices. A change in the money supply in the
past will be relatively more associated with a change in real output Q than the price level
P in (2.1) but with much variation in the precision, timing, and size of the relation in the
short-run. For the long-run, there has been stronger support for (2.1) and (2.2) and no
systematic association of Q and M.
With important roles to the economy, growth in money supply is one of the most
concerned of governments. Growth in money supply can be affected by central banks
through monetary policy. The term monetary policy refers to the actions undertaken by a
central bank to influence the availability and cost of money and credit as a means of
helping to promote national economic goals. There are many types of monetary policy
such as inflation targeting, monetary aggregate, fixed exchange rate and mixed policy
depending on the economic objectives of each nation. Central banks will change money
supply; thus they influence the economy through several channels named monetary
transmission mechanisms. Central banks usually approach five main channels which are
reserve requirements, discount window lending, open market operation, interest rate, and
exchange rate in order to intervene economies.
Firstly, reserve requirements are the amount of funds that a depository institution must
hold in reserve against specified deposit liabilities. Banks are frequently required to keep
a small proportion of their assets as cash available for immediate demand of withdrawal.
The rest assets will be invested or given loans. Therefore, high reserve requirement rate
will reduce available funds, hence loanable capability of banks goes down and vice versa.
By changing reserve requirement, the central banks will directly affect the availability of
loanable funds of banks and cause changes in money supply. Reserve requirement is a
powerful tool when a modest change in its rate will comprehensively equally influence
banking system. However, its strengthen is also its weakness as this tool can not be
19
applied in case central banks only want to change money stock moderately. In addition,
frequent increases in reserve requirement rates will reduce banks' profits as well as lead
the economy to imbalance and affect banks' liquidity. Consequently, central banks
usually do not prefer this channel.
Secondly, discount window lending is where the commercial banks, and other depository
institutions are able to borrow money from the central bank, usually on a short-term basis,
to meet temporary shortages of liquidity. The interest rate charged on such loans by a
central bank is called the discount rate, base rate, or repo rate. At that time, central banks
become the last lenders of the economy through intermediate institutions such as banks
and depository institutions. It provides money or loanable funds to the economy, thereby
affects the money supply. However, with this instrument, central banks may depend on
the demand of funds of depository institutions.
Thirdly, open market operations is an important tool to impact the quantity of money.
Central banks will buy or sell short-term valuable documents, for example treasury bills,
to banks and financial institutions. Selling valuable documents at attractive rates will
encourage banks to buy them, thus reduces banks' available funds for giving loans.
Consequently, money stock provided to the economy will go down. This tool can offset
disadvantages of the previous tool as central banks may actively use it without depending
on banks. It also can be applied flexibly, preciously at any level following central banks'
management.
Fourthly, interest rate is a powerful instrument for central banks to intervene markets.
Lower interest rate will encourage consumption and investment as well as lending. As a
result, the quantity of money increases. There are two main methods controlling interest
rate which are indirect and direct methods. Central banks indirectly control interest rate
by announcing base rate to instruct markets or adjusting discount rate or refinancing rate.
20