The impacts of education on earnings in the case of vietnam luận văn thạc sĩ
Bạn đang xem bản rút gọn của tài liệu. Xem và tải ngay bản đầy đủ của tài liệu tại đây (2.16 MB, 65 trang )
UNIVERSITY OF ECONOMICS
INSTITUTE OF SOCIAL STUDIES
HO CHI MINH CITY
THE HAGUE
VIETNAM
THE NETHERLANDS
VIETNAM - THE NETHERLANDS
PROJECT FOR M.A IN DEVELOPMENT ECONOMICS
THE IMPACTS OF EDUCATION ON EARNINGS
IN THE CASE OF VIETNAM
BY
NGUYEN XUAN CUONG
MASTER OF ARTS IN DEVELOPMENT ECONOMICS
HO CHI MINH CITY, NOVEMBER 2008
CHAPTER I: INTRODUCTION
1.1 Introduction ... ..... .. ... .... .. ... .. ......... .. .. ... .... ..... ........ ..... .. .. .. .. ....... .. ....... .... .............. ...... . 3
1.2 Problem statements .................................................................................................... 4
1.3 Research objectives .................................................................................................. 4
1.4 Research questions .. ....... .. ...... ..... ...... .... .. .. .... .. ..... ... ... . ...... .. ... .. .. .. ... .. ... .. ... ...... .. .. .. .. . 5
1.5 Research hypothesis ................................................................................................. 5
1.6 Data and methodology............................................................................................... 5
1. 7 Thesis structure ... ... ... ..... .. .... ... ... .. .. .. ... .. .. .. .... ... .. ..... ... ..... .. .... ... .. ..... .. .. ...... ... .. .. ... .. .. .. 5
CHAPTER II: LITERATURE REVIEW
2.1 Definition .................................................................................................................. 6
2.2 Theoretical framework .............................................................................................. 6
2.2.1 Mincer's Early Work on experience, 1958 ........................................................... 7
2.2.2 The Schooling- Earning Function ........................................................................ 8
2.2.3 Theory of human capital ........................................................................................ 10
2. 3. Empirical studies .................................................................................................... 12
2.4 Comments on the theories and empirical studies ..................................................... 15
2.5 Modeling ................................................................................................................... 16
CHAPTER III: ECONOMIC, EDUCATION AND LABOUR MARKET
IN VIETNAM
3.1 Economic in Transition ............................................................................................ 17
3.2 Population and labor force ........................................................................................ 18
3.3 Education achievements ........................................................................................... 21
3.4 Education expenditure ............................................................................................... 21
3.5 Employment and income .......................................................................................... 22
3.5.1 Employment .......................................................................................................... 22
3.5.2 Incotne ................................................................................................................... 23
3.6 Factors affect on earnings .......................................................................................... 25
3.6.1 Education ................................................................................................................. 26
3.6.2 Experience .............................................................................................................. 26
3 .6.3 Gender ... .. .. .. ..... .. ...... ........ .. ....... .. .. .. ..... .. ............. .. .. .. .. .. ..... .. ..... .. ........ .... ... .... .. ...... 28
3.6 .4 Region .................................................................................................................... 28
3.6 .5 Economic sectors ................................................................................................... 28
CHAPTER IV: DATA AND METHODOLOGY
4.1 Statistic analysis
..................................................................................................... 29
4.2 Regression model of earning function ...................................................................... 32
4.3 Regression results ..................................................................................................... 35
4.4 Estimate coefficients. ............................................................................................... 35
4.4.1 Gender disparity in returns to education ................................................................ 40
4.4.2 Economic sector disparity in returns to education ................................................ 42
4.4.3 Regional disparity in returns to education ............................................................. 44
CHAPTER V: POLICY IMPLICATIONS AND CONCLUSIONS
5.1 Conclusions .............................................................................................................. 46
5.2 Recommendations .................................................................................................... 47
5.2.1 Recommendations for employees .......................................................................... 47
5.2.2 Recommendations for policy makers .................................................................... 48
5.3 Limitations and areas for further research ................................................................ 48
LIST OFT ABLES
Table 1: Vietnamese's population ................................................................................ 19
Table 2: Literacy of population age 15 and over by area, region have certificate .....
20
Table 3: School enrollment trend in Vietnam 2000 - 2004 ............................................ 21
Table 4: The proportion education expenditure in GOP 2000- 2005 ........................... 22
Table 5: Education expenditure of Vietnam comparing with other countries ................ 22
Table 6: Monthly average income per employee in local state sector at
Current prices by region (thousand VND) ...................................................... 25
Table 7: Descriptive statistic ......................................................................................... 32
Table 8: Average earnings by education Level by Region and Sex ............................... 32
Table 9: Description variables used in the model .......................................................... 34
Table 10: Vietnam Earning function ............................
Table 11: Vietnam Extended earning function ..........
oo . . . . . . oo . . . . . . . . oo . . ooooOOOOooooOOOOooooooOOOOoo
ooooooooooooooooooooooooooooooooooooooooooooooooooo
38
38
Table 12: Vietnam: Earnings functions by Gender ......................................................... 41
Table 13: Vietnam: Extended Earnings functions by Gender ....
00 . . . . . . . . . . 00 00 00 00 . . 00 . . . . . . . . . . . .
42
Table 14: Vietnam: Earnings functions by sector of employment (both sexes) ............. 43
Table 15: Vietnam extended earning function by economic sector ................................ 43
Table 16: Vietnam: Earnings function by Region ............
oo . . . . oo . . . . . . . . ooooOooooooooooooooooooooooooo
Table 17: Vietnam: Extended earnings function by Region ....................
00 . . . . . . . . . . . . . . . . . . . .
45
45
The impacts of education on earnings
In the case of Vietnam
ABSTRACT
The labor market, earnings and the return to education have been strongly impacted after
Vietnam transiting into the market economy from planned economy especial since the Doi
Moi policy was carried out. To exam the impacts, in this paper we attempt to analyze the
returns to education on earnings in 2004 by analyzing the monetary benefits of schooling in
Vietnam. Our estimates demonstrate that there is increasing returns of earning on schooling
which consistent with human capital theory and our observation to Vietnam labor market.
2
------·--------
CHAPTER I: INTRODUCTION
1.1
INTRODUCTION
The human capital theory views earnings of a \vorkcr as returns to his or her
knowledge capital that have developed through years of schooling and work
experience. Early works of Becker and Chis,vick (Becker and Chiswick. 1966) laid
the foundation of this literature and later Mincer (Mincer. 1974) proposed an
empirical approach to distinguish the contribution of schooling and experience in
wage earnings. The well-known model of Mincer is "Human capital earnings
function; include the log of individual earnings as the explained variables. and
schooling and experience are as explanatory variables. Recent studies of education
and earning were almost embedded in the framework of Mincer and combined with
different contexts with additional important of the household and community
characteristics.. institutional
f~tctors..
and other observable attributes such as gender.
~
economic sectors. regions. Card (Card. 1999) survey the literature on the causal
relationship between education and earning.
This Paper focuses on Vietnam. Since Vietnam has successful in economic reform
when the economy was transfen-cd from centrally planned to market economy in
1996, the economic transition has led to certain issues in the labor market, education
was dctennined important in earnings, the higher the level of education one get, the
higher is that person receives starting salary and the steeper the rise in earning during
working life. In centrally planned economics this relation was limited, in Lao
people's democratic Republic (Phanhpakit and Education and Earnings in Lao PDR
2006) or in China (Xie and Human. 1996) but they ten to increase as market
economy such as in Hong Kong (Tony Chan, 1996) and Czech Republic and
Slovakia (Chase. 1998). This paper examines the returns to education in Vietnam on
the basis of earnings data were collected by Vietnam Living standard Survey in the
year 2004 (VLSS 2004), It is to attempted to estimate differential returns to
schooling for Vietnamese, male and female, rural and urban areas and also between
the public and private sector. It is hoped to provide a bench mark to examine the
effects of market liberalization and education reform In Vietnam.
3
1.2
Problem statements
Since 1996, from the centralized planning economy changed to market oriented
economy, Vietnam has a strong development with more openness and further
integrated into the World economy, Vietnam has strong integration into the global
economy, exchanging goods, services, Capitals, technologies have increased rapidly
and strongly leads to change Vietnam's society and economy.
In the year 2006 Vietnam officially became to the World Trade Organization
member (WTO) that helped to create more new opportunities to promote export
goods and services which Vietnam has advantages, this circumstance helped Vietnam
absorbs Foreign Direct Investment (FDI) especial in capital and technologies. With
the integration into the World economy, Vietnam has more chances to involve in the
international labor division process, the sector which Vietnam has competitive
advantages. According to integration to the World economy, Vietnamese have
chances to access to advanced technologies and modem management techniques with
increasing labor productivity and increasing wages. Accompany with that more
challenges face low skilled workers; lower earnings, since the gape of earning
between skilled and unskilled are bigger.
1.3
Research objectives
The object of this studying is aimed to exam the impact of education on earnings
during the transition period, and it is also aimed to identify difference of educations
impact between gender, economic sectors, and regions. To get these objects, the rates
of returns to education instrument and data which survey in the year 2004 are used.
Although, there were many previous researches have mentioned about the education
and earnings in Vietnam, But each research has difference interpretations which
based on the characteristics of the economy at each previous. This research focuses
on the impact of education on earnings in the case Vietnam has almost moved to
market economy and integrated the World economy. Moreover, the research focuses
on the following objectives:
To analyze the necessary or the important of education, especially higher education
on the economy, and identify what the factors affect earnings most strongly.
4
To evaluate present quality of Vietnam's education as well as how much education
satisfies the labor market.
1.4
Research questions
From the objects of the research have mentioned above, the main questions could be
made:
Do education levels significantly determine earnings of wage earners? What factors
affect on wage earners, such as; gender, Region, Economic sector and experience?
1.5
Research hypothesis
Education has positive relationship with earnings.
Experience has positive relationship with earnings.
Male has higher earnings than female.
Working in urban earn higher than in rural.
1.6
Data and methodology
Most of data is collected from secondary Vietnam Living Standard Survey 2004. The
research method is used both descriptive and multivariate analysis. In the
multivariate analysis. an econometric technique will be applied, and the basic of
human capital earnings functions by Mincer is used to calculate the rate of return to
education. Sampling frame will be created from VLSS database.
1. 7
Thesis structure
Thesis is organized into five chapters. The first Chapter is introduction, second
chapter is overview of human capital theories and empirical studies, the third chapter
is described briefly Vietnam economy, population, employment and education, and
the fourth chapter mentions the methodology of study and regression model of the
impact of education on earnings and describes variables and data, Chapter five
including collusions which based on the results of the regression. and mentions some
appropriate solution to the authorities with concerning on education.
5
CHAPTER II: LITERATURE REVIEW
2.1 Definition
2.1.1
Income: '"Income refers to all cash inflow streams to an individual from all sources"
(Tony Chan, Stephanie Kent, Sum Lam, Shirley Li, ECON 374 Hong Kong
Economy Term Paper).
2.1.2 Wage: "Wage refers to the monthly or yearly compensation from her/his
employment'' (Tony Chan, Stephanie Kent, Sum Lam, Shirley Li, ECON 374 Hong
Kong Economy Term Paper).
2.1.3
Earnings: "Earnings refers to the compensation per unit labor input, or, m more
familiar words, the ability an individual can earns using a fixed amount of labor
(Tony Chan, Stephanie Kent, Sum Lam, Shirley Li, ECON 374 Hong Kong
Economy Term Paper). It is the best estimated to the productivity of labor and we
will take this denotation throughout our paper".
2.1.4 "Education: is fundamental to enhancing the quality of human life and ensuring social
and economic progress'' (Micheal P. Todaro, Stepphen C. Smith, Economic
Development, Eighth Edition).
2.1.5. Human capital: "Productive investments embodied in human persons. This includes
skills, abilities, ideals, and health resulting from expenditures on education, on thejob-training programs, and medical care" (Becker, 1993).
2.2
Theoretical framework
There are many different theories of the education and earning, each theory has
different interpretations of different variables but most theories was built around a
core model of returns to education or human capital earnings function, 3 different
earnings model are introduce as followings:
2.2.1 Mincer's Early Work on experience
Mincer introduced "Investment in Human capital and Personal Distribution" in 1958,
this study is one of the early theory studied the effect of labor market experience or
on the-job-training on the determination and distribution of earnings. Mincer's model
6
provided an analysis of the manner in which on- the-job training influences
differences in earnings across individuals and how this determines the inequality and
skew ness of earnings, this model based on rational economic behavior by
individuals in labor market which is now called an experience -earning profile, with
assumption of a linear relation between earnings and age. It is only in later work; he
identified and emphasized the important distinction between age and labor market
experience, and the concave shape of the experience -earnings profile. And he wrote
that "formal training "is more difficult to measure than informal on-the job training.
Mincer's model showed that within an occupation earnings inequality increases with
the steepness of the age-earnings profile, and this profile is steeper for occupations
requiring more skills, whether acquired in school or on the job. He also showed
theoretically and empirically that inequality increases with age, schooling level and
income. His theory showed that "the greater the average amount of training in the
group, the greater the inequality in its income distribution'', whether the group is
defined by industry, race, gender, marital status or city size.
While there have been numerous studies over the years of rates of return from formal
education or from specific formal job training programs, the literature in economic is
vertically devoid of studies of magnitude of and rates of return from investment in
on-the-job training, especially experience or merely learning by doing, this may be
due to, at least in part, to the difficulty of measuring the cost of the investment in onthe-job training.
Until 1962, Mincer estimated the magnitude of on-the-job training, the rate of return
from on-the-job training and the implications of on-the-job training for the
distribution of earnings. Here he noted explicitly that earning profiles imply a decline
in on-job-training investment with age, which is attributed to the decline with age
length of the remaining working life. Among other findings, Mincer estimated of
dollar magnitude of on-the-job training increase with the level of schooling.
Although at the margin schooling and on -the job training can be alternative ways of
acquiring skills, overall school and experience investment are positively correlated
across individuals. This is the first empirical demonstration of positive relationship
between two forms of human capital.
7
Estimating of the value of the forgone earnings component of investment in on-thejob training made by workers were obtained by comparing earning streams of
workers that differ by level of schooling. Rates of return from earnings streams were
computed. By assuming that rate of return from schooling and on-the-job training
were the same, and subtracting investment in schooling from total investment,
Mincer was able to estimate the investment in training. These estimates suggested
that for males the dollar value of investments in on-the-job training was the same as
the value of investment in schooling. Investment in schooling had increased over
time in term of years and dollar value, and investment in labor market experience did
not seem to be any less and may have even increased in dollar value during the same
period.
Mincer estimated the rate of return from on-job training for different occupations, he
assumed that their alternative employment would be operatives, and by comparing
earnings as apprentices and as journeymen in contrast to those of operatives, Mincer
computed the rate of returns from on-the-job training. He estimated that the rate of
return from investment in on-the-job training were about 9 to 13 percent, this
estimation also discusses in on-the-job training by women compared to men, and
showed that the average female expects to spend less than half her working life in the
labor force and has higher probability of dropping out of labor force for childrearing. Mincer noted that for reasons employers are more reluctant to invest in firm
specific training for women than for men.
2.2.2 The Schooling - Earning Function
Becker and Chiswick (Becker and Chiswick, 1966) presented an alternative approach
to estimating rates of return to human capital and determinant of the distribution of
earnings by formulating as below:
n
Eij
=
n
EiO + IrijCij
j=l
=
EiO + IrijkijEi,j -1, (1)
j=l
Earning for person i in year j(Eij) were related to earnings if there were no
investment (EiO) plus the sum of the annual returns from past human capital
n
investments, Irij Cij, where rij is the ith person's rate of return from this person's
f=l
8
investment (Cij) in the
t
period. With kj is as investment (forgone earnings and
direct costs) in year j relate to the earnings would have been if there were no
investment in year j, kj = Cj/Ej-1,
By using mathematical induction, (I) become:
n
n
Eij = EiO
(I+ rijkij), (2)
/=1
Taking logarithms,
II
Ln Eij = Ln EiO +I Ln(I +rijkij). (3)
1=1
By using property Ln (I+ a)
~
aif a is a small number,
II
I
LnEij = Ln EiO +
rijkij, (4)
i=l
The natural earnings are expressed in the terms of the rate of return from the
investment (rij) the investment ratio (kij) and the number of periods of investment
(n). The product rk is referred to the adjusted rate of return, r'.
If r' is constant for all levels of investment, equation (4) could be rewritten:
LnEi,j = LnEO + r ni + Ui'
I
Where Ui is the error term which measures difference across individuals in the
omitted variables that influence earnings, including other forms of human capital and
luck.
By separating formal schooling from other human capital, and assuming ~ is the
If
same for all levels of schooling, and putting difference in r' i across levels of
schooling, on-the-job training and other effects in the residual (U' i), equation (4)
should be:
Ln Eij = LnEiO + r' iSij +U' i
Then the regression of LnEij on Sij gives an estimate of r' =rk.
9
--------- ----
-
By creating separate variable. say, for year of primary, secondary, and higher
education were created, the rate of return for distinct level of schooling could be
obtained.
2.2.3 Theory of human capital
In 1974, Jacob Mincer (Mincer, 1974) published his study ''Schooling, Experience
and Earning", this book extended the analysis from Mincer's early work, and it
reflects the advances in and the spirit of human capital theory which carried out by
Mincer. In the Mincer's study, it showed that '"the inclusion in the earnings function
of even crude measures of post school investment's in additional schooling lends a
great deal of scope to the analysis of income distribution" and named the term ''the
human capital earnings function".
Discussion of investment in human capital, Mincer noted that full-time investment
which primarily acquired in schools precedes part-time investment which is generally
conducted on the job. Moreover , for several reasons investments in on-the-job
training would decline relate to earning potential and in absolute value as experience
increases, these factors include the finiteness of working life, that is profitable
investments are more profitable if made sooner rather than later, and the rising
opportunity cost of investment as more skill is acquired. In other words. to extent that
the stock of human capital due to prior investment in training increases the
productivity of new investments in on-the-job training, additional investments are
encouraged. Mincer showed that the concave experience earnings profile that observe
in the data is implied by declining investment ratio, he also showed that there is an
important distinction between age-earnings profiles and experience-earning profiles,
where experience is the years since leaving school. If individuals differ in their level
of schooling, they differ in the age at which post-school (on-the-job training)
investments begin, and hence the two profiles differ. Mincer showed that, the
correlation between schooling and on-the-job training investments are tend positive,
not because they are complements, but because they are reflect the dominance of
individual differences in factors determining the scale of total human capital
accumulation. Research suggested that there is a positive correlation in dollar
investments among all form of human capital (schooling and on-the-job training)
10
even though at the margin various types of human capital can be substituted for each
other to attain the same earnings. In the case of absence of direct information on
investments in on-the-job training or on the years of labor market experience Mincer
suggested that subtracting the age of completion of schooling from reported age.
To establish human capital earning function, he expanded the earnings function;
LnEij
=
Ln EO+
I"'
r' 1,s +
,~J
I·"
r\j + Ui' (1)
,~J
Concerning with mathematical simplicity and statistical tractability, he showed the
development of four function forms, one for each of four cells defined by dollar
investments (C 1), time equivalent investment
decline specification is that K1 = k0-
(kt
=
~), the investment ratio/linear
Et -I
:~ Tt. where K1 is the
investment ratio in the T1h
year of on-the-job training, kO is the ratio in the initial year and T* is the number of
years of positive net investment in training beyond which K1 = 0 . Then if LnEt is the
log of earnings in the year t and rsks is the same for all levels of schooling,
_
(rjkO) T
LnEit- LnEiO + rsks si + (rl·ko) Ti - - .
2T*
2
(2)
I
Where rj is the rate of return from investments in on-the-job training. The logarithm
of gross earnings can be expressed as a quadratic function of years of labor market
experience. To analyze earnings, (2) was rewritten:
Where Ei, Si, and Ti are earnings, years of schooling and years of potential post
school labor market experience (age minus years of schooling minus six), b's are the
regression coefficients and it is assumed that Ui is a normally distributed
homoskedastic residual. The above function provides two estimates of the rate of
return from on-the-job training. If the there are estimates of K0 and T*, the rate of
return from on-the-job training can be estimated from the coefficient ofT or T
2
,
These two estimates tend to differ in part because the data are for earnings net of
current investments, but perhaps more importantly because investment ratio (kt) is
assumed to decline linearly.
II
In the Mincer research ( 197 4 ), he showed that the explanatory power of the
schooling-earnings function is only 7 percent and the explanatory power of the
function with the quadratic experience profile is 29 percent which is increased to 53
percent when dummy variables are used for schooling and the log weeks worked
variable is added to the equation. The explanatory power is increased even further
when the analysis is computed at the overtaking age, that is, at the number of years of
experience where the variance in earnings by experience level is smallest. Thus, the
human capital earnings function provides a high explanatory power for earnings in
spite of simple measures of investment in human capital, namely, years of schooling
and years since leaving school.
2. 3.
Empirical studies
Up to now, there are many studies the impacts of education on earnmgs which
different titles such as: Human capital earning function, returns to education, earning
and education or education, experience and earnings ... and each study used
difference model with based on real situation as well as if s condition in order to has
visual result. All of these studies are mainly research the impacts of education on
earnings or the effects of education and experience on earnings. In my research, I
introduced some of these empirical researches as below:
Studying education and earnings in Lao PDR, Phanhpakit used function as below to
estimate the average rate of returns to different levels of schooling:
Lny = c +a 1 Seci+ a2 Posti+ PExi + y Ex~+ 9Xi + Jd
Where Seci and Posti are secondary and postsecondary education by individual i, and
xi is dummy variable indicating female, marital status and regions. The omitted
category for level of education is primary education
Estimating the rate of return to schooling per year for each academic year from age
11 to 18 with the completed primary education of 5 years, they used the model as
below:
18
LnYi
=
c + _L
a" s~ +PExi +yE x:+ui.
n~ll
And the results they got:
12
Returns to schooling by education levels:
For Vientiane capital, the rate of returns to schooling increased from 3.5 percent for
II years of schooling to 5 .I percent for 13 years (Vocation level) and started decline
2.4percent for I5 years and increased again to 6 percent for I8 years of schooling
(University level).
For other provinces, the rate of return decreased from 2.7 percent for I1 years to 2
percent for I8 years of schooling.
Regional differences:
An additional schooling year would yield 4.5 percent and 2 percent more earning in
Vientiane capital and other provinces.
The returns to one additional year of experience would increase earnmg by 3.5
percent in Vientiane capital and 1.2 percent in other provinces.
Gender differences
The rate of returns for females is about 1.5 percent higher than that of males, 5.29
percent for females and 3.82 percent for males.
Region difference
A worker in the northern, central, and southern regions would earn about 28%, 16%,
and 21% lower than his/her counterpart in capital.
And Estimation of the human capital earning function in Hong Kong, Tony Chan,
Stephanie Kent, Sum Lam and Shirley Li used the econometric model:
2
LnY +Po+ PIS+ PzS +P3t +P4t
2
Where Y, S, T are the monthly employment income, years of schooling and years of
work, and to estimate the percentage of increasing in earning by studying one more
year and it is exactly equal to the return on schooling, they used the function;
a~:y = ay: as= PI+ 2PzS = rs
13
~ 1 represents
the returns of schooling if one studies the first year and ~ 2 represents the
marginal increase in returns to schooling. If
~2
is zero, it means that return to
schooling is constant.
Return to work experience, to estimate the percentage increase in earnings of
accumulating one more year work experience, the author used the function:
The two coefficients ~ 3 and ~ 4 capture three variables, rp. k 0 and T are return to onthe-job training, investment in human capital at time 0/earning at time 0 and total
working life. And the results of the estimation they got:
There is no uneducated person in Hong Kong could earning 5.29500 in 1996, the
return to first-year schooling is 6.63 percent and marginal increase of return to
schooling is 0.36 percent.
Increased in earning by accumulating first year's work experience is 16.3 percent and
decreased return nature of work experience on earning is 0.378 percent.
And to estimate the returns to schooling in Russia and Ukraine Yuriy
Gorodnichenko, Klara Sabirianova Peter used the basic Mincerian earnings function
with standard set covariates available for both countries as:
J
In OJ it = f3 o + f3 1schit+ f3 2expit + f3 3 ex p~ + f3 4femaleit+ f3 5 capital it+ dt
II
where i indexes individuals, t indexes time,
OJ
it is monthly contractual wages after
taxes at the primary job, schit is adjusted years of schooling, expit is years of potential
labor market experience, femaleit is a dummy variable indicating if an individual is
female, capitalit is a dummy variable indicating if an individual i lives in the capital
city and dt is an independently distributed error term. The results of the research as:
In Russia, the returns to schooling in 1996 were 8.1 Percent comparing to in 2002
were 9.2 percent, while in Ukraine was only 4.5 percent in 2002. The gender wage
gap in Russia fell from 53 percent in 1998 to 4 7 percent in 2002.
14
2.4
Comments on the theories and empirical studies.
There are many factors impact on earnings, the main factors that affect on earnings
could be extracted from the theories as follows:
The main facts affect on earnings is education; earnings are depended on education;
education increases skills, increase productivity, increase outcome and increase
earnings.
Earnings are affected on experience; as education, experience increase skill, increase
productivity, increase outcome and increase earnings.
By using difference methods of research, all of the theories were mention a bow
shown that, education is the main factor affects on earnings.
Mincer's early work, experience was one of the earliest theories studies the factors
affect on earnings, these theories besides studied the returns to experience or
investment on-the-job training, it was also studied the returns to education. Its shown
that both experiment or investment on-the-job training and education increased skills
and increase earnings (within an occupation earnings inequality increases with the
steepness of the age -earnings profile, and this profile was steeper for occupations
requiring more skill, whether acquired in school or on the job). Moreover, these
theories shown that the returns on experience between women and mane are
difference, these results were true up to now. Although Mincer's research would not
explained all of factors affect on earnings, in other words, Mincer's early models
were a code to study the returns to earnings, its not a sufficient model to apply all of
the economies, because earnings of individuals are not only affected by experiment
and education, but its also affect by other factors which we will discuss below.
Mincer's early theories have limited but its foundation for other model.
The rate of returns to human capital theory by Becker and Chiswick, in their theory
education was separated into many level and earnings of level could be calculated
separated.
The human capital earnings function by Jacob Mincer is a sufficient function and is a
really perfect function to analyze the return to education, up to now, this function is a
15
basic function that many studies based on to calculate the rate of returns to education
in many difference economies. This function has several distinct characteristics:
It is an identity based on the optimizing behavior of individuals, and represents the
outcome of a labor market process.
It is readily adaptable to the inclusion of other variables that affect earnings
The coefficients of the regression equation have economic interpretations, they are
pure numbers and their standard errors can be estimated. This permits comparisons
across time, space and demographic groups.
Although earnings are positively skewed and the inequality of earnings rises with the
level of schooling, by using the natural logarithm of earnings as dependent variable,
the residuals are closer to being normally distributed and homoskedastic. This
function could be extended to calculate human capital earnings in Vietnam.
2.5
Modeling
Base on these above theories and empirical studies, the model of the impacts of
education on earning is suggested as below:
Earning function with years of schooling
Lnyi = ao +Ji1 Sci+ fi 2 Exi + fi 3 Exe + 9Xi + 11i
Where Sci is schooling education by individual
1,
and Xi is dummy variable
indicating female, region, and economic sectors.
And earning function with education level
Lnyi = ao +fi1 Seci+ fi 2 Posti+ fi 3 Exi + fi 4 Exe + 9Xi + Jli
Where Seci and Posti are secondary and post secondary education by individual i,
and Xi is dummy variable indicating female, region, and economic sectors.
16
-------------------------------------------
CHAPTER III:
ECONOMIC, EDUCATION AND LABOUR MARKET IN VIETNAM
3.1
Economic in transition
In 1986, the Sixth Party Congress of the Communist Party of Vietnam, Vietnam's
economy has changed from the command economy to market oriented economy and
it was called "Doi Moi" after that Vietnam has very successful achievement in
economic, GOP growth around 8 percents from 1990 to 1997. After the year 1997
the economy fell develop with resulting from the East Asian Financial crisis in 1997,
GOP growth fell to 6 percent in 1998 and 5 percent in 1999 and then rose to 6
percent in 2000 even against the background of global recession, making it the
world's second-fastest growing economy. In July 13, 2000 Vietnam and United state
signed the Bilateral Trade Agreement (BTA) that was a significant milestone for
Vietnam's economy. The BTA provided for Normal Trade Relations (NTR) status of
Vietnamese goods in the United State market, this element allowed Vietnam to
hasten its transformation into a manufacture based, and export economy. It would
also attracted foreign investment to Vietnam, not only from the United State, but also
from countries in area and other regions.
After recovering from East Asian Financial Crisis, Vietnam's economy had
spectacular development which an average growth in GOP of 7.1 percent per year
from 2000 to 2004 (GES Vietnam, 2007). The GOP growth was 8.4 percent in 2005,
the second largest growth in Asia, and over 8 percent in 2006. November 2006,
Vietnam became the 150th member of the World Trade Organization, after 11 years
of preparation, including 8 years of negotiation. Vietnam's access to WTO should
provide an important boost to Vietnam's economy and should help to ensure the
continuation of liberalizing reforms and create options for trade expansion.
In agriculture, from an imported country, Vietnam is now not only the second largest
rice exporter in the world but also the world's largest Robusta coffee, cashew nuts
and pepper exporter. Vietnam has the highest percent of land use for permanent
17
crops, 6.93 percent of any nation in the Greater Mekong Sub-region (GES Vietnam,
2007).
Paralleling
its
efforts to
increase
agricultural
output
and
after applying
industrialization and modernization policy Vietnam has sought with some success to
invigorate industrial production. Industry more and more contributed high percentage
in GDP, 32.5 percent of GDP in 1999 and 41.8 percent in 2006 (GES Vietnam,
2007). Nevertheless, foreign direct investment (FDI) much of it gravitated to the new
industrial zones in the south has gone some way towards transforming the industrial
landscape of Vietnam.
In addition, Vietnam has achieved some success in increasing exports of some laborintensive manufactured goods in recent years.
Mining is a key industry in Vietnam; Coal
IS
a main export for Vietnam. The
chemical plants in Vietnam are starting to grow stronger. Some manufacturing also
improves the economy.
3.2
Population and labor force
Vietnam has a large size of population which ranks thirteenth worldwide, and the
second among Southeast Asian countries, the population has increased quickly, from
66 million in 1990, 72 million in 1995, 77million in 2000 and 83 million in 2005, the
average growth rate of population was 1.65 percent. The proportion of female in
population is higher than that of male. Vietnam is an agriculture nation; the
population is almost in rural area. Although in recent years, due to the development
of the economy, the process of urbanizing is quickly, these elements lead to
migrating from rural to urban is big, lead to change the population structure between
rural and urban area, from 19,51 percent in 1990 to 20,75 percent in 1995, 24,18
percent in 2000, and 26, 88 percent in 2005(GES Vietnam, 2007).
The percentage of young in the population has increased. In recent years, average
increased of group age from 5-14 years 12 percent and group age 15-19 increased by
I 0.8 percent
18
Table 1: Vietnamese's population
year
Females
Males
Rural
66016.7
32202.8
33813.9
12880.3
53136.4
1991
67242.4
32814.3
34428.1
13227.5
54014.9
1992
68450.1
33424.2
13587.6
54862.5
-69644:51
34o2i.31
35616.2
13961.2
55683.3
36191.3
14425:61 . . . . 56398:9·1
m-
r--
7o-82~f5T
· · · 3463i2r······
1
71995.5
7:fi56.7T
35237.4 I
35857.3
I
74306.9
1994
1995
- i996-
I
---
1997
··-· --75456:31
1998
'-···-··-··········-·-·······
Urban
1990
1993
. . . .......
By residence
By sex
Total
1999
2000
- -- 2ooi·-···----
········--!
2002
2oo4
2005
--i493iil
57057.4
37299.4
15419.9
57736.8
36473.1
37833.8
16835.4
57471.5
37089.7
38366.6
17464.6
57991.7
76596.7 I
37662.1
38934.6
77635.4
-·78685:81
38166.4
38684:2
39469.0
79727.4
39197.4
4o53o.oT-
---8o9o2:4·····r · 3975s:4r ·
2003
····
1
36758:1T
-s2o3J:71
4o3io:s
· · - - · · · s3to65T
40846.2
Source: General Statistic Office 200 7
19
r
··················· ···········-
18081.6
58515.1
ls77I:9·r
58863.5
4ooo1:6-T ..... 19469-:JT
5-9216~5-
2oo22:c-r · · 59705.3
··4ii47:or-······2os69:S1 ·······6oo32:9·4i72T::z--r-
21737.2
1
60294.5
42260.1
22336.8 I
60769.5
-
---
Table 2: Literacy of population age 15 and over by area, region have certificate
Highest certificate (%)
General
Without
Without
schooling
certificate
~~~~~~~~:
·:::::::::1:.1:~~:~~~---·
Rural, urban
----~;~~~
primary
19.67 I 26.40 I
7.81
:r~~~.~~~ • • •· · · ·:· · -~·~:; :::~:
lower
Upper
technique
secondary
secondary
trained
College.
Higher
University
educatton
1.47
2.8s 1 3.42-
r o:os
~~:~?..! . . . 3.35
~:!:I ~::~
0.31
27:61T 1o:sfl
21.49 I
25.03
:za:osr
28.47
8.o8
I
o.85
Vocation
0.01
Gender
···1o6:66T · ···········4:7sT·
166.66
10.66
Male
Female
··Re9Ion · · · · · · · · · · · · · · · · · · · · ·- ·
Red river delta
·
··1a6:6al······· 4.o4T
~??:??:!::::::::······
North east
North west
100.00
9.64
20.21
100.00
5.46
100.00
6.33
17.o3
27.32
22.13
25.55
1o.o4
15.19
21:73
17.26
25.04
26.34
~: -:~- -· 1· · · · · ·~: ~ ~· · · · ·~:~ ~· :::~
4.15
0.13
2.75
0.04
42.48
5.26
························-·······
31.06
19.46
14.37
2.47
·······-······
3.84
-······ .........................
9.53
5.88
2.75
4.18
0.25
·········2-.s·a····
0.02
···········-·-·········-······-
0.98
3.49
1.90
2.73
0.05
3.58
0.04
0.01
Northcentral
coast
13.10 I 24.04
37.20 I 12.43 I
1.62
3.37
20.89
23.74
0.80
2.53
South central
coa~
·············--··········--··-·······--···-············-······- .. ····---------··········-·······
Central highland
South East
mom
100.00
.....
··•············
15.08
1100.00
6.43
100.00
10.56
31.44
..........................................
20.43
20.49
31.11
20.28
29.49
20.90
34.45 I 32.87
13.51
10.64
7.-16
14.04
1:15"
2.63
······························-
···················
0.96
2.30
0.41
1.29 I
2.21
·····················-······
0.01
5.29
0.10
1.47 I
0.01
Mekong River
Delta
············-···········································""··--·'"·········································"'········
.............................
(Source: GES Vietnam, 2007).
20
5.43 I
--------------- -.-
3.3.
Education achievements
After nearly 20 years of Doimoi, Vietnam has a big achievement in education,
education and training has been expanded and developed in quality and quantity.
Types of schools and classes and education modes have been diversified, including
all types of public and private, formal and non-formal education. The school network
cover almost residential areas which providing conveniences to the learners,
education for remote and far areas, especial for ethnic minority people also
improved. The size of education also has been developed, almost population for 15
year of age or upper are literate, almost provinces and cities have achievement the
national standard for literally education and primary education, the average number
of years attending schools of the population was 7.3. The number of college and
university students increased quickly, from
899,5 thousand students in the years
2000 to 1387,1 thousand students in the year 2005 and 210,9 thousand students
graduated and 111.6 people were trained 1•
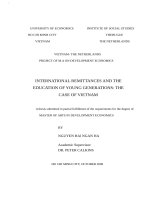
Table 3: School enrollment trend in Vietnam 2000 - 2004
12000
10000
...
8000
- ·
--+--Primary
•
6000 .
Lower secondary
Upper secondary
___ _l.Jrl~"!_rsjl~ ~~~"~e
4000
2000
0
2000
2001
2002
2003
2004
Sources: General statistic office-2004
3.4.
Education expenditure
Education expenditures are mainly subsided from two sources, Government subsidies
and private sector. In private sector is come from tuition fee.
1
General statistic office 2007
21