Spatio temporal assessment of land use and land cover change and its impact on akaki kality sub city addis ababa, ethiopia
Bạn đang xem bản rút gọn của tài liệu. Xem và tải ngay bản đầy đủ của tài liệu tại đây (5.37 MB, 93 trang )
ADDIS ABABA UNIVERSITY
SCHOOL OF GRADUATE STUDIES
SPATIO-TEMPORAL ASSESSMENT OF LAND USE AND LAND COVER CHANGE
AND ITS IMPACT ON AKAKI -KALITY SUB CITY ADDIS ABABA, ETHIOPIA
THESIS SUBMITTED TO DEPARTMENT OF GEOGRAPHY ANDENVIRONMENTAL
STUDIES PRESENTED IN PARTIAL FULFILLMENT OF THE REQUIREMENTS
FOR
THE
DEGREE
OF
MASTER
OF
ARTS
IN
ENVIRONMENTAL STUDIES
BY
AYENEW
ESHETU ALEMAYEHU
ADDIS ABABA, ETHIOPIA
JUNE, 2017
xv
|Page
GEOGRAPHY
AND
ADDIS ABABA UNIVERSITY
SCHOOL OF GRADUATE STUDIES
SPATIO-TEMPORAL ASSESSMENT OF LAND USE AND LAND COVER CHANGE
AND ITS IMPACT ON AKAKI KALITY SUB CITY, ADDIS ABABA, ETHIOPIA
THESIS SUBMITTED TO DEPARTMENT OF GEOGRAPHY ANDENVIRONMENTAL
STUDIES PRESENTED IN PARTIAL FULFILLMENT OF THE REQUIREMENTS
FOR
THE
DEGREE
OF
MASTER
OF
ARTS
IN
GEOGRAPHY
ENVIRONMENTAL STUDIES
BY
AYENEW ESHETU ALEMAYEHU
ADVISOR: - PROFESSOR TEGEGNE GEBRE EGIZEHEBER (PHD)
ADDIS ABABA, ETHIOPIA
JUNE, 2017
AND
Addis Ababa University
School of Graduate Studies
This is to certify that the thesis prepared by Ayenew Eshetu Alemayehu
Entitled “Spatio-Temporal Assessment of Land use and Land cover changes and its impact on
Akaki Kakity Sub-City, Addis Ababa Ethiopia” and submitted in partial fulfillment of the
requirements for the Degree of Master of Arts in (Geography and Environmental Studies,
specialization: (Population, Resource and Development) complies with the regulations of the
university and meets the accepted standards with respect to originality and quality.
Advisor
Signature
Date
Signature
Date
Signature
Date
Prof. Tegegne Gebre- Egizeheber
Examiner
Dr.Tesfaye Shiferaw
Examiner
Dr.Ermias Teferi
Chair of Department of Graduate program
Declaration
I hereby declare that the thesis entitled. Spatio-Temporal Assessment of Land use and Land
Cover Change and its impact on Akaki Kakity Sub City, Addis Ababa has been carried out by me
under the supervision of Professor Tegegne Gebre- Egizeheber (Phd), Department of Geography
and Environmental Studies, Addis Ababa University, Addis Ababa during the year 2016/17 as
part of Master of Art in Geography and Environmental studies specialized on Population,
Resources and Development. I further declare that this work has not been submitted to any other
University or Institution for the award of any degree or diploma.
Ayenew Eshetu
Signature: _____________________
Date:
Place of submission: - Addis Ababa University Chair of Department of Graduate program
The study has been submitted for examination with my appropriate approval as an adviser.
Name: - Professor Tegegne Gebre Egizeheber (Phd)
Signature:-________________
Dedication
I dedicate this thesis manuscript to my late grandmother Abebech Bogale (Abaye) for nursing me with
affections and love and her dedicated partnership in the success of my life. Let your soul rest in peace.
Acknowledgment
First and foremost, I would like to thank the Almighty God for giving me all the patience and strength to
complete my study against all odds. Several individuals and organizations deserve acknowledgement for
their contributions to the study. I am indebted to the invaluable support of my advisor Professor Tegegne
Gebre Egziabher for his unreserved advice, guidance, and constructive observations starting from the very
commencement up to thesis completion. Without his encouragement, insightful and professional
expertise, the completion of this work would have not been possible.
Secondly, I would like to thank all the staff of Ethiopian Mapping Agency (EMA);(GIS and Remote
sensing staff members) Specially, W/ro Hareg (GIS officer) for their cooperation .My gratitude also goes
to Akaki Kality Sub-city Administration Land Development and Management office ,Ato Mohammed
Tarekeg (GIS and Map preparation case team leader ),Ato Kehase G/Hiwot (Land Development and
Renewal officer ;Compensation and Rehabilitation officer ).Ato Sasa Tilaye (Displaced Rehabilitation
case team officer ) for their warm hospitality and assistance .I would also like to express my heartfelt
thanks to the farmers who responded to my numerous questions with patience during data collection time.
I would like to extend words of appreciation to the Communication officers of Akaki Kality Sub-City
Administration ,Woreda 6 Administration (Communication officers in particular) and CSA Staffs.
Finally, I am very grateful to express my appreciation and thanks to my family for their love,
encouragement and support. To my beloved Father Ato Eshetu Alemayhu , to my Brother Samuel E who
guided my life thoughtfully during my early age. In addition, my Sisters and brother Hirut E, Senait E
and Amare E without their support, I would not have been able to complete my graduate study
successfully. Thank you!
Contents
Declaration………………………………………………………………………………….…..iii.
Dedication………………………………………………………………………..…………………….…iv
Acknowledgement……………………………………………………………………………..…v
Contents ........................................................................................................................................ vi
List of Table…................................................................................................................................x
List of Figures……………………………………………………………………………….…...xi
List of Equations……………………………………………………………………..…….…..xiii
Abbreviation ............................................................................................................................... xiv
Abstract …………………………………………………………………………........................xv
CHAPTER ONE ..........................................................................Error! Bookmark not defined.
1.INTRODUCTION...................................................................................................................... 1
1.1. Background of the study ........................................................................................................ 1
1.2 Statement of the problem........................................................................................................ 2
1.3 Objectives ............................................................................................................................... 3
1.3.1. General objective…………………………………………………………………………………………………………………..3
1.3.2. Specific objectives…………………………………………………………………………………………………………………3
1.4. Research questions ................................................................................................................ 4
1.5. Significance of the study ........................................................................................................ 4
1.6. Scope of the study .................................................................................................................. 5
1.7. Organization of the Study ...................................................................................................... 5
2.CHAPTER TWO ....................................................................................................................... 6
CONCEPTUAL AND LITERATURE REVIEW ..................................................................... 6
2.1. Conceptual Literature ........................................................................................................... 6
2.1.1. Land use/Land cover change………………………………………………………………………………………………6
2.1.2. Causes of LULCC…………………………………………………………………………………………………………………6
2.1.3 Land use/Land cover change in Ethiopia………………………………………………………………………………..8
2.1.4. Application of Remote sensing and GIS for Land use/Land cover analysis……………………………9
2.1.5 Empirical Literatures………………………………………………………………………………………………………12
3.CHAPTER THREE ................................................................................................................. 15
MATERIALS AND METHODS ............................................................................................... 15
3.1 Description of the Study Area ............................................................................................... 15
3.1.1 Location and Topography…………………………………………………………………………………………………….15
3.1.2 Climate……………………………………………………………………………………………………………………………16
3.1.3 Vegetation……………………………………………………………………………………………………………………….17
3.1.4 Population……………………………………………………………………………………………………………………….18
3.2 Research Methodology ......................................................................................................... 19
3.2.2 Satellite Imagery…………………………………………………………………………………………………….…………19
3.2.3 Socio-economic baseline supplementary data…………………………………………………………………..20
3.2.4 Household Questionnaire Survey………………………………………………………………………………………21
3.2.5 Focus Group Discussion (FGD)…………………………………………………………………………………………..21
3.2.6 Image processing………………………………………………………………………………………………………………21
3.2.7 Development of classification scheme………………………………………………………………………………22
3.2.8 Image Classification………………………………………………………………………………………………………….23
3.2.9 Accuracy Assessment………………………………………………………………………………………………………..24
3.2.10 Methods of Data Analysis……………………………………………………………………………………………….26
3.2.11 Sample size Determination……………………………………………………………………………………………..26
3.2.12 Method of Socio Economic Data Analysis………………………………………………………………………..28
4.CHAPTER FOUR ................................................................................................................... 29
RESULTS AND DISCUSSIONS ............................................................................................... 29
4.1 Land Use and Land Cover Analysis ...................................................................................... 29
4.1.1 Land Use and Land Cover Mapping…………………………………………………………………………………..29
4.1.2 1986 LULC………………………………………………………………………………………………………………………..30
4.1.3. 2000 LULCC……………………………………………………………………………………………………………………..33
4.1.4 2016 LULCC…………………………………………………………………………………………………………………..…36
4.1.5. Accuracy Assessment of 1986………………………………………………………………………………………….38
4.1.6 Accuracy Assessment of 2000………………………………………………………………………………………….39
4.1.7 Accuracy Assessment of 2016………………………………………………………………………………………….40
4.1.8. LULCC Detection…………………………………………………………………………………………………………….42
4.2 LULC Change Map………………………………………………………………………………………………………….46
4.2.1 LULC change map from 1986-2000……………………………………………………………………………………46
4.2.2 LULC change map from 2000-2016…………………………………………………………………………………….48
4.2.3 LULC Change map of 1986-2016………………………………………………………………………………………..50
4.3 Analysis of Socio-Economic Survey ...................................................................................... 51
4.3.1 Age - Sex Composition………………………………………………………………………………………………………51
4.3.2 Marital Status……………………………………………………………………………………………………………………52
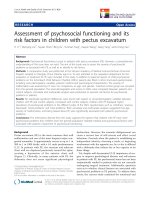
4.3.3 Literacy Status of Respondents………………………………………………………………………………………….52
4.3.4 Employment Status of Respondents…………………………………………………………………………………53
4.3.5 Land use land cover change………………………………………………………………………………………………54
4.3.6 Causes of Land use land cover change……………………………………………………………………………….56
5.CHAPTER FIVE ................................................................................................................... 58
CONCLUSION AND RECOMMENDATIONS ...................................................................... 58
5.1 Conclusion ............................................................................................................................ 58
5.2 Recommendations ................................................................................................................ 60
Bibliography ................................................................................................................................ 61
Appendix ...................................................................................................................................... 66
I.
Questionnaires .................................................................................................................... 66
II
GPS Points .......................................................................................................................... 70
II. Field work photographs ...................................................................................................... 75
List of Tables
Table 1 Population Density of Akaki Kality Sub City by Woreda ....................................................... 19
Table 2 Landsat image Characteristics ………………………………………………………… 22
Table 3 Description of Land use type ………………………………………………………...…23
Table 4 Interpretation of 1986 classified map .................................................................................... 32
Table 5 Interpretation of the classification of 2000 ............................................................................. 35
Table 6 Interpretation of 2016 Classified map…………………………………………………...37
Table 7 Accuracy assessment of 1986 ............................................................................................... 39
Table 8 Accuracy assessment of 2000 ............................................................................................... 39
Table 9 Accuracy assessment of 2016 ............................................................................................... 40
Table 10 Change of classes in three time periods. .............................................................................. 43
Table 11 LULC conversion Matrix of 1986-2000 .............................................................................. 47
Table 12 LULC Conversion Matrix of 2000-2016.............................................................................. 49
Table 13 Conversion matrix of LULC Change map of 1986-2016 ....................................................... 51
Table 14 Age and Sex Composition of the Respondent………………………………………… 52
Table 15 Percentage of marital status ot the Respondent .................................................................... 52
Table 16 Literacy status of the Respondent........................................................................................ 52
Table 17 Percentage of the Respondent Employment statuse .............................................................. 53
Table 18 Percentage distribution of respondents on justification for LULCC ...................................... 54
Table 19 Percentage Distribution of Respondents on causes of land use/land cover change .................. 56
List of Figures
Figure 1 Proximate and underlying causes of LULCC ……………………………………..…. 7
Figure 2 Percentage distribution of LULC change in Ethiopia ………………….......………….8
Figure 3 Location map of the Akaki Kality sub-city .......................................................................... 16
Figure 4 The relationship between rainfall and temperature in the catchment area ................................ 17
Figure 5 Population size in sub cities ................................................................................................ 18
Figure 6 Methodological flow chart .................................................................................................. 25
Figure 7 Landsat image of 1986........................................................................................................ 30
Figure 8 Classified map of 1986 ....................................................................................................... 31
Figure 9 Percentage of 1986 LULCC ................................................................................................ 32
Figure 10 Landsat image of 2000 ...................................................................................................... 33
Figure 11 Classified map of 2000 ..................................................................................................... 34
Figure 12 Percentage of 2000 LULCC .............................................................................................. 35
Figure 13 Landsat image of 2016 ...................................................................................................... 36
Figure 14 Classified map of 2016 ..................................................................................................... 37
Figure 15 Percentage of 2016 LULCC ............................................................................................. 38
Figure 16 GPS points for ground truth .............................................................................................. 41
Figure 17 LULCC of the three selected years ................................................................................... 42
Figure 18 Chart of LULC Change trend by percentage over different time decades .............................. 44
Figure 19 LULC change map from 1986-2000.................................................................................. 46
Figure 20 LULC change map from 2000-2016.................................................................................. 48
Figure 21 LULC Change map of 1986-2016 ...................................................................................... 50
Figure 22 Fied work 1 ...................................................................................................................... 53
Figure 23 Field Work 2 (FGD discussants) ........................................................................................ 56
List of Equations
Equation 1 kappa statistic formula .................................................................................................... 24
Equation 2 Rate of LULCC .............................................................................................................. 26
Equation 3 Formula to calculate sample size...................................................................................... 27
Equation 4 Actual sample size .......................................................................................................... 28
Abbreviation
CSA : Central Statistical Agency
DEM : Digital Elevation Model
EMA : Ethiopian Mapping Agency
ERDAS : Earth Resource Data analysis System
ETM+ : Enhanced Thematic Mapper Plus
FAO: Food and Agricultural Organization of United Nations
FGD/s- : Focus Group Discussion/s
GCPs : Ground Control Points
GIS : Geographic Information System
GPS : Geographical Positioning System
KII : Key Informant Interview
LANDSAT : LAND + SAT(ellite)
LULC : Land use/Land cover
LULCC: Land use/Land cover change
MCM : Million Cubic Meter
MSS : Multi Spectral Scanner
MLC: Maximum likelihood classifier
RS : Remote Sensing
TM : Thematic Mapper
USGS : United States Geological Survey
UTM : Universal Transverse Mercator
WGS: World Geodetic System
Abstract
Spatio-Tempora Assessment of Land Use and Land Cover Change and its impact on Akaki Kakity Sub
City, Addis Ababa Ethiopia
Ayenew Eshetu
Addis Ababa University
The study was undertaken in Addis Ababa city Administration, Akaki Kality Sub city . Land use, land
cover changes for the last thirty years in Akaki Kality Sub city is one of the reasons which strongly
challenge the environment. The main objective of this study is to examine the Land use land cover change
of Akaki Kality Sub-city. The study intended to carry out land use /land cover changes, trends and their
magnitude over the last thirty years using remote sensing (RS) and Geographic information system (GIS).
In this thesis, Satellite image of 1986, 2000 and 2016 to detect the LULCC using maximum likelihood
classifier. The GIS and RS analysis result confirms that the LULCC of observed, Settlement showed an
increase of 50 % and followed by Cultivation by 17.8% while eucalyptus, grassland and water body
decreased by -117%, - 247%, and -66% respectively. From the analysis of the socio economic situation of
households to identify the causes of the LULCC, the result shows that LULCC were closely associated
with human activities.
Keywords: GIS, TM, RS, LULCC, ETM+
xv 2 | P a g e
CHAPTER ONE
INTRODUCTION
1.1. Background of the study
Land is the earth‗s terrestrial surface which is full of resources for most human activities and
needed for such activities (Daniel , 2008). According to Wolman (1983), land use changes over
the past 6,000 years are associated with the growth of human population. For many years, the
growth of agricultural production related to the expansion of population, together took place
through the expansion of land under cultivation. According to FAO (2008), Land cover describes
vegetation and man-made features, whereas land use is characterized by the arrangements,
activities and inputs, people undertake in a certain land cover type to produce, change or
maintain it. Information on LULC is essential for the selection, planning and implementation of
land use schemes to meet the increasing demands for basic human needs and welfare.
There are some factors that influence LULCC, these factors are driving forces. Driving forces
are generally subdivided into two broad categories: proximate causes and underlying causes.
Proximate causes are the activities and actions which directly affect land use. Underlying causes
are factors that trigger the proximate causes, including demographic pressure, economic policy,
technological development, institutional and cultural factors (Geist et al., 2002). Nowadays
urbanization has also been contributing for land use land cover change.
According to Satterthwaite (2005), Urbanization is the outcome of social, economic and political
developments that lead to urban concentration and growth of large cities, changes in land use,
and transformation from rural to metropolitan patterns of organization and governance .At the
beginning of the twentieth century, just 16 cities in the world, the vast majority in advanced
1|Page
industrial countries contained a million people or more. Today, almost 400 cities contain a
million people.
1.2 Statement of the problem
Our current understanding of LULCC in urban area especially in Ethiopia is inadequate. The
lack of an understanding of the trends in the change of LULC in relation to the urban expansion
in the study areas currently impedes planning processes at the urban level. In order to better
understand LULCC and its relationship to urban expansion and its consequences for the
surrounding rural population, it was necessary to conduct studies that explicitly reveal the
pattern, driver, and social impacts of LULC in the study area. This research were address
relevant issues on LULCC in relation to the socioeconomic of the surrounding rural population
and provide recommendations which may contribute to the rural population sustainability; and to
the forest, soil and water conservation in the study area.
For the last few years Addis Ababa and its surrounding have witnessed unprecedented land
degradation as a result of deforestation for fuel wood supply and human settlement. At a rate of
6.65Km2/year the city‘s vegetation area are converted to permanent structures (Tamiru et al.,
2005).
Akaki Kality Sub city has experienced rapid land use and land cover changes (LULCC) in the
past three decades. This has been due to increased pressure on land, caused by increased
population, household partitioning and changes in consumption patterns.. (Addis Ababa City
Land Information Center, 2014).
2|Page
There is literature scarcity on the consequences of LULCC of the study area. But, there are some
researches done on Quarry rehabilitation planning of Akaki Kality sub city by (Setegn, 2013) and
Land Use Land Cover change detection of Akaki river basin (Adimasu, 2015).
The first reason that Akaki Kality sub city was selected due to have received few research
attention, so far those researcher I missioned above conducted study on Quarry rehabilitation and
LULCC detection of Akaki river. However, LULCC of the sub city so far was not well assessed.
Because of these reasons this study aimed to fill the gaps that were missed by other researchers.
The second reason were, Akaki Kality sub city found in the periphery area of the city ; due to
this the sub city have dynamic nature of land use ,for e.g establishment of new industries and
expansion of settlement site. Therefore, the study initiates to assess the LULCC of the Akaki
Kality sub city.
1.3 Objectives
1.3.1. General objective
The general objective of the study was to examine the LULCC of Akaki kality sub city and its
causes.
1.3.2. Specific objectives
The specific objectives of the research were :
To quantify land use and land cover change in Akaki Kality Sub city of the area over
years between 1986—2016.
To describe the rate of LULCC.
3|Page
To identify the causes of LULC changes of the study area.
1.4. Research questions
The purpose of this study is to answer the following questions. The questions are drawn from the
objectives stated above.
1. What is the pattern of LULCC of the area over the study period?
2. What are the causes of LULC change in the area?
3. What is the rate of LULCC?
1.5. Significance of the study
This study is designed to contribute to the effect of Urbanization on LULCC and its impact on
the surrounding rural population. Hopefully, it provides clue on measures to be taken and
strategies to manage population pressure and to improve sustainable resource use, support
decision making at the sub city level for sustainable LULC management. In addition to this, the
study may be used as a source of additional material for further study in the relationship between
urbanization. Additionally, this scientific information will be invaluable not only to academia but
also to formulate appropriately policy interventions, by different regional and federal
government bodies in Ethiopia to control the negative effects of population pressure on land use
and land cover.
4|Page
1.6. Scope of the study
The spatial scope of the study is limited to Akaki Kality sub city in South Western part of Addis
Ababa, whereas the temporal scope is based on the long term Landsat image data analyze
obtained from EMA since 1980s.
1.7. Organization of the Study
This thesis is organized into five chapters. Chapter I is introduction, objectives, research
questions, scope and organization of the study. Chapter II deals with the related literature review
of the study, which includes the conceptual framework and other secondary data sources.
Chapter III tries to introduce the location, major biophysical and socioeconomic attributes of the
study area with the assumption that these have direct relations with the issues under investigation
and listing of the detailed description of the way data were captured and processed. Chapter IV
concentrates on the analysis of the result and discussions LULC change and the socio-economic
survey in the study area. Chapter V deals with conclusions and recommendation for
stakeholders.
5|Page
CHAPTER TWO
CONCEPTUAL AND LITERATURE REVIEW
2.1 Conceptual Literature
2.1.1. Land use/Land cover change
According to Quentin et al. (2006),.Land use change is defined to be any physical, biological or
chemical change attributable to management, which may include conversion of grazing to
cropping, change in fertilizer use, drainage improvements, installation and use of irrigation,
plantations, building farm dams, pollution and land degradation, vegetation removal, changed
fire regime, spread of weeds and exotic species, and conversion to non-agricultural uses.
In addition FAO, (2008).Presented Land use as ―the total of all arrangements, activities and
inputs that people undertake in a certain land cover type‖. In contrast, Land cover ―is the
observed physical and biological cover of the earth’s land as vegetation, rocks, water body or
man-made features‖ (FAO, 2008).
2.1.2. Causes of LULCC
LULCC also known as land change is a general term for the human modification of Earth's
terrestrial surface (Ellis, 2010). LULC change is commonly divided into two broad categories:
conversion (a change from one LULC category to another e.g from forest to grassland) and
modification (a change within one LULC category e.g. from rain fed cultivated area to irrigated
cultivated area) (European Commision, 2001). Land cover modifications entail the changes that
affect the character of the land without changing its overall classification and can either be
human induced, for example, tree removal for logging; or have natural origins resulting from, for
6|Page
example, flooding, drought and disease epidemics. Land cover conversion is the complete
replacement of one cover type by another such as deforestation to create cropland or pasture.
Driving forces of LULCC are well documented and can be also grouped into proximate and
underlying factors (Lambin et al., 2002). The proximate causes of land use changes constitute
human activities or immediate actions that originate from intended land use and directly affect
land cover (Turner et al., 1994). The underlying causes explain the broader context and
fundamental forces underpinning these local actions (Lambin et al., 2002). As a result,
underlying causes also tend to be complex and tend to operate more diffusely, often by altering
one or more (Lambin et al., 2002).
Figure 1: Proximate and Underlying causes of LULCC
Source: (Geist, H. J. and Lambin, E. F., 2002)
7|Page
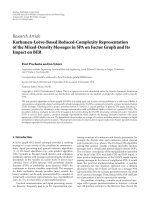
2.1.3 Land use/Land cover change in Ethiopia
Messay (2011), has examined the 88% of the country‘s population is located in the 45% of the
country‘s highland, with an altitude of greater than 1500m.Even though it is decreasing now
Ethiopia had huge diversity in biological resources: forest, woody, and grass lands, shrubs, and
varied wildlife.
Percentage of LULCC
Wetland
1%
Cultivation
19%
Woodland
26%
Water
1%
Natural Forest
4%
Bareland
14%
Grassland
12%
Highland bamboo
0%
Afro- alpine
0%
urban
2%
Shrubland
21%
Woodland
Grassland
Shrubland
Afro- alpine
Highland bamboo
urban
Bareland
Natural Forest
Water
Cultivation
Wetland
Figure 2: Percentage Distribution of LULC change in Ethiopia
8|Page
Source (Messay, 2011)
In addition to this, Daniel (2008), reported the heterogeneity of the changes, type, pattern,
direction, and magnitude of LULC in the country and have seen the difficulty of predict the
known trends to areas that have not been studied. Girma, (2003) also reported the decline of
natural forests and grazing lands due to conversions to croplands in southern Wello. On the
contrary (Woldeamlak et al., 2005) found the opposite i.e an increasing trend by 19 % from
1957-1982 and 27% from 1982 - 1998 in Chemoga watershed area. While (Zeleke et al., 2001)
reported a sharp decrease of forest cover in their respective study area in north western Ethiopia.
2.1.4. Application of Remote sensing and GIS for Land use/Land cover
Analysis
As Lillesand, et al. (2008), explained remote sensing is defined as the science of acquiring
information about an object through the analysis of data obtained by a device that is not in
contact with the object. The instruments used for measuring electromagnetic radiation are called
sensors. These sensors record the reflected radiation from the surface of the earth and will be
used for many analyses; one of these is land use land cover change analysis.
The image processing can broadly be categorized into: pre-processing, image classification or
segmentation, post processing and evaluation (Jensen, 2004). The most common pre-processing
techniques in RS data include radiometric and geometric correction, radiometric enhancement,
spatial enhancement, spectral enhancement, and fourier analysis (Jensen, 2004; Lilleesand et al.,
2004). Radiometric correction addresses variations in the pixel intensities (DNs) that are not
caused by the object or scene being scanned. This correction aimed to minimize variation due to
varying solar zenith angles and incident solar radiation. Several algorithms have been developed
to radiometric correction (Jensen, 2004). LULC mapping and subsequent quantitative change
9|Page