Extraction and characterization of chitin and chitosan from nigerian shrimps ISA 2012
Bạn đang xem bản rút gọn của tài liệu. Xem và tải ngay bản đầy đủ của tài liệu tại đây (572 KB, 8 trang )
Available online at o/index.php/ijbcs
Int. J. Biol. Chem. Sci. 6(1): 446-453, February 2012
ISSN 1991-8631
Original Paper
Extraction and characterization of chitin and chitosan from
Nigerian shrimps
M. T. ISA1*, A. O. AMEH 1, M. TIJJANI 1 and K. K. ADAMA2
1
2
Department of Chemical Engineering, Ahmadu Bello University, Zaria, Nigeria.
Physics Advanced Laboratory, Sheda Science and Technology Complex (SHESTCO), Abuja, Nigeria.
*
Corresponding author; E-mail: ,
ABSTRACT
Chitin was synthesized from Nigerian brown shrimps by a chemical process involving demineralization
and deproteinisation. Deacetylation of the chitin was conducted to obtain Chitosan. The chitin and chitosan
were characterized using FTIR, XRD and SEM. Proximate and elemental analysis were also conducted. The
percentage yield of chitin was 8.9%. The degree of deacetylation of chitin was found to be 50.64% which was a
low value compared to previous works and can be attributed to the low alkali concentration and heating time.
XRD patterns indicated that chitin was more crystalline than the corresponding chitosan. FTIR spectra
indicated the presence of functional groups associated with different bands, the intensities and stretching
established that the samples are chitin and chitosan. SEM analysis also indicated morphological differences
between the chitin and chitosan.
© 2012 International Formulae Group. All rights reserved.
Keywords: Deacetylation, biodegradable, characterization, deproteinisation, demineralization.
INTRODUCTION
Chitin is a white, hard, inelastic,
nitrogenous polysaccharide, available from
variety of sources which include, exoskeleton
of crustaceans, cell wall of certain fungi,
mushrooms, worms, diatoms, arthropods,
nematodes and insects, with shellfish waste
such as shrimps, crabs and crawfish being the
principal sources (Muzzarelli, 1997; Nessa et
al., 2010). Worldwide, chitin is the second
most abundant and most important natural
polysaccharide after cellulose. It is composed
of β (1→4)-linked 2-acetamido-2-deoxy-β-D-
© 2012 International Formulae Group. All rights reserved.
DOI : />
glucose (N-acetyl glucosamine (Dutta et al.,
2004; Rinaudo, 2006).
There are many derivatives of chitin,
these include, chitosan, N-acetyl chitosan,
monoacetyl chitin, dibutyrylchitin, chitosan
acetate, etc (Jacek et al., 1990). The main
derivative of chitin is chitosan a linear
polymer of α (1→4) linked 2-amino-2-deoxyβ-D-glucopyranose and is easily derived by
N-deacetylation, to a varying degree that is
characterized by the degree of deacetylation.
This is consequently a copolymer of N-acetyl
glucosamine and glucosamine (Dutta et al.,
2002; Aranaz et al., 2009).
M. T. ISA et al. / Int. J. Biol. Chem. Sci. 6(1): 446-453, 2012
and thermal processes (Khanafari, et al., 2008;
Abdou et al., 2008).
This work was aimed at the extraction
of chitin and converting it into chitosan. The
chitin is obtained from Nigerian brown shrimp
which is abundant in the coastal areas of the
country, with shells considered to constitute
waste and pollute environment and aquatic
life. Chemical method of extraction was
adopted because of its simplicity.
Chitin is estimated to be produced
annually almost as much as cellulose. It has
become of great interest not only as underutilized resource but also as a new functional
biomaterial of high potential in various fields
because of their unique biodegradability,
biocompatibility, physiological inertness, nontoxicity, adsorption and hydrophilicity.
Recently, progress of chitin chemistry has
been quite significant (Hudson et al., 1998;
Sashiwa and Aiba, 2004).
It has been reported that the potential
and usual areas of application of chitin,
chitosan and their derivatives are estimated to
be more than 200 (Kumar, 2000). Some of the
applications are in food processing, cosmetics,
biomedical, biocatalysis and waste water
treatment processes (Li et al., 1997; Bhavani
and Dutta, 1999; Sridhari and Dutta, 2000).
Chung et al. (2003) have shown that because
of the natural antibacterial and/or antifungal
characteristics, chitosan and its derivatives
have resulted in their use in commercial
disinfectant. Chu-his et al. (2001) treated
effluent waste water from textile and diary
industries and established that chitosan was a
better treatment (decolorization) option than
the activated carbon in use. Also chitosan
works efficiently for effluents with both low
and high pH values. These materials have also
found wide application in conventional
pharmaceutics as potential formulation
excipient. Their use in novel drug delivery as
mucoadhesive and as oral enhancer has also
been reported (Kalut, 2008).
The isolation of chitin from different
sources is affected by the source (Abdou et
al., 2008). In the creatures where chitin is
found, it is in different percentages depending
on the place where it is obtained (Muzzarelli,
1997). Various methods have been reported
for the extraction of chitin and converting it to
chitosan. These include chemical, biological
MATERIALS AND METHODS
Chitin extraction
Chitin was extracted from 200 g of the
shrimp shell by demineralising and
deproteinising of the solid material after size
reduction. Demineralization was carried out at
room temperature using 1 M hydrochloric
acid (HCl). Evolution of gas indicates the
mineral content of the specie. The treatment
was repeated several times until the evolution
of gas ceased with 3 liters of the prepared 1 M
HCl. The resulting shell was then washed with
distilled water up to neutrality, dried in an
oven at 60 oC until a constant weight was
obtained. Deproteinisation was carried out by
heating the shell at 100 oC in 1 M sodium
hydroxide solution.
The treatment was
repeated several times, the absence of colour
indicates the absence of protein a total of 1.5
liters of the solution was used. Washing with
distilled water was then carried out up to
neutrality and then dried at 60 oC until
constant weight was achieved to obtain chitin.
Deacetylation of chitin
Chitosan was obtained by the removal
of acetyl group (deacetylation) in the chitin
structure. This was achieved by steeping
(soaking) the chitin sample in strong sodium
hydroxide (40% w/w) solution for four days to
degrade the chitin. The sample was then
heated in a fresh alkaline solution at 100 oC
447
M. T. ISA et al. / Int. J. Biol. Chem. Sci. 6(1): 446-453, 2012
and at atmospheric pressure for 5 hrs to obtain
chitosan.
of the chitin and chitosan samples were also
established via Fourier transform infrared
spectroscopy
using
FTIR-8400S
spectrophotometer (Shimadzu) machine. The
morphology of the chitin and chitosan
samples were visualised using a scanning
electron microscope (JEOL 6400). The
samples were thinly coated with gold and
transferred to the sample holder and the
micrographs were taken.
Proximate analysis
Proximate analysis of the chitin and
chitosan was carried out to determine
moisture content, ash content, protein and
fibre content. The samples were dried to a
constant weight at 60 oC in an oven and the
weight loss gives the amount of moisture in
the samples. Samples were burned in a
furnace at temperature of 555 oC and weighed
to determine the ash content. The fibre and
protein content were determined by standard
method (AOAC, 1990).
RESULTS
Percentage composition of shell
After the demineralization and the
deproteinisation of the shrimp shells, the
percentage composition of the shells was
calculated. This is presented in Table 1.
Carbon/Nitrogen ratio determination
The organic carbon content analysis
was carried out in the nitrogen laboratory
Institute of Agricultural Research ( IAR
Ahmadu Bello University, Zaria) using the
Walkley-black method. The organic nitrogen
content was also determined using Kjekdahl
method. The carbon/nitrogen ratio will be
used in determining the degree of
deacetylation of the chitosan sample using the
Kasaai equation (Abdou et al., 2008)
DDA% =
Elemental analysis of chitosan
Table 2 presents the degree of
deacetylation calculated using Kasaai
“Equation (1)” after the deacetylation of the
chitin.
Proximate analysis of chitin and chitosan
Table 3 presents the results of the
proximate analysis of the chitin and chitosan.
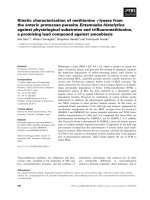
X-ray diffraction analysis of samples
Figures 1 presents the supper imposed
diffraction patterns of the chitin and chitosan
respectively.
............................. 1
Structural analysis
The X-ray diffraction of the samples
was conducted using PAN analytical X’ Pert
PRO MPD X-ray diffraction system
PW3040/60 machine. The prepared samples
were prepared and held on a sample holder
and beams of electron passed through. The
intensity was measured at Bragg’s 2θ angle.
The Crystallinity of the chitin and chitosan
samples was determined from X- ray
diffraction analysis. The structural differences
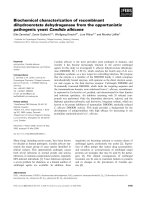
Morphology of chitin and chitosan
Figures 2 and 3 present the scanning
electron micrographs of the chitin and
chitosan.
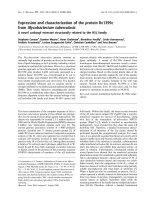
FTIR spectroscopy analysis
Figures 4 and 5 present the Fourier
transform infra red spectroscopy of the chitin
and chitosan samples.
448
M. T. ISA et al. / Int. J. Biol. Chem. Sci. 6(1): 446-453, 2012
Figure 1: Superimposed X-ray diffraction patterns of chitin (A) and chitosan (B).
Figure 2: Scanning electron micrograph of
chitin.
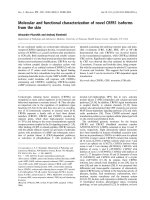
Figure 3: Scanning electron micrograph of
chitosan.
449
M. T. ISA et al. / Int. J. Biol. Chem. Sci. 6(1): 446-453, 2012
Figure 4: FTIR spectra of chitin.
Figure 5: FTIR spectra of chitosan.
Table 1: Shrimp shell composition.
Component
CaCO3
Protein
Chitin
% Composition
69.7
21.4
8.9
450
M. T. ISA et al. / Int. J. Biol. Chem. Sci. 6(1): 446-453, 2012
Table 2: Nitrogen and Carbon content analysis of chitosan.
Nitrogen (%)
2.71
Carbon (%)
16.23
Carbon/nitrogen ratio
5.989
Degree of Deacetylation (%)
50.64
Table 3: Proximate analysis of chitin and chitosan.
Material
Chitin
Moisture (%)
9.40
Ash (%)
3.83
Protein (%)
10.50
Fibre (%)
4.10
Chitosan
5.24
6.41
6.16
8.74
obtained after deacetylation of the chitin was
partially soluble in dilute acetic acid, as DDA
of 60% was expected for complete solubility
in dilute acetic acid. However, 100%
solubility was obtained in concentrated acetic
acid.
As indicated in Table 3, the moisture
content of chitin was found to be higher than
the corresponding chitosan which was
expected since water was removed from the
chitin prior to the production of chitosan.
Ash content of chitin was lower than
that of chitosan this could be attributed to the
presence of the acetyl group in the chitin
sample. It is worth noting that ash is the
inorganic residue remaining after water and
organic matter have been removed from a
sample.
Protein content of the chitosan sample
was considered high after deproteinisation of
the chitn and this could be attributed to the
low degree of deacetylation of the chitin.
It was also found that the fibre content
of the chitosan was higher than that of chitin,
probably the removal of more matter from the
chitin to get chitosan could have led to the
presence of more fibre in the chitosan than
chitin.
DISCUSSION
Percentage composition of shell
The shrimp was found to contain low
amount of chitin, 8.9% (Table 1) compared to
21.53 % recorded by Abdou et al. (2008), this
may be attributed to the mineral composition
of the area as composition varies with the area
of the retrieved source. As mentioned earlier,
the isolation of chitin from different sources is
affected by the source (Abdou et al., 2008),
also in the creatures where chitin is found, it is
in different percentages depending on the
place (Muzzarelli, 1997).
Elemental analysis of chitosan
As indicated in Table 2 the chitosan
produced contains high amount of organic
carbon but with low organic nitrogen content.
This result was used to determine the degree
of deacetylation (DDA). The degree of
deacetylation was approximately 51% which
is considered low compared to previously
reported work where DDA of 87-97% was
achieved at different deacetylation conditions
(Abdou et al., 2008) and 98.38-98.79%
achieved by Kalut (2008). The low DDA in
this work could be attributed to the conditions
(alkali concentration, pressure and non
pulverisation of chitin) used for the
deacetylation. Extended heating time and high
alkali concentration can be applied to
drastically
improve
the
degree
of
deacetylation. The results also confirm that
low carbon/nitrogen ratio yields higher degree
of deacetylation which is desired. The product
X-ray diffraction analysis of samples
The most intense peak height for the
chitin sample was recorded at 2θ = 20o with a
spacing of 4.25946 Å as shown in Figure 1
(A). A decrease in peak and increase in
broadness is observed for chitosan sample in
451
M. T. ISA et al. / Int. J. Biol. Chem. Sci. 6(1): 446-453, 2012
Figure 1(B). The broad peaks indicate lower
crystallinity; this is to say that chitin is more
crystalline than chitosan, which is similar to
the observation reported in literature (AlSagheer et al., 2009).
(chitosan) obtained from the deacetylation of
chitin was established through the use of
FTIR, SEM and XRD. The XRD analysis
indicated that the chitin was more crystalline
than the chitosan.
Further work can be done to improve
on the degree of deacetylation probably
through size reduction of the chitin, increase
in concentrations of the reagents, reaction
time and increase in temperature of
deacetylation as suggested by literature.
Morphology of chitin and chitosan
The scanning electron micrographs of
the chitin and chitosan revealed that chitin has
a smoother surface than chitosan as can be
seen in Figures 2 and 3. The rough surface of
the chitosan is attributed to the low degree of
deacetylation (Abdel-Fattah et al., 2007). The
chitosan showed prominent sheath-like layers
than the chitin, this could probably be as result
of deacetylation of the chitin which removes
some bonding agents and exposing more
sheaths in the chitosan.
REFERENCES
Abdel- Fattah WI, Jiang T, El-Bassyouni GE,
Laureuci
CT.
2007.
Synthesis,
characterization
of
chitosans
and
fabrication
of
sintered
chitosan
microsphere matrices for bone tissue
engineering. Acta Biomaterial, 3(4): 503514.
Abdou ES, Nagy KSA, Elsabee MZ. 2008.
Extraction and characterization of chitin
and chitosan from local sources.
Biresources Technology, 99: 1359-1367.
Al- Sagheer FA, Al- Sughayer MA, Muslim
S, Elsabee MZ. 2009. Extraction and
characterization of chitin and chitosan
from marine sources in Arabian Gulf.
Carbohydrate Polymers, 77(2): 410-419.
AOAC. 1990. Official Methods of Analysis
(15th edn). Association of Official
Analytical Chemists: Washington, DC,
1990
Aranaz I, Mengibar M, Harris R, Panos I,
Miralles B, Acota N, Galed G, Heras A.
2009. Functional characterization of
chitin and chitosan. Current Chemical
Biology, 3: 203-230.
Bhavani KD, Dutta PK. 1999. Physicochemical adsorption properties on
chitosan for dye house effluent. Am.
Dyestuff. Rep., 88: 53.
Bordi F, Cametti C, Paradossi G. 1999.
Dielectric behaviour of polyelectrolyte
solutions: the role of proton fluctuations.
J. Phy. Chem., 95: 4883-4889.
Chung YC, Wang HL, Chen YM, Li SL.
2003. Effect of abiotic factors on the
FTIR spectroscopy analysis
From Figure 4, the chitin showed peak
at 1551.78 cm-1 which corresponds to the N-H
deformation of amide II. The band at 1652.09
cm-1 corresponds to the amide I stretching of
C = O. The band at 1393.62 cm-1 corresponds
to a symmetrical deformation of the CH3
group (Duarte et al., 2001; Ravindra et al.,
1998).
The spectra of Figure 5 correspond to
the deacetylated sample with NaOH. Note that
for chitosan, the band at 1551.78 cm-1 has a
bit larger intensity than at 1652.09 cm-1,
which suggests some degree of deacetylation
of the chitin. When chitin deacetylation
occurs, the band observed at 1652.09 cm-1
decreases, while a growth at 1551.78 cm-1
occurs, indicating the prevalence of NH2
groups (Bordi et al., 1991).
Conclusion
Chitin was extracted from Nigerian
brown shrimp. The deacetylation of the
obtained chitin was conducted using chemical
method. It was found that the shrimp had
8.8% of chitin, and the degree of deacetylation
was 50.64%.
The difference in structure and surface
morphology of the chitin and product
452
M. T. ISA et al. / Int. J. Biol. Chem. Sci. 6(1): 446-453, 2012
antibacterial activity of chitosan against
water borne pathogens. Bioresources
Techonology, 88: 179-184.
Chu-shi H, Jui-lien H, Rong-huei C. 2008.
Wastewater treatment with chitosan.
available at www. Edoc.ypu.edu.tw:
8080/paper/HMST/2008. Accessed May
2011.
Duarte ML, Ferreira MC, Marvao MR, Rocha
J. 2001. Determination of the degree of
actylation of chitin materials 13C
CP/MAS NMR spectroscopy. Int. Biol.
Mac. Mol., 28: 359-363.
Dutta PK, Ravikumar MNV, Dutta J. 2002.
Chitin and chitosan for versatile
applications. JMS Polym. Rev., C42: 307.
Dutta PK, Dutta J, Tripathi VS. 2004. Chitin
and chitosan: Chemistry, properties and
applications. J. Sc. Ind. Res., 63: 20-31.
Hudson SM, Smith C. 1998. Polysaccharide:
Chitin and chitosan: chemistry and
technology of their use as structural
materials. In Biopolymer from Renewable
Resources, Kaplan DL (ed). SpringerVerlag: New York, 96-118.
Jacek D, Lidia S, Magdalena K, Luba J,
Ryszard C. 1990. Structure – Bioactivity
relationship of chitin derivatives –Part I:
The effect of solid chitin derivatives on
blood coagulation. J. Bioactive Polymers,
5(3): 293-304.
Kalut SA. 2008. Enhancement of degree of
deacetylation of chitin in chitosan
production. B. Chemical Engineering,
Universiti Malaysia Pahang, 2.
Khanafari A, Marandi R, Sanatei S. 2008.
Recovery of chitin and chitosan from
shrimp waste by chemical and microbial
method. Iran. J. Environ. Health Sci.
Eng., 5( 1): 19-24.
Kumar MNVR. 2000. A review of chitin and
chitosan applications. React Funct
Polym., 46: 1-27.
Li Q, Dunn ET, Grandmaison EW, Goosen
MFA. 1997. Applications and properties
of chitosan. In Applications of chitin and
chitosan, Goosen MFA (ed). Technomic
Publishing Company: Lancaster; 3-29.
Muzzarelli RAA. 1997. Some modified
chitosan and their niche applications. In
Chitin Handbook, Muzzarelli RAA, Peter
MG (eds). European Chitin Society: Italy,
47-52.
Nessa F, Shah MM, Asaduzzaman M, Roy
SK, Hossain MM, Jahan MS. 2010. A
process for the preparation of chitin and
chitosan from prawn shell waste.
Bangladesh J. Sci. Ind. Res., 45(4): 323330.
Ravindra R, Krovvidi KR, Khan AA. 1998.
Solubility parameter of chitin and
chitosan. Carbohydrate Polymers., 55:
17-22.
Rinaudo M. 2006. Chitin and chitosan. Prog.
Polym..,31: 603-632.
Sashiwa H, Aiba SI. 2004. Chemically
modified chitin and chitosan as
biomaterials. Prog. Polym. Sci., 29: 887908.
Sridhari TR, Dutta PK. 2000. Synthesis and
characterization of maleilated chitosan for
dye house effluent. Indian J. Chem.
Tech., 7: 198.
453