Day 3 5 real time treatment analyses
Bạn đang xem bản rút gọn của tài liệu. Xem và tải ngay bản đầy đủ của tài liệu tại đây (991.33 KB, 11 trang )
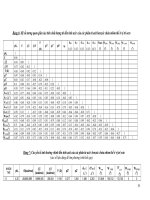
Fracturing treatment design process
Problem well
identification
Fluid
selection
Treatment
selection
Treatment
design
Operational
constraints
Treatment
result
prediction
Operational
stimulation
program
Scheduling
and
logistics
Site
preparation
Proppant
selection
Evaluation cycle
Job execution
1
Real Time Pressure Analysis
¥ Nolte Fracture growth Analysis
Ð Log‐log diagnos>c plot
2
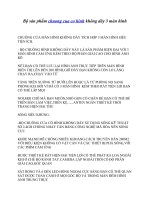
Model comparison
KGD model
PKN model
¥ High and short fractures
¥ Rectangular
¥ Decreasing Net pressure
¥ Long and shallow fractures
¥ Ellip>cal
¥ Increasing Net Pressure
1/4
21μq E’3
ΔP = Pnet,w=
64πhfL2
1/4
16μq E’3 L
ΔP = Pnet,w=
πh
f
Low Fluid leakoff
1/6
E’q3
L(t)= 0.38
μhf
3
t2/3
1/6
μq3
ww= 1.48
E’hf3
t1/3
1/5
E’q3
L(t)= 0.39
μhf4
1/5
t4/5 ww= 2.18
μq2
E’hf
High Fluid leakoff
L(t)=
q t1/2
2πCLhf
t1/5
1/4
μq2
ww= 4 3
π E’CLhf
t1/8
Model comparison
KGD model
PKN model
¥ High and short fractures
¥ Rectangular
¥ Decreasing Net pressure
¥ Long and shallow fractures
¥ Ellip>cal
¥ Increasing Net Pressure
c
1/4
ΔP = Pnet,w= L 1/2
1/6
E’q3
L(t)= 0.38
μhf3
ΔP =
t2/3
L
ΔP = Pnet,w= c
Low Fluid leakoff
1/5
E’q3
L(t)= 0.39
μhf4
c
High Fluid leakoff
t⅓
q t1/2
L(t)=
2πCLhf
ΔP = c t⅕
t4/5
ΔP = c t⅛
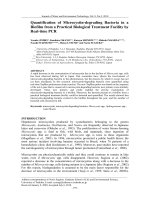
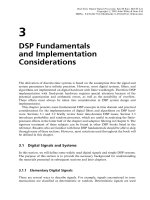
Log‐Log fracture pressure diagnos>c plot
Net Pressure, psi
1000
m=0
Stable height
growth
m= 1
Restricted height
growth
m>1
Near well
restriction
m=1/8 to 1/5
contained height
100
m<1
Rapid or unstable
height growth
1
10
Pumping >me, min
100
Methods to evaluate fracture
geometry
Source Cipolla and Wright 2000
6
What Happened?
7
What Happened (frac&pack
8
What Happened
9
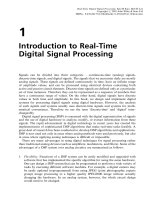
What Happened
KW‐7 main job
100
8000
90
80
6000
70
5000
60
50
4000
40
3000
30
Pump rate (bpm) & prop conc (ppg)
Pressure (psi)
7000
2000
20
1000
10
0
0
0
500
1000
1500
2000
2500
3000
3500
4000
:me (s)
10
What Happened
11