Source water quality for aquaculture
Bạn đang xem bản rút gọn của tài liệu. Xem và tải ngay bản đầy đủ của tài liệu tại đây (4.55 MB, 76 trang )
AND SOCIALLY
DEVELOPPMENT
R/t/)t!Iff)c/9/R'/Dopmeit
LJ"U)
23764
Work in progress
for public discussion
March 1999
Source Water Quality
for Aquaculture
Public Disclosure Authorized
Public Disclosure Authorized
ENVIRONMENTALLY
SUSTAINABLE
Public Disclosure Authorized
A Guidlefor Assessment
HO
-
..-o
-
~~~-~A
- ~ ,,!
~
[.
~
-R
--
U
3
i
D. Z
-
V
Joh)//// 1). l1forlto/
A,I.I,/ Al Steawart
'-
-
4 _r
_
_
-t
Public Disclosure Authorized
I
~
-
1
- -
ENVIRONMENTALLY AND SOCIALLY
SUSTAINABLE
DEVELOPMENT
Rural Development
Source Water Quality
for Aquaculture
A GuideforAssessment
RonaldD. Zweig
John D. Morton
MaolM. Stewart
Thk World Bnmk
WahiMngton, D.C.
Copyright 0 1999
The International Bank for Reconstruction
and Development/THE WORLD BANK
1818 H Street, N.W.
Washington, D.C. 20433, U.S.A.
All rights reserved
Manufactured in the United States of America
First printing March 1999
This report has been prepared by the staff of the World Bank. The judgments expressed do not
necessarily reflect the views of the Board of Executive Directors or of the governments they represent.
The material in this publication is copyrighted. The World Bank encourages dissemination of its work
and will normally grant permission promptly.
Permission to photocopy items for internal or personal use, for the internal or personal use of specific
clients, or for educational classroom use, is granted by the World Bank, provided that the appropriate fee
is paid directly to Copyright Clearance Center, Inc., 222 Rosewood Drive, Danvers, MA 01923, U.S.A.,
telephone 978-750-8400, fax 978-750-4470. Please contact the Copyright Clearance Center before
photocopying items.
For permission to reprint individual articles or chapters, please fax your request with complete
infornation to the Republication Department, Copyright Clearance Center, fax 978-750-4470.
All other queries on rights and licenses should be addressed to the World Bank at the address above or
faxed to 202-522-2422.
Photographs by Ronald Zweig. Clockwise from top right: (1) Marine fish culture in floating cages surrounded by shellfish and seaweed culture (suspended from buoys in background), which feeds on
released fish wastes. Sea cucumbers stocked beneath the cages feed on the settled fish wastes. Weihai
Municipality, Shandong Province, China. (2) Pump house brings water from Bay of Bengal to Banapada
Shrimp Farm, Orissa, India. (3) Day-old carp hatchlings are released to a nursery cage in a fish hatchery
pond prior to sale to stock fish production farms. Yixing, Jiangsu Province, China.
Ronald D. Zweig is senior aquaculturist in the East Asia and the Pacific Rural Development and Natural
Resources Sector Unit of the World Bank. John D. Morton is a Ph.D. candidate in environmental and water
resource engineering at the University of Michigan. Macol M. Stewart is an international development
analyst in the Office of Global Programs in the US. National Oceanic and Atmospheric Administration.
library of Congress Cataloging-in-Publication Data
Zweig, Ronald D., 1947Source water quality for aquaculture: a guide for assessment / Ronald
D. Zweig, John D. Morton, Macol M. Stewart.
p. cm. - (Environmentally and socially sustainable
development. Rural development)
Includes bibliographical references (p. ) and index.
ISBN 0-8213-4319-X
1. Fishes-Effect of water quality on. 2. Shellfish-Effect of
water quality on. 3. Water quality-Measurement. I. Morton, John
D., 1968- . II. Stewart, Macol M., 1968- . III. Title.
IV.Series: Environmentally and socially sustainable development
series. Rural development.
IN PROCESS 1998
639.3-dc2l
9841429
CIP
I
The text and the cover are printed on recycled paper, with a flood aqueous coating on the cover.
Contents
Foreword
v
Abstract
vii
Acknowledgments
viii
Abbreviations and Acronyms
ix
x
Glossary
Chapter 1
Assessing Source Water Quality
1
Choice of Source Water
1
Source Water Quality Issues
1
Guidelines for Evaluating Source Water Quality
Chapter 2
Phase I: Physio-chemical Water Quality Parameters
6
Basic Factors
Other Critical Factors
Chapter 3
Phase II: Anthropogenic and Biological Water Quality Parameters
Phase III: Field Study
42
Study Design 42
Criteria for Fish Growth and Health
42
Criteria for Contaminant Residues 43
Appendix Tables
Notes
6
18
Metals
22
31
Metalloids
Organic Compounds
33
Pathogens and Biological Contaminants
Chapter 4
3
44
53
Bibliography and Related Sources
Species Index
61
55
39
22
iv
Source Water Qualityfor Aquaculture: A Guide for Assessment
Boxes
1.1 Bioaccumulation
5
3.1 Protecting aquaculture ponds from pesticides
37
Figure
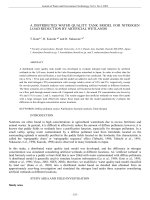
1.1 Analytical process for evaluating source water quality for aquaculture
4
Tables
1.1
2.1
2.2
2.3
2.4
2.5
2.6
2.7
2.8
2.9
2.10
2.11
2.12
2.13
2.14
2.15
3.1
3.2
3.3
3.4
3.5
Advantages and disadvantages of common water sources 2
General temperature guidelines
6
Optimal rearing temperatures for selected species
7
Turbidity tolerance levels for aquaculture
8
Optimal salinities for selected species and general guidelines
9
Alkalinity tolerance levels for aquaculture
10
pH tolerance levels and effect for aquaculture
11
Hardness tolerance levels for aquaculture
11
Optimal ranges for total hardness
12
Recommended levels of dissolved oxygen for aquaculture
13
Carbon dioxide tolerance levels for aquaculture
15
Factors affecting the toxicity of ammonia to fish 16
Ammonia tolerances for aquaculture
17
Optimal nitrite concentrations for aquaculture
18
Optimal nitrate concentrations for aquaculture
18
Optimal mud characteristics for aquaculture
20
Maximum cadmium concentrations for aquaculture
26
Maximum lead concentrations for aquaculture
27
Maximum copper concentrations for production of salmonid fish 28
Maximum chromium concentrations for aquaculture
29
Maximum zinc concentrations for aquaculture recommended
by the European Union
31
3.6 Persistence of pesticides
35
3.7 Toxicity to aquatic life of selected chlorinated hydrocarbon insecticides
35
3.8 Pesticide solubility & experimentally derived bioaccumulation factors in fish
36
Appendix Tables
1 Effect of biological processes on alkalinity
44
2 Relative abundance categories of soil chemical variables in brackish
water ponds 45
3 Relative abundance categories of soil chemical variables in freshwater ponds
4 Selected biomarkers proposed in study of environmental and/or toxicological
responses in fish 47
5 Provisional tolerable weekly intake for selected elements
48
6 Import standards for contaminant residues in fish and shellfish 49
7 Import bacteriological standards for fish and shellfish 51
46
Foreword
T
he United Nations Food and Agriculture
velopment and growth of fish and shellfish. It
Organization (FAO) reports that most
species subject to capture fishing are
overexploited and that the potential for increasing yields in the long term is extremely
limited. Aquaculture is an attractive alternative to capture fisheries due to its potential for
production expansion, effective use of processing facilities, and adaptability of productionto-market requirements. Facing the leveling of
production of capture fisheries, aquaculture,
has grown in production at an average annual
rate of over 11 percent during 1990-94 according to FAO-reported trends. With this growth
the World Bank has become increasingly involved in assisting and financing aquaculture
project requests from member governments.
This report is thus meant to help private and
public sectors and lending institutions determine whether the water quality at a proposed
aquaculture development site is acceptable.
The need for such a guide has become important and necessary with the continued degration of water resources from increases in
industrial and municipal wasterwater discharges and agro-chemical use.
Water is the most important input for
aquaculture and thus a key element in the
success of these projects. Source water should
be selected based on its suitability for efficient
production of high-quality aquaculture product(s). Poor water quality may impair the de-
may also degrade the quality of the product
by tainting the flavor or by causing accumulation of high enough concentrations of toxic
substances to endanger human health. The
importance of water quality along with the
growth of the World Bank's involvement in
aquaculture projects has created a need of a
guide for determining the suitability of
source waters proposed for use in these projects. It is the goal of this report to provide
information useful to this end.
This report reviews the quality standards
for water and fish product, looks at the parameters of greatest importance to aquaculture, and discusses the scientific basis for these
standards. It can provide government officials, field technicians, and task managers with
necessary information to make informed judgments. The report also contains practical, stepby-step guidelines for use by task managers in
determining whether the quality of the proposed source water will present a significant
risk to the success of a project. The prescribed
procedures would be of importance to site
selection for any considered aquaculture enterprise and would also be of use to governments involved in formulating inland and
coastal zone development/management plans
that would include assessment of appropriate areas for the establishment of aquaculture
facilities.
v
vi
Source Water Qualityfor Aquaculture: A Guidefor Assessment
The information provided here is limited to
that currently available in the literature and
from government standards and thus is not
exhaustive with regard to all species cultured
and all aquacultural production systems in use.
There are plans to revise this report about
every two years to keep it current with the new
information being generated on the topic and
also to make it available electronically on the
World Bank's website (www.worldbank.org).
Alexander McCalla
Director
Rural Development
Abstract
organisms (mostly finfish and crustaceans) and
upon the consumer due to the presence and/or
bioaccumulation of toxins and pathogens that
can be present in water. The current state of
knowledge on the acceptable limits of hazardous chemicals and pathogens in water used for
fisheries and aquaculture and the acceptable
concentrations accumulated in the tissue of
aquaculture products are also furnished. These
standards vary somewhat among countries.
The report also suggests a step-by-step process for evaluating source water quality for
aquaculture that minimizes cost to the degree
possible.
!T'lhe report provides guidance on how to
assess the suitability of source water for
aquaculture. Aquaculture development
worldwide is growing rapidly due to increasing
demands for its products and limited production
potential from inland and marine capture fisheries. The report reviews the different sources of
water that are or can be used for aquaculture and
provides the current standards on acceptable
physio-chemical, anthropogenic pollutant, and
biological factors that affect the quality of source
water. It provides the available knowledge from
a literature review on these factors and the potential impact on the health of various cultured
vii
Acknowledgments
he authors want to express their sincere
appreciation to Claude Boyd, Netty
Buras, Hakon Kryvi, Carl Gustav Lundin,
Khalil H. Mancy, Roger Pullin, and Heinrich
Unger, who provided technical and editorial
comments on the text; to the World Bank Rural Sector Board and Summer Intern Program
and to Maritta Koch-Weser and Geoffrey Fox
for their support of the report's preparation;
to the staff of the World Bank Sectoral Library for the provision of reference materials;
to Ken Adson, Uwe Barg, Gaboury Benoit,
Meryl Broussard, and James McVey for references and guidance in the text preparation;
to Eileen McVey from the Aquaculture Collection,tNationaleAgriculture Library; toBGertVan
Santen as co-leader of the World Bank Fisheries
and Aquaculture Thematic Group for his support and endorsement of the document's concept and importance; to Maria Gabitan and
Sunita Vanjani for their administrative assistance in managing the report's preparation; to
EmilyFeltforprovidingimportstandards;and
to Sheldon Lippman, Virginia Hitchcock, and
Alicia Hetzner, whose editorial contributions
much improved the presentation and clarity of
thetext.GaudencioDizondesktoppedthisvolume.
viii
Abbreviations and Acronyms
Ag
Al
As
ASP
BCF
BOD
CaCO3
Cd
CFU
Cl
CN
COD
CO2
Cr
Cu
DO
DSP
DDT
EU
FAO
Fe
HCN
H2S
Hg
Silver
Aluminum
Arsenic
Amnesiac shellfish poisoning
Bioconcentration factors
Biological oxygen demand
Calcium carbonate
Cadmium
Colony forming units
Chlorine
Cyanide
Chemical oxygen demand
Carbon dioxide
Chromium
Copper
Dissolved oxygen
Diarrhetic shellfish poisoning
Dichloro-diphenyl-trichloro-ethane
European Union
United Nations Food and
Agriculture Organization
Iron
Hydrogen cyanide
Hydrogen sulfide
Mercury
HOCI
KMnO 4
LCSO
mg 1-'
Mn
MPN
N2
Ni
NSP
Pb
PCB
ppb
PSP
PTWI
Se
Sn
TAN
TBT
TCDD
TGP
USEPA
WHO
Zn
%.
ix
Hypochlorous acid
Potassium permanganate
Lethal count level (50 years)
Milligrams per liter
Manganese
Most probable number
Nitrogen gas
Nickel
Neurotoxic shellfish poisoning
Lead
Polychlorinated biphenyls
Parts per billion
Paralytic shellfish poisoning
Provisional tolerable weekly intake
Selenium
Tin
Total amnmonia nitrogen
Tributyl tin
Tetrachloro dioxin
Total gas pressure
United States Environmental
Protection Agency
World Health Organization
Zinc
Parts per thousand
Glossary
Actinomycetes: Any of an order (Actinomycetales) of filamentous or rod-shaped bacteria,
including the actinomyces (soil-inhabiting saprophytes and disease-producing parasites) and
streptomyces.
Anthropogenic pollutants: Pollutants which
come from human sources such as emissions
from an industrial plant or pesticide emissions
from agriculture. These pollutants are referred
to as anthropogenic because they typically are
associated with human activity. However, it is
possible for some of them to come from natural
sources.
Benthos: organisms that live on or in the bottom
of bodies of water.
Bioaccumulation factor (BCF): A measure of the
extent to which a compound bioaccumulates in
an aquatic species. It is calculated as (concentration of the compound in the body tissue) divided by (concentration of the compound in the
water).
Biological oxygen demand (BOD): The amount
of dissolved oxygen used up by microorganisms in the biochemical oxidation of organic
matter. Five-day BOD (BOD5) is the amount of
dissolved oxygen consumed by microorganisms in the biochemical oxidation of organic
matter over a 5-day period at 20 0C.
Cations: The ion in an electrolyzed solution that
migrates to the cathode: a positively charged ion.
Chelating Agents: A compound that combines
with a metal.
Chloracne: An eruption/inflammation of the skin
resulting from exposure to chlorine.
Colony forming units: A measure of bacterial
numbers which is determined by growing the
bacteria and counting the resulting colonies.
Detritus: loose material (as rock fragments or organic particles) that results directly from disintegration.
Divalent: Having a valence (combining power at
atomic level) of two [e.g., Calcium (Ca +)].
Hypoxia: Acute oxygen deficiency to tissues.
Ligands: A group, ion, or molecule coordinated to
a central atom or molecule at a complex.
Most probable number A measure of bacterial
numbers in which the bacteria are serially diluted and grown. By identifying the dilution
samples in which the bacteria grow, the number
of bacteria in the original samples can be determined.
Necrosis: Localized death of living tissue.
Osmoregulation: The biological process of maintaining the proper salt concentration in body
tissues to support life.
Parenchymatous: related to the essential and distinctive tissue of an organ or an abnormal
growth as distinguished from it supportive
framework.
Physio-chemical properties of water The basic
physical and chemical properties of water induding salinity, pH etc. Note this does not include
concentrations of anthropogenic pollutants.
Redox: Of or relating to oxidation- reduction.
Tainting or Off-flavor When certain pollutants
such as petroleum hydrocarbons accumulate in
fish or shellfish to a level at which the flavor is
affected. This makes the product undesirable
for human consumption.
Zeolites: Any of various hydrous silicates that are
analogous in composition to the feldspars, occur as secondary minerals in cavities of lavas,
and can act as ion exchangers used fro water
softening and as absorbents, and catalysts.
x
CHAPTER 1
Assessing Source Water Quality
W
ater is the most important element
has become common in industrialized nations,
for aquaculture. Selection of source
water should be based on its suitability for efficient production of a high quality
aquaculture product. Poor water quality may
affect fish and shellfish health through impairment of development and growth or may degrade the quality of the product by tainting its
flavor or by causing accumulation of high concentrations of toxic substances which could endanger human health. The importance of water
quality has created a need for guidelines for
determining the suitability of source waters
proposed for use in these projects.
a trend threatening the industrializing countries of Asia.
For aquaculture in salt or brackish water,
preference is for source water that is away from
any generator of pollution, such as industries,
tainted river mouths, or agricultural areas. This
water is less susceptible to fluctuations in salinity and other chemical properties and is less
likely to be contaminated by coastal discharges
(Lawson 1995, 52). The most common advantages and disadvantages of each type of source
are shown in table 1.1.
Source Water Quality Issues
Choice of Source Water
Once potential source waters are identified, it
is imperative to insure the water quality is suitable for aquaculture. Poor water quality may
cause project failure by producing a product
either in insufficient quantity or unmarketable
size or quality. Water quality can cause death,
disease, or poor growth in fish and shellfish.
In addition, poor water quality can contaminate the product with compounds dangerous
to human health.
The first step is identification of the most promising source water by carefully considering the
advantages and disadvantages of different
types of water sources. Water sources fall into
roughly nine categories: marine/coastal, estuaries, rivers/streams, lakes, surface runoff,
springs, wells, wastewater, and municipal
water.
In general, for fresh water aquaculture,
groundwater sources (springs and wells) are
preferred. They maintain a constant temperature, are free of biological nuisances such as
fish eggs, parasites and larvae of predatory insects and are usually less contaminated than
surface water sources. Ground water has traditionally been less contaminated than surface
water. Contamination of ground water sources
Fish and Shellfish Health
Fish and shellfish health is very sensitive to
water quality. Water quality criteria are based
on studies of growth, behavior, and health of
different species in various waters. One set of
parameters which affect fish and shellfish are
1
2
Source Water Qualityfor Aquaculture: A Guide for Assessment
Table 1.1 Advantages and disadvantages of common water sources
Source
Advantage
Disadvantage
Marine/coastal
Constant temperature
High alkalinity
May contain contaminants
May require pumping
Estuarine
May be readily available
Inexpensive
May contain contaminants
May be subject to large fluctuations intemperature
River/stream
May be readily available
Inexpensive
Pumping costs lower than wells
Typically requires pumping
Often have high silt loads
Can contain biological nuisances such as parasites and larvae
of predatory insects
May contain contaminants
May contain excessive nutrient concentrations
Have seasonal and possibly diumal fluctuations in flow,
temperature, and chemistry
Lake
May be readily available
Inexpensive
Pumping costs lower than wells
Similar to river/stream, but chemistry is more stable due to the
buffering effect of the large water volume
Bottom water may be anoxic in summer and contain
reduced iron
Surface runoff
Inexpensive
May contain contaminants
Unreliable
Requires 5-7 acres of watershed per surface acre of
aquaculture water
Spring
Constant temperature
May not require pumps
Usually less polluted (see note)
Free of biological nuisances such as parasites
and larvae of predatory insects
Inexpensive
Typically lacking oxygen and thus needs aeration
Yield and reliability may be questionable
May contain dissolved gases
May contain high iron concentrations or reduced iron
May contain high hardness
Well
Constant temperature
Usually less polluted (see note)
Typically lacking oxygen and thus needs aeration
Unless artesian, requires pumps which can be costly
May contain dissolved gases
May contain high iron concentrations or reduced iron
Possible aquifer depletion
Municipal
High quality
Expensive
Typically have disinfecting chemicals which are poisonous to
fish and expensive to remove
Wastewater
Inexpensive
Medium to high pathogen concentrations
May contain contaminants
Note: Although ground water has traditionally been less contaminated than surface water, contaminabon of ground water sources has become common in
industrialized natons. A similar trend may be likely for newly industrializing countries of Asia.
Source: Swann 1993 and Lawson 1995.
the basic characteristics of natural water otherwise referred to as its physio-chemical properties. These include properties such as turbidity,
pH, and dissolved oxygen. For many of these
properties, fish have a limited range in which
they can grow optimally. Hence, screening the
source water in respect to its physio-chemical
properties is an important initial step in assessing the source-water suitability to fish health.
Fish health can also be affected by pollutants
typical of anthropogenic (as a result of human
activity) discharges such as petroleum hydrocarbons, metals and pesticides. It is possible for
these discharges to also come from natural
causes. These pollutants can cause deleterious
behavioral and reproductive changes in fish
and shellfish even at very low concentrations.
To ensure good fish and shellfish health, source
Assessing Source Water Quality
water must also be screened using water quality criteria for these chemicals.
Product Quality and Human Health
The quality of the aquaculture product and its
suitability for human consumption may also
be affected by water quality. Even if culture
species are able to grow and thrive in a given
source water, low levels of pollutants may
cause the aquaculture products to be contaminated or have off-flavor. Off-flavor or tainting
occurs when certain pollutants such as petroleum hydrocarbons or metals accumulate in
fish or shellfish to a level at which the flavor
is affected, making the product undesirable for
human consumption.
The process by which pollutants concentrate
in seafood is called bioaccumulation (box 1.1,
p. 6). Many pollutants, especially those which
are fat soluble, collect in the tissues of aquatic
animals. This process results in higher concentrations of pollutants in body tissues of aquatic
organisms than in the surrounding water.
Accumulation of contaminants in fish and
shellfish is of great concern to the aquaculture
industry. Consumers are highly sensitive to the
quality of food products and any potential
health risks. Media reports of contamination of
seafood can seriously affect consumer perception, marketing, and production of all kinds of
fisheries products. In addition, rejection of
aquaculture products which fail to meet import
quality standards may have serious long-term
implications for the exporting country and producers.
Quality standards established by national
governments are the means by which humans
are protected from contaminated seafood. International and domestic commerce is regulated to prevent contaminated fish and
shellfish from reaching the market. Thus meeting these standards are an important goal for
the products of a successful aquaculture project from both an economic and public health
perspective. Such water quality standards can
be incorporated into a water quality assessment. In cases where bioaccumulation is sus-
3
pected, tests can be done by preparing a pilot
study in which fish are grown in the source
water and subsequently tested for contaminant
concentrations in body tissue.
Guidelines for Evaluating Source
Water Quality
In evaluating the suitability of the quality of
source water for new, improved, or expanded
aquaculture developments, a three-phased
screening process is recommended. For water
quality analysis it is recommended that those
methods defined in Standard Methods for Examination of Water and Wastewater (APHA
1995) be followed which for many factors
would require an expert water quality analysis
laboratory to do the assays. It is also important
to note that the water quality suitable for hatchery, nursery, and grow-out systems for a particular species vary to some degree and are
discussed in the text with the information
available for each type.
For Phase I as illustrated in figure 1.1, the
water quality criteria for the basic physiochemical properties necessary to sustain the
cultured organisms will be compared to measurements made on the source water. This will
provide a simple means of screening the source
water without going through the more expensive tests for anthropogenic pollutants. Accordingly, if anthropomorphic pollution or
naturally occurring toxins (for example, arsenic, toxic algae) are not suspected and Phase I
criteria are met, the source water can be considered acceptable. If Phase I criteria are not
met in this circumstance, a Phase III field trial
can be pursued. If the Phase III trial cannot be
conducted, the water should either be rejected
or accepted if a technically feasible and cost
effective water treatment is identified and
tested, bringing the source water within acceptable Phase I criteria.
Phase II is designed to screen for criteria on
anthropogenic pollutants in source water and
would be conducted after the source water has
been tested and met the Phase I criteria. In
addition, biological contaminants such as algal
4
Source Water Qualityfor Aquaculture: A Guide for Assessment
Figure 1.1 Analytical process for evaluating source water quality for aquacuiture
Qualitative Sit
Assessment
PHASE 1:
Physlco-Chemlcal
Water Quality
1No
1:
Physlco-Chemlcal
Water Quality
isPHASE
Anlo9utonai
a
WsQimiiy
CurtIla Met?
5
vWaeruly
Criteile Met
7 //
PHASE II:
Anthroprogenic
Acc\tSbie?
N
~~~~~~~~~~~~~~~~~~No
/
k-\7//
|
Pollutants
Are Risk
l
/
No~~~~~~~~~~~~~~~~~~~~~~~~~~~~~~~~~~~~I
Ye
WSV
auab
Field Trial and
Temst DNign
I
Met?s
Accept Source Water
FY
MetI
Trearert
sb
inanciey
o
Do Not Accept
SourCe Water
Suc
Pamible?~~
ae
\
Assessing Source Water Quality
5
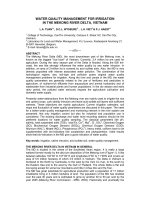
Box 1.1 Bioaccumulation
Bioaccumulation is a process in which chemical pollutants that enter into the body of an organism (by
adsorption through the gills and intestine or by direct exposure through the skin) are not excreted,
but rather collect in its tissues.
Rates of bioaccumulation in aquatic species vary
greatly depending on species behavior and physiology. For example, bottom feeders are more sensitive to pollutants associated with sediments. The
differences in the mechanism of regulating salt concentration between fresh and salt water fish may
affect exposure to water soluble contaminants. Different species may also accumulate various pollutants in different tissues, such as muscle, kidneys, or
liver. The toxicity of contaminants, bioavailability,
and rates of bioaccumulation are also influenced by
environmental factors such as temperature, dissolved oxygen, alkalinity, pH, redox potential, colloids, dissolved organics and suspended solids.
Species higher in the food chain tend to accumulate higher concentrations of many pollutants because they are feeding on organisms which have
pollutants concentrated in their tissues. There is little evidence that chemicals which bioaccumulate in
the fatty tissues of aquatic species high in the food
chain cause deleterious effects on these organisms.
However, it is thought that birds and mammals
which feed on these aquatic organisms experience
deleterious effects. Therefore, there are considerable
health concerns (for example, cancer, damage to the
nervous system) about the accumulation of such
substances in the tissues of fish which are consumed by humans. The U.S. Environmental Protection Agency conducted a national study of
accumulated toxins in fish caught in open waters
which documents the concern (USEPA 1992).
Sometimes pollutants can be naturally cleansed
from the tissue of aquatic animals by placing them
in clean water for a given period of time. The rate
of cleansing, or depuration, depends upon the species and the contaminant in question. The only
other way to address the problem of bioaccumulation is to reduce exposure of the fish to the contaminant through improved water quality.
toxins can also be screened. Because it is nei-
criteria are met, it is not mandatory to pursue
ther feasible nor desirable to test for every possible pollutant, only pollutants typical of
current and historical industrial, municipal,
and agricultural activities in the watershed
should be tested. In some cases high concentrations may occur in nature. This is common
in areas with large deposits of a particular mineral. If large natural sources are suspected in
the area, tests should be conducted to analyze
for the toxin(s). If the source water fails to meet
Phase II criteria, the feasibility of pre-treating
the water before use could be considered as in
Phase I. A decision as to whether to pursue a
Phase III field trial or reject the source water
can then be made. If both Phase I and Phase II
Phase m. However it is advised that Phase m
be pursued, if possible, as a means of minimizing the risk of project failure.
Phase m involves a pilot study or field test
in which fish are grown in the selected source
water, using similar management techniques
as those of the proposed project, and then
tested for bioaccumulated pollutants and offflavor. The pilot study could also be replaced
by sampling fish and shellfish tissues from an
existing aquaculture facility, if available, in the
vicinity that uses the same planned technology
and the source water in question. Following
Phase III where implemented, a final decision
can be made on the use of the source water.
CHAPTER 2
Phase I: Physio-chemical Water
Quality Parameters
Basic Factors
peraturelimits;however, suboptimaltemperature conditions cause stress which affects behavior, feeding, metabolism, growth, and
immunity to disease. It is therefore preferable
that water remain near optimum temperature,
and imperative that it never deviate beyond
lethal limits.
Listed in table 2.1 are general guidelines and
in table 2.2 species specific guidelines for
source water temperature. The guidelines are
based on the conditions at which optimal
growth rates occur.
Temperature, turbidity, salinity, alkalinity,
acidity, hardness, dissolved oxygen, carbon dioxide, total gas pressure, nitrogen compounds,
iron, hydrogen sulfide, methane, and watersoil interactions are the basic physio-chemical
properties tested in Phase I. Because these
physio-chemical properties of natural waters
affect the growth and health of fish and shellfish, these parameters must be tested for in all
potential water sources.
Temperature
Treatment. Since controlling the temperature
of ponds in large-scale aquaculture facilities
is often not practical, sites should be selected
in geographic regions which provide an ambient temperature conducive to the growth of
Effects. Water temperature affects a multitude
of important processes in aquaculture. Physiological processes in fish such as respiration
rates, feeding, metabolism, growth, behavior,
reproduction and rates of detoxification and
bioaccumulation are affected by temperature. Temperature can also affect processes
important to the dissolved oxygen level in
water such as the solubility of oxygen, and the
rate of oxidation of organic matter. In addition
the solubility of fertilizers can be affected by
temperature.
Table 2.1 General temperature guidelines
Species
Tropical
Warm-water
Cool-water
Guidelines. Each species has an optimum
temperature at which its growth rate and
heartiness are best. Growth will still occur at
very close to the upper and lower lethal tem-
Cold-water
Temperaturelcomment
29-300C / optimal growth
<26280C / low growth rates
< 10-150C / lethal limH
20-280C / optimal growth
<150C/ optimal growth
>_25°C_/_lethal_limH
Source: Boyd 1990 and Lawson 1995.
6
Phase I: Physio-chemical Water Quality Parameters
Table 2.2 Optimal rearing temperatures for selected species
Species
Temperature
(°C)
Reference
Brook trout
7-13
Piper et aL 1992
Brown trout
12-14
9-16
14-15
Petit 1990
Piper etal. 1982
Petit 1990
Piper et aL 1982
Brown trout
Rainbow trout
Rainbow trout
Atlantic salmon
Chinook salmon
Coho salmon
Sockeye salmon
10-16
15
10-14
9-14
15
European eel
Japanese eel
Common carp
Mullet
19
15
22-26
24-28
25-30
28
Tilapia
28-30
Channel caffish
27-29
Turbot
Plaice
Petit 1990
Piper et aL 1982
Piper et aL 1982
Petit 1990
Petit 1990
Petit 1990
Petit 1990
Petit 1990
Petit 1990
Petit 1990
Petit 1990
Tucker and
21-29
Piperoet at. 1982
78-82°F
Boyd 1990
13-23
Piper et at 1982
18-22
Romaire 1985
P. vannamei
28-30
Clifford 1994
Freshwater prawn
30
Romaire 1985
Brine shrimp
20-30
Romaire 1985
Brown shrimp
22-30
Romaire 1985
Pink Shrimp
> 18
Romaire.
Pink____Shrimp____>_______Romaire
___
Channel catfish
Channel caffish hatcheries
Striped bass
Red swamp crawfish
Source: Lawson 1995.
marketable-sized products within a reasonable
period of time (Lawson 1995,14).
Turbidity
Turbidity is a measure of light penetration in
water. Turbid conditions result from dissolved
and suspended solids such as clay and humic
compounds or microorganisms such as phytoplankton. In source water it is primarily a result of erosion during runoff. Because of the
significant contribution of erosion to turbidity,
caution should be used when taking source
water from areas where current and future
land use practices encourage erosion. Construction areas, deforested areas, and cropland
have relatively high rates of erosion while for-
7
est and grassland have lower rates of erosion
(Boyd 1996, 220-21).
In addition to turbidity from source water,
turbidity may also come during the aquaculture operation. For example in the aquaculture
pond turbidity can increase as a result of sediment resuspension, biological activity, the addition of manure and feed, and erosion of the
pond slopes.
Effects. Turbid waters can shield food organisms as well as cause gllU damage and fish stress.
It can also clog filters. Turbidity levels affect the
light available for photosynthesis by phytoplankton and the growth of undesirable organisms. In ponds with organisms that depend
upon phytoplankton for feed, turbidity must be
at sufficiently low levels to allow the penetration of light for photosynthesis. However, the
turbidity must also be high enough to avoid the
growth of undesirable rooted plants. The turbidity necessary for prevention of the growth of
these plants can be typically provided by the
phytoplankton themselves.
For ponds with organisms that derive a majority of their nutrition from feed inputs, light
for phytoplankton growth is not imperative
and therefore the turbidity can be higher. How..
ever, ff turbidity is too high in these ponds
photo-synthesis can be inhibited significantly
enough to reduce oxygen levels. This can be
remedied by using mechanical aeration at a
rate such that oxygenation occurs without exacerbating the turbidity problem through suspension of sediment.
Because many suspended solids will settle
out in ponds or canals, another major concern
besides turbidity itself is the arnount of suspended particles that can potentially settle out
(that is, settlable solids). Sediments from highly
turbid source water may fill ponds and canals
within a few months. They can contain large
amounts of organic matter that exerts a high
oxygen demand resulting in oxygen depletion.
Sedimentation can also smother eggs of some
species in ponds used for natural reproduction.
Sedimentation of contaminated suspended
particles is also of concern in areas affected by
8
Source Water Quality for Aquaculture: A Guidefor Assessment
pollutants such as heavy metals and pesticides
(Boyd 1990, 138).
Guidelines. Lethal levels of turbidity have
been shown to be 500-1,000 milligrams per liter
(mg l-l) for cold water fish (Alabaster and Lloyd
1982). Channel catfish have tested more tolerant
with their fingerlings and adults surviving
long-term exposures to 100,000 mg l-l with behavioral changes occurring above 20,000 mg l-l
(Tucker and Robinson 1990). Listed in table 2.3
are the ranges in which good to moderate fish
production can be obtained. Recommended
suspended solids concentrations for salmonid
culture from different literature sources are: less
than 30 mg 1-1, less than 80 mg l-', and less than
25 mg 1-'. 1
Treatment. Colloids or very small suspended
particles can be coagulated and precipitated by
adding electrolytes such as aluminum sulfate
(alum). While alum is very effective, it can cause
other water quality problems by reducing alkalinity and pH (see sections on pH and alkalinity). Lime can be added to counteract these
effects. Turbidity caused by suspended clay can
be precipitated by the addition of organics such
as barnyard manure, cottonseed meal, or superphosphate. However organic matter is often
difficult to obtain and apply; and it exerts an
oxygen demand when decomposing. Avoiding
or addressing the source of turbidity is a better
strategy than chemical treatments which require frequent application and may result in
other water quality problems.
Current methods of sediment (settlable solids) control involve using sediment ponds or
canals to reaove the bulk of sediment before
water enters the culture area, draining ponds
and removing sediments periodically at the
Table 2.3 Turbidity tolerance levels for aquaculture
Effect
No harmful effects on fisheries
Acceptable range
Detrimental to fisheries
Source: Boyd 1990.
Suspended solids concentration
25 mg j1
25-80 mgr
80 mg i"
end of the growing season, or dredging undrainable ponds. Sediments removed from
aquaculture facilities may be considered an envirormental hazard and, hence, be difficult
and/or costly to dispose (Boyd 1990, 365-72).
Salinity
Salinity is a measure of the total concentration
of dissolved ions in water and measured in
parts per thousand (%.). Salinity varies depending on where the water source lies in the
spectrum from seawater to freshwater. Typical
salinity values are less than 0.5%. for freshwater, 0.5 to 30%o for brackish water and 30 to
40%. for marine water.
In freshwater, the salinity and the elements
contributing most significantly to salinity can
vary depending on the rainfall and the geology
of the area. Freshwater commonly contains
relatively high concentrations of carbonate,
silicic acid, calcium, magnesium and sodium
(Stumm and Morgan 1981, 551).
The salinity of seawater varies depending on
proximity to the coastline, rainfall, rivers, and
other discharges. The elements contributing
most to the salinity of seawater however do
not vary markedly. Chloride and sodium ions
contribute most significantly with sulfate,
magnesium, calcium, potassium, and bicarbonate ions contributing to a lesser degree
(Stunmm and Morgan 1981, 567). Optimum salinities for selected species and general guidelines are shown in table 2.4.
Effects. Salinity is tremendously important
to fish which must maintain the concentration
of dissolved salts in their bodies at a fairly
constant level. Through the process of osmoregulation the fish expends energy in order to
maintain this level. Each organism has a range
of salinity in which it can grow optimally, and
when it is out of this range, excess energy
needs to be expended in order to maintain the
desired salt concentration. This is done at the
expense of other physiological functions, if the
salinity deviates too far from the optimum
range.
Phase I: Physio-chemical Water Quality Parameters
9
Table 2.4 Optimal salinities for selected species and general guidelines
Species
Salinity
Comment
Reference
Salmon
> 24%o
Optimum
Black 1991
Trout
<200/%o
Survival and growth decrease above 200/%o
McKay and Gjerde 1985
Upper salinity tolerance
Maceina and Shineman 1979
Optimum salinity
Stickney 1986
Grass carp
< 10-140/%o
Tilapia aurea and Tilapia nilotica
0-10%o
Red hybrid tilapia
< 170/%
Channel catfish
11-14%0/o
> 6-80/o.
0.5-3.00/o.
< 0.50/co
< 30/o
Freshwater prawn
M.rosenbergii
Brackish water prawn
P.vannamei
General Guidelines
Most freshwater fish
Can survive
Growth is poor
Perry and Avault 1970
Optimal salinity
Can still grow well
Optimal for egg and fry
0.1-8.00/%o
Optimal for hatcheries
12.00/co
<0.5%/o
Eggs and larval stage
Postlarval stages
Boyd 1990
Tansakul 1983
10-350/oo
Optimum
Acceptable range
15-250/oo
Optimum
Clifford 1994
Optimal
Can survive at <70/c but growth poor
Lawson 1995
15-250/oo
< 0.50/oo
< 2%o
Marine fish
Lawson 1995
33-340/oo
Optimum
30-400/oo
Acceptable range
Treatment. Salinity may be increased by adding gypsum or sodium chloride, though costs
could be prohibitive. Due to its high solubility,
large increases in salinity can be obtained using
sodium chloride. Generic rock salt can be used
for this purpose. Gypsum is only soluble up to
about 2%o and therefore is more appropriate for
affecting smaller changes in salinity (Boyd
1979). It should be noted that because increases
in salinity cause particles to settle, the effect of
increased sedimentation rates must be considered in any treatment to increase salinity. Lowering salinity would require advanced
treatment processes such as reverse osmosis
and electrodialysis, which are too expensive to
be practical for most aquaculture operations.
Alkalinity
culture, it is a convenient measure of the degree to which a water can neutralize acidic
wastes and other acidic compounds and subsequently prevent extreme pH shifts, which
can disturb the biological processes of the
aquaculture species. 2 Any chemical species
which can neutralize an acid can contribute
to alkalinity. In natural waters, the chemical
species most responsible for alkalinity are carbonate species (COy HCO). Hydroxides, ammonium, borates, silicates and phosphates also
contribute to alkalinity.3 Total alkalinity, or the
total amount of titratable bases, is expressed in
mg 1-1 of equivalent calcium carbonate
(CaCO3 ). Alkalinity in natural freshwater systems ranges from 5 mg 1-1 to 500 mg 1-1. Sea
water has a mean total alkalinity of 116 mg l-l
(Lawson 1995, 24).
Alkalinity is a measure of the acid neutralizing
capacity of a water. For the purpose of aqua-
Effects. There are no direct effects of alkalinity
on fish and shellfish, however it is an important
10
Source Water Qualityfor Aquaculture: A Guidefor Assessment
parameter due to its indirect effects. Most importantly, alkalinity protects the organism from
major changes in pH. The metabolism and respiration of fish and micro-organisms, particularly phytoplankton and bacteria, can produce
wastes and by-products which can change pH.
In addition some biological processes can
change alkalinity itself by producing or consuming acids or bases.4 A summary of some
processes are shown in appendix table 1.
Alkalinity may have another indirect effect
on aquaculture through its effect on photosynthesis. If alkalinity is too low (less than 20
mg l-1), the water may not contain sufficient
carbon dioxide (CC2 ) or dissolved carbonates
for photosynthesis to occur, thus restricting
phytoplankton growth (Lawson 1995, 24).
Guidelines. Listed in table 2.5 are the recommended general guidelines for the alkalinity of
source water used in aquaculture.
pH
The pH of water is its hydrogen ion concentration ([H+]). It is expressed as the negative logarithm of the hydrogen ion concentration
(log[H+]). Natural waters range between pH 5
and pH 10 while seawater is maintained near
pH 8.3. The pH problems associated with
aquaculture are usually not due to the source
Table 2.5 Alkalinity tolerance levels for aquaculture
Total alkalinity
(mg l.1)
Effect
Reference
15-20
Phytoplankton production low
<30
Poorly buffered against
rapid pH changes
20-400
Boyd 1974
Meade 1989,
Tucker and Robinson
1990
Sufficient for most
Meade 1989,
aquaculture purposes Tucker and Robinson
water but to processes that occur during the
aquaculture operation. 5 However, source
water with a proper pH is imperative, and the
pH of any potential source water should be
screened.
Effects. The pH of water used in aquaculture
can affect fish health directly. For most species,
a pH between 6.5 and 9 is ideal. Below pH 6.5
species experience slow growth (Lloyd 1992,
64). At lower pH, the species ability to maintain
its salt balance is affected (Lloyd 1992, 87) and
reproduction ceases. At approximately pH 4 or
below and pH 11 or above, most species die
(Lawson 1995, 26).
The pH can also indirectly affect fish and
shellfish through its effects on other chemical
parameters. For example, low pH reduces the
amount of dissolved inorganic phosphorous
and carbon dioxide available for phytoplankton photosynthesis. Also at low pH, metals
toxic to fish and shellfish can be leached out of
the soil. At high pH, the toxic form of ammonia
becomes more prevalent. In addition phosphate, which is commonly added as a fertilizer,
can rapidly precipitate at high pH (Boyd 1990,
154).
Guidelines. The effects of pH on warm water
pond fish are summarized in table 2.6 along
with recommended levels for salmon culture.
Treatment. Low pH waters are often treated
using lime (Boyd 1981, chapter 5). Alum can be
used to treat high pH waters. In cases where the
high pH problem is due to excess phytoplankton photosynthesis in waters with high alkalinity and low calcium hardness, gypsum can be
added as a source of calcium. Another option is
to kill off phytoplankton with algaecides, but
low dissolved oxygen conditions, residual adverse effects of the algicide, and high costs may
result (Boyd 1990, 378).
1990
2100 or 150
Desirable
Meade 1989,
Tucker and Robinson
1990
1990_______________
Source: Lawson
1995.
Hardness (Calcium and Magnesium)
Total hardness is a measure of the concentration of all metal cations with the exception of
Phase I: Physio-chemical Water Quality Parameters
Table 2.6 pH tolerance levels and effect for aquaculture
11
for bone and exoskeleton formation and for
Effect
osoregulation. Crustaceans absorb calcium
4.0-6.5
Acid death point
No reproduction
Slow growth
6.5-9.0
Desirable range for fish
from the water when molting, and if the water
is too soft their exoskeletons begin to soften and
they may cease to molt. In addition, bone deformities and reduced growth rates may result
if water is too soft.6
Hardness also affects aquaculture species
production
and operations through its chemical interac-
9.0-11.0
Slow growth
tions with other species in water. Calcium re-
Alkaline death point
duces the toxicity of metals, ammonia, and the
Recommended range for fish
production
hydrogen ion. In addition, due to the higher
ion concentration m hard waters, suspended
soil particles settle faster in hard waters than
soft waters. For waters where alkalinity is high
and calcium is low, photosynthesis may in-
pH levels
Warmn water pond fish
<14.0
4.0-5.0
> 11.0
Salmonid culture
6.4-8.4
6.7-8.6
Recommended range forpfish
6.7-7.5
Recommended range for fish
crease the pH to levels that are toxic to fish
(Boyd 1990, 143, 377).
production
Sources: Lawson 1995, Tarazona and Munoz 1995.
the alkali metals. Calcium and magnesium are
the most common cations contributing to hardness in fresh water systems. To a much lesser
extent, hardness also includes other divalent
ions such as iron (Fe2 +) and barium (Ba2 +).
Water is classified with respect to its hardness
and softness as shown in table 2.7.
These categories were originally developed
for municipal water treatment and thus have
no biological relevance. It should be noted that
much of the concern about hardness in water
treatment is with all the ions involved, while
in aquaculture the concern is mostly with the
calcium concentration.
Effects. Calcium is the most important component of hardness to aquaculture. It is necessary
Guidelines. In general the most productive
waters for fish culture have roughly equal magnitudes of total hardness and total alkalinity. 7
Listed in table 2.8 are general and species specific guidelines for freshwater aquaculture.
Hardness averages 6,600 mg Pl in ocean water
and therefore is not a problem in seawater or
brackish water systems (Lawson 1995, 25).
Treatment. Insufficient hardness is easily
overcome. Calcium hardness can be raised by
adding agricultural gypsum or calcium chloride. Gypsum is preferable because it costs less,
is more readily available, and does not affect
alkalinity. Its disadvantages include the variable purity of agricultural gypsum (70-98 percent) and its slow reaction rate relative to
calcium chloride (Boyd 1990,383).
Dissolved Oxygen
Table 2.7 Hardness tolerance levels for aquaculture
Water classification
Soft
Moderate
Hard
Very hard
Source: Sawyer and McCarty 1978.
Concentration
(CaCOa perliter)
0-75 mg
75-150mg
Dissolved oxygen (DO) is a very basic requirement for aquaculture species. It is usually the
first limiting factor to occur in pond culture.
Dissolved oxygen is a complex parameter because its concentration is dependent upon
150-300 mg
> 300 mg
many processes. In an aquaculture system the
sources of dissolved oxygen are photosynthesis and reaeration from the atmosphere. The
12
Source Water Quality for Aquaculture: A Guide for Assessment
Table 2.8 Optimal ranges for total hardness
Species
Hatchling silver carp
Channel catfish hatchery
Trout hatchery
Warm water hatchery
Freshwater crustaceans
Freshwater crayfish
General guideline
Total hardness
(mg 1-1)
Comment
Reference
300-500
>20
10-400
50-400
>50
> 100
Optimum
Optimum
Suggested
Suggested
Some species need more
For optimum production
Boyd 1990
Boyd 1990
Piper eta!. 1982
Piper et aL 1982
Boyd 1990
De la Bretonne et a/. 1969
Hardness =alkalinity
Boyd and Walley 1975
Romaire 1985
20-300
sinks include oxygen-consuming processes
such as respiration from microbial life, fish,
and plants, and the degradation of organic
matter by microorganisms (biological oxygen
demand or BOD). These processes are influenced by other factors. Photosynthesis, respiration, the degradation of organic matter,
and the solubility of oxygen are all influenced
by temperature. The type of fish, life stage,
feeding practices, level of activity and dissolved oxygen concentration also influence the
respiration rate. In addition to temperature,
oxygen solubility is also affected by salinity,
barometric pressure and impurities. The most
common cause of low dissolved oxygen in an
aquaculture operation is a high concentration
of biodegradable organic matter (and thus
BOD) in the water. This is especially true at
high temperatures. Hence BOD is possibly a
more important parameter to dissolved oxygen
than dissolved oxygen itself.
Effects. Dissolved oxygen concentrations near
saturation levels are generally healthiest for
fish. Romaire (1985) believes that growth is impaired if dissolved oxygen concentrations remain below 75 percent saturation for long
periods, and Colt and Orwicz (1991) recommend that dissolved oxygen be maintained at a
minimum of 95 percent saturation for optimum
growth. The following generalizations were derived for warm water pond fish. For dissolved
oxygen concentrations approximately 1-5mg 1-,
the dissolved oxygen is still high enough for
survival; however, long-term exposure results
in slow growth. As dissolved oxygen gets below 1 mg l-l, it becomes first lethal after longterm exposure; and at lower dissolved oxygen,
only small fish can survive short-term exposures
(Lawson 1995, 23). At high oxygen concentrations, oxygen supersaturation can contribute to
gas bubble trauma (see section on total gas pressure). Although when combined with other
gases, oxygen can cause gas bubble trauma.
High oxygen concentrations alone do not result
in gas bubble trauma, but high dissolved oxygen
concentrations occurring at times when water
temperature increases rapidly can augment the
phenomenon (Tarazona and Munoz 1995, 124).
Oxygen supersaturation occurs due to high
dams, aerators, and rapid photosynthesis when
saturated groundwater is warmed naturally to
ambient temperatures, or when saturated water
is heated in hatcheries (Boyd 1990, 150-52).
Guidelines. Setting guidelines for dissolved
oxygen for source water is difficult because dissolved oxygen in aquaculture operations is affected by many processes independent of the
initial source-water dissolved oxygen. At the
screening stage, the initial dissolved oxygen
and BOD can be used to assess the ability of the
source water to maintain proper oxygen levels.
Other factors affecting dissolved oxygen concentration in the aquaculture operation can
only be assessed and mitigated once the operation is running.
Listed in table 2.9 are the tolerances for dissolved oxygen for different species. These
should be considered as a minimum for source
Phase I: Physic-chemical Water Quality Parameters
13
Table 2.9 Recommended levels of dissolved oxygen for aquaculture
Species
DO (mg 1-')
Tilapia
> 5.0
3.0-4.0
Comment
Reference
Preferred
Tolerable
Lloyd 1992
Trout
10.0
5.0
Normal at 150C
Limit for acclimation
Lloyd 1992
Marine fish
> 6.0
Minimum
Huguenin and Colt 1989
Cold water fish
> 6.0
Minimum
Lawson 1995
Can only survive lower DO for a few hours
Lloyd 1992
Roberts and Shepherd 1974
Optimal
Black 1991
Can only survive lower DO for a few hours
Lloyd 1992
Salmonids
Salmon
Warm water crustaceans
> 5.0
>5.5 fish
>7 eggs
>8.5
100% saturation
>5
Eel
>5
3.0-4.0
Preferred
Tolerable
Uoyd 1992
Carp
>5.0
3.0-4.0
Preferred
Tolerable
Lloyd 1992
Example: goldfish
Lloyd 1992
More tolerant to low DO than cold water species
Recommended
Live for several days
Live for several hours
Lethal concentration
Lloyd 1992
Lawson 1995
<0.5 (fingerlings)
0.5 (adults)
2.0-3.0
< 5.0
<6.0 (hatchery)
Survive short exposure
Survive short exposure
Adults survive, eggs die
Feed poorly, grow slowly
Lawson 1995
Lawson 1995
Lawson 1995
Lawson 1995
Boyd 1990
<1.0 (uveniles)
<2.0
Survive short exposure
Adults crawl out
Avault eta. 1974
Lawson 1995
Like freshwater fish
Lethal concentration
Boyd 1990
Lawson 1995
Optimum
Clifford 1994
Fish inmuddy ponds or
warm, slow rivers
Resistant to
low DO
Warm water fish
> 5.0
> 1.5
> 1.0
<0.3
Channel caffish
Red swamp crawfish
Penaeid shrimp species
low DO
0.7-1.4
P.vannamei
6.0-10.0
General guideline
> 5.0-6.0
water. In addition the dissolved oxygen and
BOD should be used together to assess the ability of the source water to maintain proper oxygen levels.
Treatment. Treatment of source water for low
dissolved oxygen can be accomplished using
Lawson 1995
aerators. These systems typically employ mechanical mixing in order to increase the surface
area of the water exposed to the air and thus the
transfer of oxygen. These can take many forms
including running the water over baffles or employing power aerators such as paddlewheel
aerators and spray aerators. 8