Sustainable tea production at the Northern Moutainous Region in VietNam (LV thạc sĩ)
Bạn đang xem bản rút gọn của tài liệu. Xem và tải ngay bản đầy đủ của tài liệu tại đây (1.08 MB, 131 trang )
SUSTAINABLE TEA PRODUCTION
AT THE NORTHERN MOUTAINOUS REGION
IN VIETNAM
Nguyen Bich Hong
May 2016
SUSTAINABLE TEA PRODUCTION
AT THE NORTHERN MOUTAINOUS REGION IN VIETNAM
By
NGUYEN BICH HONG
A Dissertation Submitted to Kyushu University in Partial Fulfillment of
the Requirements for the Degree of
DOCTOR OF PHILOSPHY IN AGRICULTURAL SCIENCE
Department of Agricultural & Resource Economics
Supervised by:
Professor Dr. Mitsuyasu YABE
Associate Professor Dr. Yoshifumi TAKAHASHI
Assistant Professor Dr. Goshi SATO
Graduate School of Bioresource and Bioenvironmental Sciences
Faculty of Agriculture
KYUSHU UNIVERSITY
2016
Abstract
Tea production has contributed significantly to economic development and poverty
reduction in Vietnam, with thousands of rural people, still depending on it for their living.
However, problems and challenges such as: low productivity, low price and quality, depending
on agro-chemical inputs, land degradation, water scarcity, and climate change have hindered
sustainable development of Vietnamese tea sector. For this reason, Vietnamese government is
actively seeking solutions to render tea production more sustainable. This study attempts to
provide an insight into how Vietnamese smallholder tea farms can reallocate resources and
adjust farm practices and management towards sustainability by assessing tea farming system in
the Northern mountainous region from four aspects: technical efficiency, environmental
efficiency, irrigation use efficiency and profit efficiency. Translog stochastic production and
profit frontier models were used to measure efficiencies and separate Tobit models were applied
to investigate determinants of efficiencies.
Research results revealed that the improvement in economic, environmental, and social
sustainability of the tea sector can be achieved by being more technically, environmentally,
irrigation water use and profitably efficient. The mean of output and input-oriented technical
efficiency were 92.29% and 82.21%, suggesting that inputs reduction strategy is superior to
increasing output one, in term of sustainability improvement. All recent inputs application could
be contracted by 17.79% without scarifying the current output level. Specifically, on average,
comprehensive environmental efficiency of fertilizer and pesticide were found to be 69.80% and
55.89%, which imply that farmers can reduce use these environmentally detrimental inputs by
30.20% versus 44.11% without losing output. Similarly, the mean of irrigation water use
efficiency was 42.19%, indicating that the observed output can maintain with saving of irrigation
water use by 57.81%. Furthermore, 82.03% of profit efficiency indicated that there a room
(17.97%) to increase tea farmers ‘profit by improving technical and allocative efficiency.
Socioeconomic and psychological factors such as: gender, soil and water conservation practices,
agricultural income, off-farm income, access to extension services, water scarcity perception,
irrigation by well water, process machineries utilization, linkage with enterprises, direct product
marketing activities, and market information access had significant influence on the efficiency
measures of tea production. In order to sustain the tea sector, the policies that focus on these
farms and farmers’ attributes are very essential.
i
Contents
Abstract .......................................................................................................................................................... i
Contents ........................................................................................................................................................ ii
Listing of Figures .......................................................................................................................................... v
Listing of Tables........................................................................................................................................... vi
Acknowledgement ........................................................................................................................................ vi
Chapter 1 Introduction ................................................................................................................................ 1
1.1. Background Information ........................................................................................................................ 2
1.2. Problem Statement ................................................................................................................................. 4
1.3. Research Objectives ............................................................................................................................... 8
1.3.1. Overall objective ............................................................................................................................. 8
1.3.2. Specific objectives .......................................................................................................................... 8
1.4. Significance of the study ........................................................................................................................ 8
1.5. Thesis outline ......................................................................................................................................... 9
Chapter 2 Theoretical framework.............................................................................................................. 10
2.1. Introduction .......................................................................................................................................... 11
2.2. Theories of Sustainable Agriculture .................................................................................................... 11
2.2.1. Concept of Sustainable Agriculture .............................................................................................. 11
2.2.2. Agricultural sustainability measurement....................................................................................... 13
2.3. Theories of Efficiency analysis ............................................................................................................ 20
2.3.1. Production frontier ........................................................................................................................ 20
2.3.2. Profit frontier ................................................................................................................................ 21
2.3.3. Definition and measures of efficiency .......................................................................................... 23
2.3.4. Methods for estimating efficiency ................................................................................................ 26
2.3.4.1. Stochastic frontier analysis .................................................................................................... 27
2.3.4.2. Data envelopment analysis..................................................................................................... 29
2.3.4.3. Strength and weakness of Stochastic frontier analysis and Data envelopment analysis ....... 30
2.3.5. Tobit model to analyze determinants of efficiency ....................................................................... 32
2.3.6. Applications of frontier functions method for estimating efficiency of agricultural production .. 32
Chapter 3 Study area and Data ................................................................................................................. 35
ii
3.1. Introduction .......................................................................................................................................... 36
3.2. Study area and data collection ............................................................................................................. 36
Chapter 4 Technical efficiency and its determinants in Vietnamese tea production ................................. 42
4.1. Introduction .......................................................................................................................................... 43
4.2. Analytical frame work ......................................................................................................................... 44
4.2.1. Technical efficiency ...................................................................................................................... 44
4.2.2. Determinants of technical efficiency ............................................................................................ 48
4.3. Results .................................................................................................................................................. 49
4.3.1. Tea production function specification........................................................................................... 49
4.3.2. Technical efficiency ...................................................................................................................... 51
4.3.3. Factors affecting technical efficiency ........................................................................................... 53
4.4. Disccusion and policy recommendations ......................................................................................... 54
4.5. Conclusions .......................................................................................................................................... 57
Chapter 5 Environmental efficiency and its determinants in Vietnamese tea production ......................... 58
5.1. Introduction .......................................................................................................................................... 59
5.2. Analytical framework .......................................................................................................................... 59
5.2.1. Environmental efficiency .............................................................................................................. 59
5.2.2. Determinants of environmental efficiency .................................................................................... 63
5.3. Results .................................................................................................................................................. 64
5.3.1. Environmental efficiency .............................................................................................................. 64
5.2.2. Determinants of environmental efficiency .................................................................................... 66
5.3. Discussion and policy recommendations ............................................................................................. 67
5.4. Conclusions .......................................................................................................................................... 68
Chapter 6 Irrigation water use efficiency and its determinants in Vietnamese tea production ................. 69
6.1. Introduction .......................................................................................................................................... 70
6.2. Analytical framework .......................................................................................................................... 71
6.2.1. Irrigation water use efficiency ...................................................................................................... 71
6.2.2. Determinants of irrigation use efficiency...................................................................................... 76
6.3. Results .................................................................................................................................................. 77
6.3.1. Irrigation water use efficiency ...................................................................................................... 77
6.3.2. The contributing factors of irrigation water use efficiency ........................................................... 78
6.4. Discussion and policy recommendations ............................................................................................. 80
iii
6.5. Conclusions .......................................................................................................................................... 82
Chapter 7 Profit efficiency and its determinants in Vietnamese tea production ....................................... 84
7.1. Introduction .......................................................................................................................................... 85
7.2. Analytical framework .......................................................................................................................... 85
7.2.1. Profit efficiency ............................................................................................................................ 85
7.3. Results .................................................................................................................................................. 87
7.3.1. Profit efficiency ............................................................................................................................ 87
7.3.2. Factors affecting profit efficiency ................................................................................................. 91
7.4. Discussion and Policy recommendations ............................................................................................. 92
7.5. Conclusions .......................................................................................................................................... 96
Chapter 8 Conclusions ............................................................................................................................... 97
8.1. Introduction .......................................................................................................................................... 98
8.2. Main findings and Policy recommendations ........................................................................................ 98
8.2.1. Efficiency estimation .................................................................................................................... 98
8.2.2. Factors affecting to efficiency levels .......................................................................................... 102
8.2.2.1. Determinants of technical efficiency ................................................................................... 105
8.2.2.2. Determinants of environmental efficiency ........................................................................... 105
8.2.2.3. Determinants of irrigation water use efficiency ................................................................... 105
8.2.2.4. Determinants of profit efficiency ......................................................................................... 106
8.3. Research contributions ....................................................................................................................... 106
8.4. Limitations and Recommendations for further studies ...................................................................... 108
REFERENCES ......................................................................................................................................... 109
iv
Listing of Figures
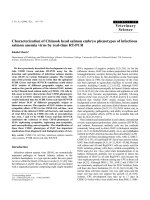
Figure 1.1: Production, export and consumption value in thousand tons of top 10 tea producing
countries in 2013 ............................................................................................................................. 2
Figure 1.2: Tea plantation in Vietnam ............................................................................................ 3
Figure 1.3: Tea production in Vietnam (2006-2015) ...................................................................... 4
Figure 1.4: Constraints of tea production in Vietnam..................................................................... 6
Figure 2.1: Sustainable livelihood Analytical Framework ........................................................... 14
Figure 2.2: Conceptual framework ............................................................................................... 19
Figure 2.3: Production frontiers and technical efficiency ............................................................. 21
Figure 2.4: Output orientation efficiency measure ....................................................................... 25
Figure 2.5: Input orientation efficiency measure .......................................................................... 26
Figure 2.6: Illustration of Stochastic frontier analysis .................................................................. 28
Figure 2.7: Illustration of Data envelopment analysis .................................................................. 29
Figure 3.1: Study locations at the Northern mountainous region in Vietnam .............................. 37
Figure 4.1: Technical efficiency concepts in the production frontier framework ........................ 44
Figure 5.1: Distribution of economic loss..................................................................................... 65
Figure 6.1: 3-D graphical illustration of technical efficiency measures ....................................... 72
Figure 6.2: Cross-sectional graph of input-oriented technical and irrigation water use efficiency
measures ........................................................................................................................................ 73
Figure 7.1: Profit efficiency of tea farms ...................................................................................... 90
Figure 8.1: Efficiency levels of tea production at the Northern mountainous region in Vietnam 99
Figure 8.2: Potential reduction of inputs of tea production at the Northern mountainous region in
Vietnam ....................................................................................................................................... 100
v
Listing of Tables
Table 2.1: Classification of scholars’ emphasis and their tendency toward ................................. 15
Table 2.2: Strengths and weaknesses of Stochastic Frontier Analysis and Data Envelopment
Analysis method............................................................................................................................ 31
Table 3.1: Descriptive statistics of variables in production and profit frontier models ............... 39
Table 3.2: Descriptive statistics of farm – specific variables ...................................................... 41
Table 4.1: Translog production function estimation ..................................................................... 50
Table 4.2: Output elasticity per specific input ............................................................................. 51
Table 4.3: Output and input oriented technical efficiency distribution ........................................ 52
Table 4.4: Determinants of technical efficiency in Tobit model .................................................. 53
Table 5.1: Environmental efficiency distribution ......................................................................... 64
Table 5.2: Descriptive statistic of economic loss due to ............................................................... 65
Table 5.3: Determinants of environmental efficiency in Tobit model .......................................... 66
Table 6.1: Irrigation water use efficiency distribution of Vietnamese tea production ................ 77
Table 6.2: Tobit estimates on determinants of irrigation water use efficiency ............................ 79
Table 7.1: Maximum-likelihood estimates of profit frontier function .......................................... 88
Table 7.2: Estimated profit elasticities.......................................................................................... 89
Table 7.3: Descriptive statistic of tea farms’ profit losses ............................................................ 90
Table 7.4: Tobit estimation on determinants of profit efficiency ................................................. 91
Table 8.1: Determinants of efficiency measures of tea production ............................................ 103
vi
Acknowledgement
I would like to express my sincerest and most thankful appreciation and profound
gratitude to the following organizations and individuals for their invaluable support, guidance,
assistance, and encouragement in the pursuit of my graduate studies.
First and foremost, my heartfelt appreciation goes to my supervisor Professor Dr.
Mitsuyasu Yabe. It has been an honor to work with him. His professionalism, insightful
comments and commitment to research, have inspired me and led to the success of this thesis.
I am indebted to Associate Professor Dr. Hisako Nomura for her expert advices during
the conduct of the survey and data analysis. I am likewise grateful to Associate Professor Dr
Yoshifumi Takahashi for his comments and corrections on my dissertation.
My sincere appreciation goes to all colleagues in Japan, especially all members of
Environmental Economic laboratory for their warm friendships, help and support.
Many thanks to the Japanese Government for granting me the scholarship which covered
living expenses during my stay in Japan, and to Setsutaro Kobayashi Memorial Fund for the
financial support during the conduct of the survey.
Last but not the least, I would like to express my utmost gratitude to my parents and
parents in law. Their spiritual supports have always been a source of encouragement. I also owe
my husband Le Van and my son Nam Duong a special acknowledgement. Without their
unconditional love and support, this study would not have been carried out and gone any far.
vii
Chapter 1
Introduction
1
1.1. Background Information
Tea is the second most prevalent drink in the world, after water (Szenthe 2015). Tea
consumption in the world increased by 60% in the period of 1993-2010, and considerable growth
is predicted with more people becoming tea consumers (Brouder et al. 2014). Today, tea
production plays a key role in socio-economic development in many poor countries. The Tea
2030 steering group stated that tea is going to become a ‘hero’ crop for 2030 which brings
significant benefits to not only millions of stakeholders in the sector but also the world (Brouder
et al. 2014).
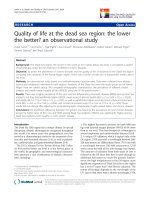
As the demand for tea in the world market has increased significantly, tea production has
also expanded. Global tea production reached 5.07 million tons in 2013. While tea is produced in
more than 35 countries, only a handful - China, India, Sri Lanka and Kenya – are responsible for
almost three-quarters of production. Other important producing countries are Turkey (4.5%),
Viet Nam (3.7%) and Indonesia (3%).
5063.9
World
1924.5
China
1200.4
India
436.3
Kenya
343.1
Sri Lanka
Vietnam
185
Turkey
227
Production
Export
Consumption
152.7
Indonesia
Japan
84.7
Argentina
78.9
Bangladesh
66.2
0
1000
2000
3000
4000
5000
6000
Figure 1.1: Production, export and consumption value in thousand tons of top 10 tea
producing countries in 2013
Source: FAO Intergovernmental Group Secretariat, Chang (2015)
Tea is an important commodity in terms of export earnings and jobs. The major
consuming countries are also the major producing countries—China and India, respectively
accounting for 33.3% and 20.7% of global consumption in 2013 respectively. World tea exports
2
reached 1.77 million tons and export earnings increased to USD 5.7 billion in 2013. The major
exporting countries are Kenya, China and Sri Lanka, which together control almost 59.7% of
world exports. Millions of livelihoods around the world depend on tea picking and processing.
On estimation, there are 13 million workers involved in tea production worldwide, of which
around 9 million are smallholders (IDH 2010).
Vietnam has many favorable conditions for agricultural development, in which tea is one
of the products with significant advantages. In Vietnam, tea has a long and glorious cultivation
history up to three thousand years, rich in traditional and cultural significance. The Vietnamese
people living in both rural and urban areas have an established custom of drinking tea. Tea is
leading among Vietnam’s cash crops and considered an important national sector with regard to
job creation, foreign exchange earnings and poverty alleviation. The industry provides
employment for about 400,000 small rural households (GSO 2011). Vietnamese tea products
have made their presence in more than 100 countries and territories worldwide. At present,
Vietnam is the fifth largest tea exporters in the world. Export turnover from 132,000 tons sold
oversea in 2014 grossed 228.12 million (GSO 2014). Currently, Vietnam has more than 132,000
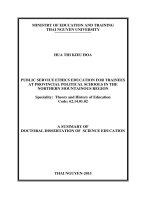
hectares of plantation land favorable for tea production spreading 39 provinces (GSO 2015).
Although French companies tried to expand tea production throughout Vietnam, the northern
mountainous and midland region remained the largest tea planted area which accounts for 72.4
% of the country (see Figure 1.2).
17.3%
3.6%
Red River Delta
6.7%
Northern midlands and
mountain areas
North Central and Central
coastal area
Central Highland
72.4%
Figure 1.2: Tea plantation in Vietnam
Source: Vietnamese General Statistics Office (GSO 2015)
3
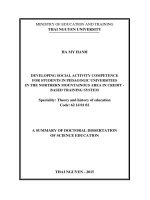
Tea production in Vietnam grew strikingly over the past decades. During the period
2006-2015, fresh tea production increased an average of 7.07 percent (see figure 1.3). The year
2015, saw a considerable growth in tea production with 237.5 tons compared with 2014.
1200
1200.0
1000.0
800.0
648.9
705.9
746.2 771
823.7
909.8
879
962.5
936.3
Production
(thousand tons)
600.0
400.0
200.0
2006 2007 2008 2009 2010 2011 2012 2013 2014 2015
Figure 1.3: Tea production in Vietnam (2006-2015)
Source: Ministry of Agriculture and Rural Development (MARD 2016)
1.2. Problem Statement
Despite its importance to developing countries, global tea sector is hindered with serious
social, economic, and environmental issues amid the finite of natural resources, rapidly growing
populations and climate change (Onduru et al. 2012). This threatens the long term production
capacity of the sector. Scientists and communities face the challenge of developing a new
paradigm for tea industry, which captures the concept of sustainability to enhance production —
both in terms of quantity and quality — without degradation of the production resources and the
environment.
Sustainable tea production has become a major objective of Vietnamese agricultural
policy. The government and populace have realized that sustainable development can increase
profitability and production efficiency through integrated farm management and conservation of
soil, water, energy and other biological and productive resources. It can meet subsistence needs
4
and enhance agricultural resource management systems. Likewise, it can minimize the variable
costs of external inputs. From the social point of view, it can increase self-reliance among
farmers and rural people through better use of indigenous knowledge and farmers’ skills.
In response to sustainable agricultural development in general and the tea sector in
particular, the Vietnamese government has formulated Strategic Orientation for Sustainable
Development (Vietnam Agenda 21 on 17 August 2004) and a number of laws and regulations,
including: Law of Agriculture, Law of Agricultural Environmental Protection, Law of
Environmental and Resource Conservation, Law of Soil and Water Conservation and Law of
Land Management. The main components of these laws are concerned with the importance of
environmental and natural resource protection, and the role of the government and people in the
environmental conservation process. At present, together with the international community,
Vietnam is determined to, step by step; surmount all obstacles implementing sustainable
development towards establishing a green agriculture.
Although significant achievements have been made in developing tea production in the
Vietnam, some serious problems remain that restrict its sustainable development (Figure 1.4):
Vietnamese tea sector is currently performing below its potential. Productivity is
low and product quality is poor (Asian Development Bank 2004).
Vietnamese tea production is hindered by rising production costs (labor, fuel and
electricity), mismanagement, and age of tea bushes, high overhead costs, bad
agricultural practices, low labor productivity, and dilapidated infrastructure.
Additionally, for the smallholder tea sector, problematic issues include low farm
gate prices, poor extension services, limited market channels, poor access to credit
and low level of farmer organization (VanDer Wal 2008).
The tea sector’s environmental footprint is considerable, with reduced
biodiversity due to habitat conversion and high energy consumption (mainly using
logged timber) among other factors (Van Der Wal 2008). Furthermore, pesticide
use in Vietnamese tea production is very high and tea growers have a little
knowledge and understanding about safety and effective use of pesticide. The
excessive use of pesticides and agro-chemicals in tea production produces not
only negative impacts to the environment and to human health but also high risk
5
to the environment and the health of the tea growers (Ngo et al. 2001; Asian
Institute of Technology 2002).
Besides, the tea industry also faces with the challenges from climate change and
water scarcity. The International Panel on Climate Change report (2007) showed
that Vietnam is one of the most vulnerable countries in connection with climate
change. The rising shortage of water in Vietnam has been identified as one of the
main obstacles for environmental conservation and poverty reduction. Water
demand for Vietnamese agriculture may double or triple by 2100 compared to
2000. At the same time, there are constantly growing risks of severe droughts and
water shortage for irrigation, also the changing climate is predicted to affect rather
the North than the South (FAO 2011). Irrigated tea-based cropping systems which
are among the major water users in Vietnam will be affected seriously.
Tea Production in Vietnam
Economic
constraints
Environmental
problems
Dominated by
small holders
Low productivity
High production
cost
Low prices
Lack of quality
tea
Chemical inputs
use
Soil erosion and
low soil fertility
Water pollution
Social problems
Poor living
conditions of
smallholder tea
growers
Low level of
farmers’
organization
and extension
services
Unsustainable Tea Production System
Figure 1.4: Constraints of tea production in Vietnam
6
Climate change
and water
scarcity
Rising
temperature
Irregular
rainfall
pattern
Long drought
Addressing the emerging issues requires adoption of alternative tea practices that takes
into account environmental, social and economic impacts of tea activities when making
improvements in the current farming systems. Sustainable tea production contributes to
addressing this challenge. For a farm to be sustainable, Reganold et al. (1990) indicated that
“… it must produce adequate amounts of high-quality food, protect its resources and be
both environmentally safe and profitable… sustainable agriculture addresses many serious
problems …: high energy costs, groundwater contamination, soil erosion, loss of productivity,
depletion of fossil resources, low farm incomes and risks to human health and wildlife habitats.”
The literature on tea production in developing countries can be found in Basnayake and
Gunaratne (2000), Saigenji and Zeller (2009), Baten (2010), and Haridas et al. (2012). All of
these studies focus on output-oriented technical efficiency which determines the ability of tea
farms to maximize output with a given set of inputs. To the best of our knowledge, there have no
prior studies conducted to evaluate the sustainability of tea production, specifically in examining
the technical efficiency, environmental efficiency, water use efficiency and economic efficiency
including socio-economic and environmental determinants. The present research hopefully fills
this gap. The following research questions have been raised and try to answer by this research:
1) What are the existing farm practices and management situations of tea production
in the Northern mountainous region of Vietnam?
2) Do farmers efficiently use the combination of inputs for producing tea?
3) What are the existing technical, environmental, irrigation water use efficiency,
profit efficiency levels of tea production in the Northern mountainous region of
Vietnam?
4) Are there any differences in efficiency among tea farmers?
5) What are the determinants of technical, environmental, economic and irrigation
water use efficiency of tea production in the Northern mountainous region of
Vietnam
7
1.3. Research Objectives
1.3.1. Overall objective
This study aims to recommend appropriate strategies and approaches for sustainable tea
production in the Northern mountainous region of Vietnam.
1.3.2. Specific objectives
The specific objectives are:
1) To investigate the existing tea farming practices in the study area.
2) To assess the technical efficiency of tea production in the study area.
3) To evaluate the environmental efficiency of tea production in the study area.
4) To measure the irrigation water use efficiency of tea production in the study area.
5) To analyze the profit efficiency of tea production in the study area.
6) To investigate the factors affecting the technical, environmental efficiency, irrigation
water use, and economic efficiency of tea production in the study area.
1.4. Significance of the study
This study forms a point of reference for evaluating the sustainability of agricultural
production based on efficiency theory. It generates the empirical evidence required to facilitate
the improvement of technical, environmental, irrigation water use and profit efficiency, which
will help improve the sustainability of small household tea production in the Northern
mountainous region of Vietnam. Equally, by expanding the empirical database and knowledge
on tea farms’ performance in the economic, social, and environmental aspects of their
production, the study has further provided a decision-support to enhance the effective
development and implementation of sustainable tea production policies in Vietnam.
8
1.5. Thesis outline
The study contains eight chapters. This chapter presents a background on tea production
in the world and in Vietnam setting. It also introduces the problem statement, research’s
objectives, and the significance of the research. The next chapter, Chapter 2 explores and
reviews theoretical background of sustainable agriculture and efficiency analysis. It begins with
concepts and measurements of sustainable agriculture and then follows by theory of efficiency
analysis and summary of stochastic frontier analysis and data envelopment analysis. The last
section of this chapter ends with the literature surveys of empirical study on efficiency
measurement of agricultural production, particularly tea production. Chapter 3 starts with
background information of the study area and continues to giving the details of sampling method
and sample sizes of primary data collection., environmental efficiency, irrigation water use
efficiency and profit efficiency by using stochastic frontier analysis and Tobit model..
Chapter 4, 5, 6, and 7 present efficiency measures and their determinants. All these
chapters have similar structure. The first section of each chapter introduces problem and the
research’s objective. The second section is analytical frameworks. The next section reports
research’s results. Discussion and policy recommendations are introduced in the next section.
Conclusions are given in the final section. The detail content of each chapter is given as follows:
Chapter 4: Technical efficiency and its determinants in Vietnamese tea production
Chapter 5: Environmental efficiency and its determinants in Vietnamese tea
production
Chapter 6: Irrigation water use efficiency and its determinants in Vietnamese tea
production
Chapter 7: Profit efficiency and its determinants in Vietnamese tea production
Lastly, in Chapter 8 summarizes the main findings of the study and draws the policy
recommendations. The last section of this chapter, limitations of the study and recommendations
for further study are discussed.
9
Chapter 2
Theoretical framework
10
2.1. Introduction
From the initial step of propagating tea in a nursery to the industrial processing stage, a
number of environmental sustainability issues are encountered, including the use of artificial
fertilizers, pesticides, effluent discharge to natural water bodies and destruction of habitats for
wild animals. These concerns are common to most types of agriculture, and have seen farmers in
many parts of the world shifting their focus to more sustainable agriculture practices. This
chapter introduces the concept and measurement of sustainable agriculture, conceptual
framework of this study, frontier theory, and then discusses different ways of measuring
efficiency and their advantages and disadvantages.
2.2. Theories of Sustainable Agriculture
2.2.1. Concept of Sustainable Agriculture
For decades, agriculture has been a primary source of production to ensure man‘s
livelihood. Over a period of time, man has search for feasible methods of increasing food
productivity and hence significantly changed practices in agriculture. This has resulted in a
conventional agriculture which is highly specialized and inputs intensive. Conventional
agriculture is heavily dependent on synthetic chemicals and other off-farm inputs (Schaller
1993). Attempts to increase production in a complex ecosystem have therefore led to various
sustainability concerns as conventional agriculture is known to have adverse impacts on various
segments of life. Some of the problems associated with conventional agriculture were identified
by Schaller (1993) and Aldy et al. (1998), such as: contamination of ground and surface water
from agricultural chemicals and sediments; hazards to human and animal health from pesticides
and feed additives; adverse effects of agricultural chemicals on food safety and quality; loss of
the genetic diversity in plants and animals; destruction of wildlife including bees and beneficial
insects by pesticides; growing pest resistance to pesticides; reduced soil productivity due to soil
erosion; over-reliance on non-renewable resources, and health and safety risks incurred by farm
workers who apply potentially harmful chemicals. As a response to the deteriorating situation,
11
more efforts are now directed towards achieving sustainable agriculture. There have many
concepts about agricultural sustainability over last two decades.
“ A management strategy which helps the producers to choose hybrids and varieties, a
soil fertility package, a pest management approach, a tillage system, and a crop rotation to reduce
costs of purchased inputs, minimize the impact of the system on the immediate and the off-farm
environment, and provide a sustained level of production and profit from farming.” (Francis et
al. 1987);
Farming systems are sustainable if “they minimize the use of external inputs and
maximize the use of internal inputs already existing on the farm.” (Carter 1989);
“ (a) The development of technology and practices that maintain and/or enhance the
quality of land and water resources; and (b) the improvements in plants and animals and the
advances in production practices that will facilitate the substitution of biological technology for
chemical technology. ” (Ruttan 1988);
“An agriculture that can evolve indefinitely toward greater human utility, greater
efficiency of resource use, and a balance with the environment that is favorable both to humans
and to most other species.’ (Harwood 1990);
US Congress in the 1990 Farm Bill defined sustainable agriculture as:
“… an integrated system of plant and animal production practices having a site specific
application that will, over the long term: (a) satisfy human food and fiber needs; (b) enhance
environmental quality; (c) make efficient use of non-renewable resources and on-farm resources
and integrate appropriate natural biological cycles and controls; (d) sustain the economic
viability of farm operations; (e) enhance the quality of life for farmers and society as a whole”
cited in (Aldy et al. 1998).
“Practices that meet current and future societal needs for food and fiber, for ecosystem
services, and for healthy lives, and that do so by maximizing the net benefit to society when all
costs and benefits of the practices are considered.” (Tilman et al. 2002).
12
In spite of various concepts on sustainable agriculture, it can be viewed from “ecological,
social and economic perspectives, and should be assessed relative to all three” (Yunlong and
Smit 1994). Three dimensions of sustainable agriculture are mentioned by EUCommission
(2001) as follows:
1) The economic dimension relates to the efficient use of resources, the competitiveness and
the viability of the sector as well as its contributions to the viability of rural areas.
Efficient agricultural structures, appropriate technologies as well as the diversification of
income sources for farm households are important elements of this dimension. Efficiency
of resource use is an important basis for the viability of rural areas.
2) The ecological dimension refers above all to the management of natural resources with a
view to ensure that they are available in the future. However, it also includes issues such
as the protection of landscapes, habitats, biodiversity, as well as the quality of drinking
water and air.
3) The social dimension relates to maintenance and creation of employment and access to
resources and services of agricultural households compared to other economic agents in
rural area. The issues of equal opportunities and society´s ethical concerns regarding
agricultural production methods such as labor conditions, ethical production methods and
animal welfare can also be considered as belonging to the social dimension of sustainable
agriculture.
2.2.2. Agricultural sustainability measurement
A number of conceptual frameworks have been developed to help measure sustainability
such as: Pressure-State-Response (PSR), Driving forces-Pressures-State-Impacts-Responses
(DPSIR), pressure-State-Response-Effects (PSR/E), Pressure-State-Impacts-Response (PSIR)and
Driving force-State-Response (DSR).For example, Organization for Economic Cooperation and
Development (OECD) has developed a common framework called “driving force state response”
(DSR) to help in developing indicators. Driving force indicators refer to the factors that cause
changes in farm management practices and inputs use. State indicators show the effect of
agriculture on the environment such as soil, water, air, biodiversity, habitat and landscape.
Response indicators refer to the actions that are taken in response to the changing state of
environment. Using the DSR framework, OECD (1997) identified 39 indicators of issues such as
farm financial resources, farm management, nutrient use, pesticide use, water use, soil quality,
13
water quality, land conservation, greenhouse gases, biodiversity, landscape, wildlife habitats, and
farm’s contextual information, including socioeconomic background, land-use, and output. Other
conceptual framework for indicators useful in measuring sustainability of the social dimension is
the Sustainable Livelihoods framework (SLF), which has been used by the United Kingdom
(UK) Department for International Development (DFID) mostly in the rural areas (Figure 2.1)
Figure 2.1: Sustainable livelihood Analytical Framework
Source: DFID (1999)
There are two main general approaches to measuring sustainability in agricultural
production. The first involves the development of various indicators to describe differences
among farms or systems while the second is based on the production frontiers to derive
efficiency and productivity measures. Both approaches address the relative performance
comparison as well as the analysis of inter temporal changes in performance. Relative
performance comparison is useful in evaluating the performance of an individual farm relative to
a number of other farms. Temporal analysis facilitates measurement of the dynamics of
performance over time.
In the first approach, various parameters for measuring agricultural sustainability have
been proposed by scholars. Hayati, Ranjbar, and Karami (2010, page 76) introduced a review of
literature about scholars’ emphasis and their tendency toward to social, economic and ecological
components of agricultural sustainability (Table 2.1)
14
Table 2.1: Classification of scholars’ emphasis and their tendency toward
three components of agricultural sustainability according to a review of literatures
(Hayati, Ranjbar, and Karami (2010)
Sources
Component
Herzog and Gotsch (1998); Van Cauwenbergh et al. Social
(2007)
Herzog and Gotsch (1998)
Herzog and Gotsch (1998)
Herzog and Gotsch (1998); Rasul and Thapa (2003);
Van Cauwenbergh et al. (2007)
Ingels et al.(1997); Pannell and Glenn (2000);
Horrigan et al. (2002); Rasul and Thapa (2003)
Karami (1995); Ingels et al.(1997); RezaeiMoghaddam (1998); Norman et.al (2007);
Lyson (1998); Van Cauwenbergh et al. (2007)
Ingels et al.(1997); Van Cauwenbergh et al. (2007)
Becker (1997); Ingels et al.(1997); Van
Cauwenbergh et al. (2007)
Becker (1997); Rigby and Cáceres (2001); Rasul and
Thapa (2003); Rasul and Thapa (2004)
Hayati (1995); Nambiar et al. (2001); Rasul and Economic
Thapa (2003)
Becker (1997); Herzog and Gotsch (1998)
Herzog and Gotsch (1998); Van Cauwenbergh
et al. (2007)
Herzog and Gotsch (1998); Pannell and Glenn
(2000);
Nijkamp and Vreeker (2000); Van
Cauwenbergh et al. (2007)
Becker (1997); Herzog and Gotsch (1998);
Nijkamp and Vreeker (2000); Van Cauwenbergh et
al. (2007)
Karami (1995); Herzog and Gotsch (1998); Lyson
(1998); Smith and McDonald (1997); Comer
et al. (1999); Pannell and Glenn (2000);
Rigby et al. (2001); De Koeijer et al. (2002);
Rasul and Thapa (2003); Van Passel et al.
(2007); Gafsi et al. (2006)
Herzog and Gotsch (1998)
Herzog and Gotsch (1998); Rasul and Thapa (2003)
Smith and McDonald (1998); Van Cauwenbergh et
al. (2007)
Karami (1995); Nijkamp and Vreeker (2000);
Van Cauwenbergh et al. (2007)
Hayati (1995); Becker (1997); Ingels et al. (1997);
Bouma and Droogers (1998); Pannell and
Glenn (2000); Sands and Podmore (2000);
Bosshard (2000); Nambiar et al. (2001);
Horrigan et al. (2002); Rasul and Thapa
(2003); Van Cauwenbergh et al. (2007)
15
Parameters
The education level of the
household members
Housing facilities
Work study
Nutritional/health status of the
family members
Improved decision making
Improved the quality of
rural life
Working and living conditions
Participation/social
Capital
Social equity
Average of crop production
Expenses for input
Monetary income from outside the
farm
Monetary income from the farm
Economic efficiency
Profitability
The salaries paid to farm workers
Employment opportunities
Market availability
Land ownership
Soil management
Table 2.1 (continued)
Sources
Hayati (1995); Ingels et al. (1997); Gafsi et al.
(2006); Van Cauwenbergh et al. (2007)
Hayati (1995); Rezaei-Moghaddam (1997); Ingels et
al. (1997); Norman et al. (1997); Pannell and
Glenn (2000); Rasul and Thapa (2004)
Saltiel et al. (1994); Hayati (1995); Norman et al.
(1997); Bosshard (2000)
Senanayake (1991); Saltiel et al. (1994); Hayati
(1995)
Ingels et al. (1997); Herzog and Gotsch (1998))
Herzog and Gotsch (1998); Rasul and Thapa (2003)
Senanayake (1991); Saltiel et al. (1994); Ingels et al.
(1997);Comer et al. (1999); Praneetvatakul et
al. (2001); Nambiar et al. (2001); Horrigan et
al. (2002); Rasul and Thapa (2003))
Saltiel et al. (1994); Rasul and Thapa (2003)
Saltiel et al. (1994)
Saltiel et al. (1994); Hayati (1995); Comer et al.
(1999); Horrigan et al. (2002); Rasul and
Thapa (2003)
Nijkamp and Vreeker (2000); Rasul and Thapa
(2003); Rasul and Thapa (2004)
Smith and McDonald (1998); Van Cauwenbergh et
al. (2007)
Hayati (1995); Rezaei-Moghaddam (1997); Ingels et
al. (1997)
Hayati (1995); Ingels et al. (1997); Comer et al.
(1999); Horrigan et al. (2002);
Hayati (1995); Ingels et al. (1997); Rasul and Thapa
(2003); Gafsi et al. (2006); Van Cauwenbergh
et al. (2007)
Senanayake (1991); Pannell and Glenn (2000)
Senanayake (1991); ); Ingels et al. (1997); Norman
et al. (1997); Nambiar et al. (2001); Van
Cauwenbergh et al. (2007))
Ingels et al. (1997); Norman et al. (1997); Comer et
al. (1999); Horrigan et al. (2002); Rasul and
Thapa (2003)
Pannell and Glenn (2000); Sands and Podmore
(2000); Van Cauwenbergh et al. (2007)
Pannell and Glenn (2000)
Comer et al. (1999); Praneetvatakul et al. (2001);
Horrigan et al. (2002); Rasul and Thapa
(2003)
Component
Ecological
Parameters
Improve water resource
management
Usage of pesticides,
herbicides and fungicides
Usage of animal/organic
Manures
Usage of green manures
Physical inputs and efficient use
of input
Physical yield
Crop diversification
Ecological
Use of alternative crop
Usage of fallow system
Crop rotation
Cropping pattern
Trend of change in climatic
conditions
Usage of chemical fertilizer
Conservational tillage
(no/minimum tillage)
Control erosion
Microbial biomass within the soil
Energy
Cover crop/Mulch
Depth of groundwater table
Protein level of crops
Integrated pest management
16