Business Making Decision Assignment 2 BTEC Nguyen Huu Phong 2017
Bạn đang xem bản rút gọn của tài liệu. Xem và tải ngay bản đầy đủ của tài liệu tại đây (867.01 KB, 13 trang )
Content
Introduction 2
2.4 The salary and work experience graph of 15 officers 3
3.1 Relationship between salary and work experiences 6
3.2 Forecasting salary and work experience 6
3.3 Prepare a business presentation using suitable software and
technique to disseminate information effectively 7
3.4 Produce a formal business report 10
Conclusion 12
References 13
1
Introduction
Salary and experience is always two factors that a business and an employee cares. The salary and experience
always had an intimate relationship with the following from proportional to the inverse ratio. In this report, I
will analyze two factors based on a data table that I have just received. This survey data tables based on 15
people surveyed on the salary and experience. We will go further in each section to see this relationship.
Task 2.4: The salary and work experience graph of 15 officers
The following is a table of data that it is based on 15 surveys provided to us specifically on wages and their
working experience.
Salary
work
(million
Experiences
No VND) Y
Gender
(year) X
1
23
1
1
2
19.5
1
0
3
24
2
1
4
21
2
0
5
25
3
1
6
22
3
0
7
26.5
4
1
8
23.1
4
0
9
25
5
0
10 28
5
1
11 29.5
6
1
12 26
6
0
13 27.5
7
0
14 31.5
7
1
15 29
8
0
Based on this data, we can see the work experiences of 15 persons are stretching from 1 to 8 years with the
lowest wages from 19.5 million VND and the highest is 31.5 million VND. Accordingly, we can see the wage
of 15 persons are in high-wage survey compared to the average wage in Vietnam. According to the survey of
JS, the average salary in Vietnam is only 384 - 582 USD. Next, based on the wage from 19.5 to 31.5, the number
of years of experience from 1 to 8 also shows the proportion of each other, we will see in the following section
is based on the diagram.
2
Salary Graph:
Salary
35
30
Salary (million VND)
Salary
(million
No VND)
1
23
2
19.5
3
24
4
21
5
25
6
22
7
26.5
8
23.1
9
25
10 28
11 29.5
12 26
13 27.5
14 31.5
15 29
25
20
26.5
25
24
23
31.5
29.5
27.5
23.1
22
21
19.5
28
29
26
25
15
10
5
0
1
2
3
4
5
6
7
8
9
10
11
12
13
14
15
Salary
Through the graph, we can see people surveyed had salary ranges from 19.5 million VND in the lowest and the
highest is 31.5 million VND. Salary can be evaluated is high compared to common ground and higher than the
average wage of Vietnam. However, this also shows a positive sign is that wages are rising each day each hour.
Go back to the chart, the highest salary is 31.5 million VND and 1.61 times higher than 19.5 million VND and
concentrate at levels from 22 to 29.5 million VND. Low-wage or high depending on the level of work, working
hours, work efficiency and of course depend very much on work experience. High wages like this also shows
the skill level and experience working as well in average.
3
8
Experiences (years)
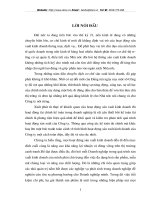
Experiences Graph:
Experiences
No
(year)
1
1
2
1
3
2
4
2
5
3
6
3
7
4
8
4
9
5
10
5
11
6
12
6
13
7
14
7
15
8
1
1
1
2
2
2
3
4
3
3
5
6
4
4
7
8
5
5
9
10
6
6
11
12
7
7
13
14
15
Experiences
According to the arrangement of work experience from low to high so I easily look out is work experience of
15 people surveyed increased gradually from 1 to 8 years. The difference of up to 1/8 also shows the work
experience of 15 different people very much when people most highly experienced 8 years and who have
experienced low for only 1 year. Work experience is an extremely important factor that has any odd-a business
would also like to have people who actually have experience in the field that they need. The experience is too
low is also a risk if a business wants to choose, businesses need training and observed throughout the initial
process of the employee. However, a few businesses also desire to have people with little experience to get the
creative, dare dare think of doing.
Salary and Experiences of 15 officers:
No
Experiences Salary
1
1
23
2
1
19,5
3
2
24
4
2
21
5
3
25
6
3
22
7
4
26,5
8
4
23,1
9
5
25
10
5
28
11
6
29,5
4
12
13
14
15
6
7
7
8
26
27,5
31,5
29
Salary and Experiences
35
30
25
20
15
10
5
0
1
2
3
4
5
6
7
8
Experiences
9
10
11
12
13
14
15
Salary
Mix two elements are salary and experience working together, we can easily see the connection between the
two elements. The arrangement of the five experiences of 15 persons according to a high level from 1 to 8, their
salaries under which also increases from 19.5 million VND to 31.5 million VND. The this wage although
uneven and there is the occasional high low but overall still wage increases based on the number of years of
work experience. Here is a normal element in the retail business, when a person who has experience and
expertise in a field in a long time, then their wages will increase according to the proportional due to enhanced
capabilities. However, looking out over whether the proportionality has also been maintained or not, the answer
may be not because of salary will only increase to a certain level and then stagnated and would no longer
proportional to the number of years of experience.
5
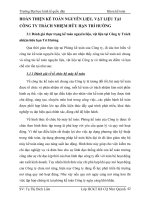
3.1 Relationship between salary and work experiences
Salary and Experiences
y = 1.283x + 19.899
R² = 0.7354
35
30
Salary
25
20
Salary
15
Linear (Salary)
10
5
0
0
1
2
3
4
5
6
7
8
9
Experiences
The chart describes the relationship between salary and experiences
- Formula analysis : y = 1,283x + 19,899 and R² = 0,73541
- Inside that:
+ x : is independence variable, is a variable, what is not changed
when an other variable was changed. In this case, independence
variable is the years of experiences.
+ y : is dependence variable, is a variable, what is changed depend
on changing of an other variable. In this case, dependence variable
is salary
+ Following the formula, salary is depended on experiences
+ R2 : is reliability analysis. This is the average percentage of
accuracy of obtained result compare with reality.
Relationship between salary and work experiences:
- a<0: Negative relationship
- a>0: Positive relationship
In this case, we can see a = 1,283 >0. It shows the relationship between salary and work experiences is the
positive relationship
Task 3.2 Forecasting salary and work experience
6
Based on the regression formula, we can forecast the salary based on working experience, following the formula
y = 1.283*x + 19.899.
We have y = 1.283*x + 19.899
y: data on theory; y’: data on reality
When we choose x1 = 3 then y1= 23.748%. But y1' = 25%
When we choose x2= 7 then y2 = 30.163%. But y2' = 27.5%
We easily see that the actual data is always less or more difference than the theoretical data. The difference
more or less depends on the reliability of R2. Here R2 = 0.7354 or 73.64% equivalent should the result between
the theory into reality is not much different. Based on this high or low R2 so that we can assess the level of
change and reliable.
Task 3.3: Prepare a business presentation using suitable software and
technique to disseminate information effectively
SUMMARY OUTPUT
Regression Statistics
Multiple R 0.85756
R Square
0.73541
Adjusted R
Square
0.715057
Standard
Error
1.797622
Observation
s
15
ANOVA
df
Regression
Residual
Total
1
13
14
116.761
42.0088
158.769
Coefficient
s
Intercept
SS
Standard
Error
19.89925 1.02213
MS
F
36.132
6
116.76
3.2314
t Stat
Significanc
eF
4E-05
P-value Lower 95%
5.3E11 17.691
19.468
7
Upper Lower
Upper
95%
95.0% 95.0%
22.10 17.691 22.107
7
1
4
X Variable
1
1.282989 0.21344
4.4E05 0.8219
6.011
RESIDUAL OUTPUT
Observation
1
2
3
4
5
6
7
8
9
10
11
12
13
14
15
Predicted
Y
21.18224
21.18224
22.46523
22.46523
23.74821
23.74821
25.0312
25.0312
26.31419
26.31419
27.59718
27.59718
28.88017
28.88017
30.16316
Residual
s
1.81776
-1.6822
1.53477
-1.4652
1.25179
-1.7482
1.4688
-1.9312
-1.3142
1.68581
1.90282
-1.5972
-1.3802
2.61983
-1.1632
Standard
Residuals
1.0494
-0.971
0.886
-0.846
0.7226
-1.009
0.8479
-1.115
-0.759
0.9732
1.0985
-0.922
-0.797
1.5124
-0.671
8
1.744
1
0.8218
8
1.7441
9
3.4 Produce a formal business report
Presentation Slides
10
11
Conclusion
Through this report, we can easily notice the relationship between salary and experience. Specifically
in this case, the salary depends on experience, when the number of years of experience increased the
wages also increased.
12
References
Linh, H. and Nguyen, B. (2016) Vietnam's salary is across Indonesia, lower than many
countries, Available at: (Accessed: 12 April 2017)
13