College algebra 4th edition blitzer test bank
Bạn đang xem bản rút gọn của tài liệu. Xem và tải ngay bản đầy đủ của tài liệu tại đây (1.03 MB, 96 trang )
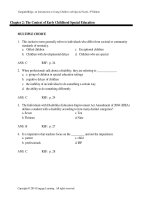
Ch. 1 Equations and Inequalities
1.1 Graphs and Graphing Utilities
1 Plot Points in the Rectangular Coordinate System
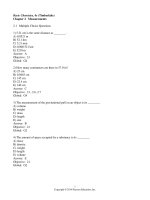
MULTIPLE CHOICE. Choose the one alternative that best completes the statement or answers the question.
Plot the given point in a rectangular coordinate system.
1) (4, 1)
y
6
4
2
-6
-4
-2
2
4
x
6
-2
-4
-6
A)
B)
y
-6
-4
y
6
6
4
4
2
2
-2
2
4
6
x
-6
-4
-2
-2
-2
-4
-4
-6
-6
C)
2
4
6
x
2
4
6
x
D)
y
-6
-4
y
6
6
4
4
2
2
-2
2
4
6
x
-6
-4
-2
-2
-2
-4
-4
-6
-6
Page 1
2) (-6, 3)
y
6
4
2
-6
-4
-2
2
4
x
6
-2
-4
-6
A)
B)
y
-6
-4
y
6
6
4
4
2
2
-2
2
4
6
x
-6
-4
-2
-2
-2
-4
-4
-6
-6
C)
2
4
6
x
2
4
6
x
D)
y
-6
-4
y
6
6
4
4
2
2
-2
2
4
6
x
-6
-4
-2
-2
-2
-4
-4
-6
-6
Page 2
3) (1, -4)
y
6
4
2
-6
-4
-2
2
4
x
6
-2
-4
-6
A)
B)
y
-6
-4
y
6
6
4
4
2
2
-2
2
4
6
x
-6
-4
-2
-2
-2
-4
-4
-6
-6
C)
2
4
6
x
2
4
6
x
D)
y
-6
-4
y
6
6
4
4
2
2
-2
2
4
6
x
-6
-4
-2
-2
-2
-4
-4
-6
-6
Page 3
4) (-1, -4)
y
6
4
2
-6
-4
-2
2
4
x
6
-2
-4
-6
A)
B)
y
-6
-4
y
6
6
4
4
2
2
-2
2
4
6
x
-6
-4
-2
-2
-2
-4
-4
-6
-6
C)
2
4
6
x
2
4
6
x
D)
y
-6
-4
y
6
6
4
4
2
2
-2
2
4
6
x
-6
-4
-2
-2
-2
-4
-4
-6
-6
Page 4
5) (0, -4)
y
6
4
2
-6
-4
-2
2
4
x
6
-2
-4
-6
A)
B)
y
-6
-4
y
6
6
4
4
2
2
-2
2
4
6
x
-6
-4
-2
-2
-2
-4
-4
-6
-6
C)
2
4
6
x
2
4
6
x
D)
y
-6
-4
y
6
6
4
4
2
2
-2
2
4
6
x
-6
-4
-2
-2
-2
-4
-4
-6
-6
Page 5
6) (-4, 0)
y
6
4
2
-6
-4
-2
2
4
x
6
-2
-4
-6
A)
B)
y
-6
-4
y
6
6
4
4
2
2
-2
2
4
6
x
-6
-4
-2
-2
-2
-4
-4
-6
-6
C)
2
4
6
x
2
4
6
x
D)
y
-6
-4
y
6
6
4
4
2
2
-2
2
4
6
x
-6
-4
-2
-2
-2
-4
-4
-6
-6
Page 6
9
3
7) - , -
2
2
y
6
4
2
-6
-4
-2
2
4
x
6
-2
-4
-6
A)
B)
y
-6
-4
y
6
6
4
4
2
2
-2
2
4
6
x
-6
-4
-2
-2
-2
-4
-4
-6
-6
C)
2
4
6
x
2
4
6
x
D)
y
-6
-4
y
6
6
4
4
2
2
-2
2
4
6
x
-6
-4
-2
-2
-2
-4
-4
-6
-6
Page 7
5
8) - , 0
2
y
6
4
2
-6
-4
-2
2
4
x
6
-2
-4
-6
A)
B)
y
-6
-4
y
6
6
4
4
2
2
-2
2
4
6
x
-6
-4
-2
-2
-2
-4
-4
-6
-6
C)
2
4
6
x
2
4
6
x
D)
y
-6
-4
y
6
6
4
4
2
2
-2
2
4
6
x
-6
-4
-2
-2
-2
-4
-4
-6
-6
Page 8
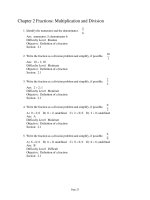
2 Graph Equations in the Rectangular Coordinate System
MULTIPLE CHOICE. Choose the one alternative that best completes the statement or answers the question.
Graph the equation.
1) y = x + 3
6
y
4
2
-6
-4
-2
2
4
6 x
-2
-4
-6
A)
B)
6
-6
-4
y
6
4
4
2
2
-2
2
4
6 x
-6
-4
-2
-2
-2
-4
-4
-6
-6
C)
y
2
4
6 x
2
4
6 x
D)
6
-6
-4
y
6
4
4
2
2
-2
2
4
6 x
-6
-4
-2
-2
-2
-4
-4
-6
-6
Page 9
y
2) y = 4x - 3
y
6
4
2
-6
-4
-2
2
4
x
6
-2
-4
-6
A)
B)
y
-6
-4
y
6
6
4
4
2
2
-2
2
4
6
x
-6
-4
-2
-2
-2
-4
-4
-6
-6
C)
2
4
6
x
2
4
6
x
D)
y
-6
-4
y
6
6
4
4
2
2
-2
2
4
6
x
-6
-4
-2
-2
-2
-4
-4
-6
-6
Page 10
1
3) y = - x + 3
3
y
6
4
2
-6
-4
-2
2
4
x
6
-2
-4
-6
A)
B)
y
y
-6
-4
6
6
4
4
2
2
-2
2
4
6
x
-6
-4
-2
-2
-2
-4
-4
-6
-6
C)
2
4
6
x
2
4
6
x
D)
y
-6
-4
y
6
6
4
4
2
2
-2
2
4
6
x
-6
-4
-2
-2
-2
-4
-4
-6
-6
Page 11
4) y = x2 - 1
y
10
5
-10
-5
5
10
x
-5
-10
A)
B)
y
-10
y
10
10
5
5
-5
5
10
x
-10
-5
-5
-5
-10
-10
C)
5
10
x
5
10
x
D)
y
-10
y
10
10
5
5
-5
5
10
x
-10
-5
-5
-5
-10
-10
Page 12
5) y = x3 - 5
6
y
4
2
-6
-4
-2
2
4
6 x
-2
-4
-6
A)
B)
6
-6
-4
y
6
4
4
2
2
-2
2
4
6 x
-6
-4
-2
-2
-2
-4
-4
-6
-6
C)
y
2
4
6 x
2
4
6 x
D)
6
-6
-4
y
6
4
4
2
2
-2
2
4
6 x
-6
-4
-2
-2
-2
-4
-4
-6
-6
Page 13
y
6) y = - x - 7
y
10
5
-10
-5
5
10
x
-5
-10
A)
B)
y
-10
y
10
10
5
5
-5
5
10
x
-10
-5
-5
-5
-10
-10
C)
10
x
5
10
x
D)
y
-10
y
10
10
5
5
-5
5
10
x
-10
-5
-10
-10
y
10
5
-5
-5
-5
7) y = 3|x|
-10
5
5
10
x
-5
-10
Page 14
A)
B)
y
-10
y
10
10
5
5
-5
5
10
x
-10
-5
-5
-5
-10
-10
C)
5
10
x
5
10
x
D)
y
-10
y
10
10
5
5
-5
5
10
x
-10
-5
-5
-5
-10
-10
Page 15
8) y = -6
y
10
5
-10
-5
5
10
x
-5
-10
A)
B)
y
-10
y
10
10
5
5
-5
5
10
x
-10
-5
-5
-5
-10
-10
C)
5
10
x
5
10
x
D)
y
-10
y
10
10
5
5
-5
5
10
x
-10
-5
-5
-5
-10
-10
Page 16
9) y =
1
x
y
10
5
-10
-5
5
10
x
-5
-10
A)
B)
y
y
-10
10
10
5
5
-5
5
10
x
-10
-5
-5
-5
-10
-10
C)
5
10
x
5
10
x
D)
y
y
-10
10
10
5
5
-5
5
10
x
-10
-5
-5
-5
-10
-10
Page 17
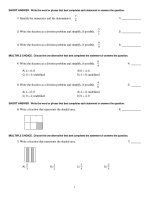
Write the English sentence as an equation in two variables. Then graph the equation.
10) The y-value is five more than three times the x-value.
y
6
4
2
-6
-4
-2
2
4
x
6
-2
-4
-6
B) y = -3x + 5
A) y = 3x + 5
y
-6
-4
y
6
6
4
4
2
2
-2
2
4
6
x
-6
-4
-2
-2
-2
-4
-4
-6
-6
C) y = -3x - 5
-4
4
6
x
2
4
6
x
D) y = 3x - 5
y
-6
2
y
6
6
4
4
2
2
-2
2
4
6
x
-6
-4
-2
-2
-2
-4
-4
-6
-6
Page 18
11) The y-value is three decreased by the square of the x-value.
8
y
6
4
2
-8
-6
-4
-2
2
4
8 x
6
-2
-4
-6
-8
B) y = 3 - x
A) y = 3 - x2
8
-8
-6
-4
y
8
6
6
4
4
2
2
-2
2
4
6
8 x
-8
-4
-2
-2
-4
-4
-6
-6
-8
-8
2
4
6
8 x
2
4
6
8 x
D) y = x - 3
8
-6
-4
-2
C) y = x2 - 3
-8
-6
y
y
8
6
6
4
4
2
2
-2
2
4
6
8 x
-8
-6
-4
-2
-2
-2
-4
-4
-6
-6
-8
-8
Page 19
y
3 Interpret Information About a Graphing Utilityʹs Viewing Rectangle or Table
MULTIPLE CHOICE. Choose the one alternative that best completes the statement or answers the question.
Match the correct viewing rectangle dimensions with the figure.
1)
A) [-10, 10, 2] by [-10, 10, 2]
B) [-2, 2, 2] by [-2, 2, 2]
C) [-20, 10, 2] by [-20, 10, 2]
D) [-10, 10, 4] by [-10, 10, 4]
A) [-2, 16, 2] by [-8, 10, 2]
B) [-2, 16, 2] by [-2, 16, 2]
C) [-8, 10, 2] by [-2, 16, 2]
D) [-20, 10, 2] by [-20, 10, 2]
A) [-4, 4, 2] by [-80, 80, 8]
B) [-16, 16, 4] by [-4, 4, 2]
C) [-4, 4, 2] by [-4, 4, 2]
D) [-20, 20, 2] by [-20, 20, 2]
2)
3)
Page 20
4)
A) [-20, 60, 20] by [-800, 1000, 200]
B) [-2, 16, 2] by [-2, 16, 2]
C) [-2, 10, 2] by [-8, 16, 2]
D) [-20, 10, 2] by [-20, 10, 2]
The table of values was generated by a graphing utility with a TABLE feature. Use the following table to solve.
5) Which equation corresponds to Y2 in the table?
A) y2 = 2x + 3
C) y2 = x + 2
B) y2 = 2 - 3x
D) y2 = 2x - 3
6) Does the graph of Y2 pass through the origin?
A) No
B) Yes
7) At which points do the graph of Y1 and Y2 intersect?
A) (-1, 1) and (3, 9)
B) (2, 7) and (2, 4)
C) (-1, 1) and (2, 7)
D) (2, 4) and (3, 9)
C) -1 and -2
D) -2 and 1
8) For which values of x is Y1 = Y2 ?
A) -1 and 3
B) -2 and 3
Page 21
4 Use a Graph to Determine Intercepts
MULTIPLE CHOICE. Choose the one alternative that best completes the statement or answers the question.
Use the graph to determine the x- and y-intercepts.
1)
y
10
5
-10
-5
5
10
x
-5
-10
A) x-intercept: -1; y-intercept: 8
B) x-intercept: 1; y-intercept: 8
C) x-intercept: -1; y-intercept: -8
D) x-intercept: -8; y-intercept: 8
2)
y
10
5
-10
-5
5
10
x
-5
-10
A) x-intercepts: -3, 3; y-intercept: -3
B) x-intercepts: -3, 3
C) y-intercept: -3
D) x-intercepts: -3, 3; y-intercept: 0
Page 22
3)
y
10
5
-10
-5
5
10
x
-5
-10
A) x-intercepts: -3, 1; y-intercept: 3
B) x-intercept: -3; y-intercepts: 1, 3
C) x-intercept: 3; y-intercepts: -3, 1
D) x-intercept: 1; y-intercept: 3
4)
y
10
5
-10
-5
5
10
x
-5
-10
A) x-intercept: -4
B) y-intercept: -4
Page 23
C) x-intercept: 4
D) y-intercept: 4
5)
y
10
5
-5
-10
5
10
x
-5
-10
A) x-intercept: 1; y-intercept: -1
B) x-intercept: 1; y-intercept: 1
C) x-intercept: -1; y-intercept: -1
D) x-intercept: -1; y-intercept: 1
6)
10
y
5
-10
-5
5
x
-5
-10
A) x-intercepts: -4, 1, 5; y-intercept: 4
B) x-intercept: 4; y-intercepts: -4, 1, 5
C) x-intercepts: 4, 1, -5; y-intercept: 4
D) x-intercept: 4; y-intercepts: 4, 1, -5
Page 24
7)
y
10
5
-10
-5
5
10
x
-5
-10
A) x-intercepts: -3, 3; y-intercepts: -7, 7
B) x-intercepts: -3, 3
C) y-intercepts: -7, 7
D) x-intercepts: -7, 7; y-intercepts: -3, 3
5 Interpret Information Given by Graphs
MULTIPLE CHOICE. Choose the one alternative that best completes the statement or answers the question.
The line graph shows the recorded hourly temperatures in degrees Fahrenheit at an airport.
1) At what time was the temperature the highest?
A) 1 p.m.
B) 5 p.m.
C) 11 a.m.
D) 2 p.m.
C) 4 p.m.
D) 1 p.m.
C) 71 ° F
D) 74 ° F
2) At what time was the temperature its lowest?
A) 9 a.m.
B) 6 p.m.
3) What temperature was recorded at 10 a.m.?
A) 73 ° F
B) 75 ° F
Page 25