DSpace at VNU: Greenhouse Gas Development of Equations for Estimating Greenhouse Gas Emisions from the Son La Hydropower Reservoir
Bạn đang xem bản rút gọn của tài liệu. Xem và tải ngay bản đầy đủ của tài liệu tại đây (580.7 KB, 11 trang )
VNU Journal of Science: Earth and Environmental Sciences, Vol. 33, No. 2 (2017) 60-70
Development of Equations for Estimating Greenhouse Gas
Emisions from the Son La Hydropower Reservoir
Nguyen Thi The Nguyen1, Pham Van Hoang2, Nguyen Manh Khai3,*
1
Water Resources University, Tay Son, Dong Da, Hanoi, Vietnam
Union of Science and Technology Vietnam, Xuan Dinh, Tay Ho, Hanoi, Vietnam
3
VNU University of Science, 334 Nguyen Trai, Thanh Xuan, Hanoi, Vietnam
2
Received 17 April 2017
Revised 28 April 2017; Accepted 28 June 2017
Abstract: Emissions of greenhouse gases such as CO2 and CH4 from artificial reservoirs,
especially wide lakes in the tropics as the Son La hydropower reservoir, are leading to global
warming. CO2 and CH4 gases in hydropower reservoirs are caused by the decomposition of
organic matter in the lakes. In this study, regression analysis was used for estimating the
relationships among water quality parameters measured at the Son La hydropower reservoir and
the fluxes of greenhouse gas emissions from the reservoir. The regression analysis was also
applied to develop regression equations predicting emissions of greenhouse gases from the lake.
Results of study showed that the CO2 emission from the Son La hydropower reservoir could be
predictable from several water quality parameters of which 4 main factors are temperature, DO,
alkalinity andpH. The amount of CH4 emission from the Son La hydropower reservoir has solid
relationships with 3 main factors, including temperature, COD and pH. The regression equations
predicting CO2 and CH4 with the correlation coefficient of 0.93 and 0.92 have been tested with
real data and gave the good results. Since, they could be introduced in reality.
Keywords: Greenhouse gas, hydropower reservoirs, water quality, regression equation.
1. Introduction
harmful in terms of greenhouse gas emissions.
Currently, hydroelectric power meets about
16% of the power supply of the world [2]. For
countries which are dependent on hydroelectric
energy, this kind of enerry souce accounts for
90%. Previously, hydroelectric energy are not
considered as greenhouse gas emissions.
However, recent studies showed that
hydropower reservoirs could produce more
carbon into the atmosphere than natural
systems, especially in the first twentyyears after
flooding [3]. This is mainly due to the usually
excessive availability of decomposable organic
matter in hydroelectric reservoirs. Not only
Energy sources which are generated from
burning fossil fuel provide about 68% of global
electricity in 2007 and are responsible for most
of the anthropogenic greenhouse gas emissions
to the atmosphere (accounts for approximately
40% [1]). Compared to fossil fuels, hydropower
has been considered an attractive renewable
energy source with the advantage of being less
_______
Corresponding author. Tel.: 84-913369778
Email:
/>
60
N.T.T. Nguyen et al. / VNU Journal of Science: Earth and Environmental Sciences, Vol. 33, No. 2 (2017) 60-70
large amounts of soil and terrestrial vegetation
are flooded by damming rivers, but terrestrial
organic matter derived from land erosion is
continuously flushed into reservoirs as well.
The usually high water residence time in
reservoirs as compared to rivers, combined with
high inorganic nutrient inputs, favors organic
matter decomposition and, thus, the production
of two major greenhouse gases – carbon
dioxide (CO2) and methane (CH4). The amount
of CO2 and CH4 emitted varies (a) among
reservoirs (as function of drainage basin
characteristics, reservoir morphology, climate,
etc.); (b) within reservoirs (along longitudinal
gradients from the tributaries to the dam, before
and after the dam, etc.); and (c) over time (with
reservoir aging, seasonally, daily, with changes
in anthropogenic activities in the drainage
basin, and with dam operation depending on
energy needs and precipitation regime) [4].
Attempts to estimate the amounts of CO2 and
CH4 emitted to the atmosphere should consider
such variability which makes it a complex task.
Today, there are at least 45,000 large
hydroelectric reservoirs operating in the world
[5]. The area of those lakes in the world is
estimated at about 350.000km2 [5]. The lakes
which have large storage capacity need to be
examined the impact on global warming.
The ever increasing global energy demand
and the concern about the changes in
environment have lead to an urge to assess the
hydropower „footprint‟ in terms of greenhouse
gas emissions to the atmosphere. Since the
early 90‟s the role of hydroelectric reservoirs as
sources or, as the opposite, sinks of greenhouse
gases has rapidly become a global topic of
investigation. The first studies of greenhouse gas
fluxes from reservoirs focused on hydroelectric
generation because it was, and still is, widely
viewed as a carbon-free source of energy [6].
This view likely originated because before 1994,
there were no data available on CO2 and CH4
emissions from reservoirs, even though it was
well known that oxygen depletion resulting from
active decomposition of flooded organic matter
was common in waters of newly constructed
61
reservoirs. The first discussion of greenhouse gas
emissions from reservoirs pointed out that
greenhouse gas production per unit of power
generated [6]. Then, there were many studies of
greenhouse gas fluxes from reservoirs located in
Canada [6], Brazil, Panama and French Guiana.
Later, reservoirs in Finland, USA and
Switzerland, China were studied. In the world
until 2012, there were at least 85 research reports
which focused on greenhouse gas from
hydropower reservoirs [7].
In recent years, Vietnam has been facing
growing manifestations of climate change. The
natural conditions and especially the human
activities including hydropower reservoirs have
been caused impacts on the process of climate
change. Following the Convention of the
United Nations Framework on Climate Change
(UNFCCC), Vietnam has established the
National Communications (NCs) and Biennial
Update Reports (BURs), including national
inventory results on greenhouse gas emissions.
Greenhouse gas emissions in Vietnam are
estimated by following fields: energy, industrial
processes, agriculture, land use changes and
agricultural land use (LULUCF) and waste. So
far, there is no official result for the inventory
of greenhouse gas emissions in the field of
hydropower.
The Son La hydroelectric reservoir, which
is the largest one in Vietnam, has a catchment
area of 43.760 km2. It is also the largest
reservoir in the field of capacity in Southeast
Asia. To date, the Son La hydropower plant has
been put into operation for about 5 years.
Therefore it is necessary to access the
possibility of greenhouse gas emissions from
the reservoir and to set environmental
management measures.
From the above requirements, this study
was conducted to evaluate the possibility of
greenhouse gas emissions and to develop
equations for predicting the greenhouse gas
emissions of CO2 and CH4 from the Son La
hydropower reservoir. The research contributes
to clarify the forecasting method of greenhouse
gas emissions based on basic water quality
62
N.T.T. Nguyen et al. / VNU Journal of Science: Earth and Environmental Sciences, Vol. 33, No. 2 (2017) 60-70
parameters in the Son La hydropower reservoir
as well as other lakes located in the tropical
areas. Currently, water quality monitoring is
carried out periodically at hydropower
reservoirs and it is done more favorably than
that of CO2 and CH4. Thus the results of the
study will help to take full advantage of
periodically measured results of water quality
following the Environmental Protection Law
No. 55/2014 / QH13 2014 at the hydropower
reservoirs to predict CO2 and CH4 emissions
without continuous monitoring of those gases.
2. Study area and methods
2.1. Study area and object
The Son La hydropower plant is located at
It Ong commune, Muong La district, Son La
province. After seven years of construction, the
Son La hydropower reservoir was inaugurated
on December 23, 2012. The scale of the
reservoir is as follows: the normal water level is
215m, the dead water is 175m, the installed
capacity is 2,400 MW, the average power
output is 9429 million kWh annually. The total
reservoir capacity is 9260 million m3, the useful
capacity is 6504 million m3. The catchment area
of 43760 km2 is located in three provinces of
Son La, Dien Bien, Lai Chau. The lake has the
largest width of about 1.5 km and 120km in
length from the dam at the town of It Ong,
Muong La district, Son La province to back up
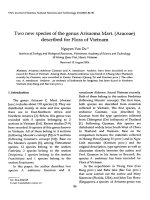
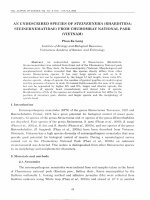
upstream at Lai Chau province. Diagram of the
Son La hydropower reservoir is presented in
Figure 1.
This paper focuses on CO2 and CH4 gases
which are two major ones standing at the top of
the list of greenhouse gases on the Earth.
Besides, fundamental water quality parameters
monitored periodically in the Son La
hydropower reservoir related to greenhouse gas
emissions are also taken into consideration.
2.2. Methods of study
2.2.1. Methods of sampling, sample
preservation and determination of water quality
Sample collection, preservation and
analysis of surface water quality carried out
under the guidance of national technical
regulations. The water quality parameters were
analyzed including temperature, pH, TDS,
conductivity, alkalinity, DO, COD, total
nitrogen, PO43-. The water samples were
collected at six locations as shown in Figure 1,
in which the sampling locations C1, C2, C3, C5
are the effluents into the reservoir, C4 is in the
middle of the reservoir and C6 is after the Son
La dam. Sampling periods are the dry seasons
(March) and the rainy seasons (August) in the
years 2014 and 2015. The analysis was
conducted at the laboratory of the Centre for
Environmental Research, Institute Meteorology,
Hydrology and Environment.
2.2.2. Sampling and determining methods of
the greenhouse gases
Fluxes of greenhouse gases from water
surfaces can be quantified using a number of
techniques [8]. In this study, floating static
chambers have been used to estimate the
diffusive flux of CO2 and CH4 from the surface
of reservoirs by calculating the linear rate of gas
accumulation in the chambers over time.
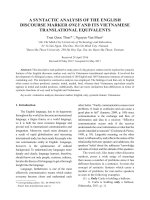
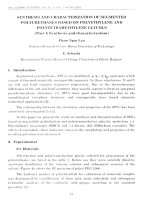
CO2 gas is collected following the method
of air sampling in the sealed chamber Rolston
(1986) [9], and is determined by applying the
method under the ISO 5563-199. The size of
CO2 collecting box is as follows: the box
diameter is 30 (cm), the box height is 20 (cm),
of which the submerged part is 7cm, the useful
height is 13cm. The air in the sealed container
was sucked by the Kimoto -HS7 machine with
the rate of 2 liters of gas per minute and is
absorbed by Ba(OH)2 solution. The air through
the air receiver without CO2 continues to return
the sealed container to push the remaining CO2
in the box. Sampling time is 10 minutes. CO2
samples were collected at the same places and
time with the water quality samples. After CO2
is absorbed by Ba(OH)2 solution, excess
Ba(OH)2 is titrated by oxalic acid.
N.T.T. Nguyen et al. / VNU Journal of Science: Earth and Environmental Sciences, Vol. 33, No. 2 (2017) 60-70
63
C3
C1
C2
C4
C6
C5
Figure 1. Location map of Son La hydropower reservoir and water quality collection points
determine the initial amount of CH4 contained
in sealed container), 10 minutes and 20
minutes. Gas samples were saved in neutral
glass tubes with the volume of 20.0 ml. The air
samples were analyzed by using gas
chromatography machine GC17A and FID
detector of which the carrier gas is N2. CH4
samples were collected and analyzed at the
same places and times as the water samples.
Figure 2. Sampling principle diagram of CO2.
CH4 gas is also collected following the
method of air sampling in the sealed chamber
Rolston (1986) [10]. The CH4 collection box
has the same size with the CO2 collection box.
The sealed chamber which has a determined
area had been placed on the surface of the
reservoir. The air was sucked by the air cylinder
chamber at the time of 0 minute (in order to
2.2.3. Regression analysis technique
The regression analysis technique was used
to develop the equations describing the
relationships between water quality factors and
CO2, CH4 gas emissions from the Son La
hydropower reservoir. This study method has
been being applied for forecasting in many
fields like hydrological factors, climate,
environment, economy ... The accuracy of the
technique depends on the length of the data
string. Multivariate regression equations have a
general following form [9]:
64
N.T.T. Nguyen et al. / VNU Journal of Science: Earth and Environmental Sciences, Vol. 33, No. 2 (2017) 60-70
Yk = β+ β1X1 + β2X2 + β3X3 + β4X4 +….+
βkXk; Correlation coefficient R2
Where:
- Yk: dependent variable, k: number of
independent variables
- Xi: independent variable
- β freedom coefficient, β1,2,..k: separate
regression coefficients or slopes.
Correlation coefficient, R2, is alway from 0
to 1. It is useful because it gives the proportion
of the variance (fluctuation) of one variable that
is predictable from the other variable. It is a
measure that allows us to determine how certain
one can be in making predictions from a certain
model/graph. The correlation has low level
when 0 ≤ R2 < 0.3, average level when 0,3 ≤ R2
< 0.5 , quite close level when 0,5 ≤ R2 < 0.7 ,
high level when 0,7 ≤ R2 < 0.9 , very high level
when 0,9 ≤ R2 ≤1.
In this study, dependent variables are CO2
and CH4, while 9 independent variables are
temperature, pH, TDS, conductivity, alkalinity,
DO, COD, total nitrogen, PO43-. Input data to
develop the linear regressions of CO2 and CH4
are monitoring results of water quality at 6
locations in 4 periods in 2014 and 2015. In
addition, periodically measurement data of
water quality in the Son La reservoir in 5 years
is also used for the study.
2.2.4. Data processing methods
The Excel and Eviews Software were used
to statistically analyze the water quality results
and to access links between greenhouse gas
emissions in Son La and the water quality
factors.
3. Results and discussions
3.1. Current status of water quality and
greenhouse gas emissions from the Son La
hydropower reservoir in the years 2014, 2015
The results of water quality analysis showed
that most indicators of water quality in rainy
season had higher concentrations than those in
dry season. The reason could be that during
rainy season, higher water flows from the
upstream of the basin carried more sediment,
pollutants into the reservoir. Moreover, people
living inside the basin took advantage of
submerged land for crop cultivation, especially
planting cash crops. When rainy season came,
the agricultural waste and manure left over on
this part submerged made the concentration of
pollutants in the reservoir increasing. Compared
to the National technical regulation on surface
water quality (QCVN 08: 2008/BTNMT), water
quality in the Son La reservoir was acceptable
for purposes of irrigation, waterway or others.
The average CO2 values emitting from the
Son La hydropower reservoir in 2014 and 2015
fluctuated from 161.64 to 238.83 mg/m2/day.
The total CO2 emission from the whole surface
of the reservoir was about 36207.36 to
53497.92 tons/day, corresponding to 0.62 to
0.92 tons CO2/MW. Compared to those values
in some research in the world, for example the
research on the Wohlen reservoir in Switzerland
(the CO2 value at the first year of operation was
1558 ± 613 mg/m2/day, dropped to 276 ± 57
mg/m2/day at the 3rd year) and the Lungern
reservoir in Switzerland (the CO2 value was
136 ± 353 mg/m2/day [11]), the level of CO2
emission from the Son La hydropower reservoir
after 5 years operation was moderate.
The average CH4 value measured at the Son
La hydropower reservoir in 2014 and 2015
ranged from 3.22 – 5.30 mg/m2/day. The total
CH4 emission from the reservoir ranged from
153.44 to 1232 tons/day, corresponding to
0.0148 to 0.0213 tons CH4/MW. Compared to
some research findings on hydropower
reservoirs (for example in China the CH4
emissions in some lakes and reservoir were
2.88 ± 1.44 mg/m2/day, the value for the Three
Gorge reservoir in China was about 7.2 ± 2.4
mg/m2/day [12]), the level of CH4 emission
from the Son La hydropower reservoir was also
moderate.
N.T.T. Nguyen et al. / VNU Journal of Science: Earth and Environmental Sciences, Vol. 33, No. 2 (2017) 60-70
3.2. Evaluation of the relationships between
greenhouse gas emissions with water quality
parameters
3.2.1. The correlations between CO2 and
the water quality parameters
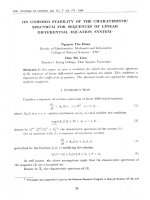
The correlation between CO2 and the water
quality parameters is shown in Figure 3 and
65
Table 1. The results show high correlations
between CO2 values and temperature (R2 =
0.67), DO (R2 = 0.55), alkalinity (R2 = 0.65),
pH ( R2 = 0.61). The correlation between CO2
and conductivity is very low (R2 = 0.06). This
means that two variables have no relationship
with each other. Therefore, the emission of CO2
from the reservoir is affected primarily by
temperature, DO, alkalinity and pH.
Figure 3. Correlations between CO2 and temperature, pH, TDS, conductivity, alkalinity,
DO, COD, total nitrogen and PO43-.
Table 1. Correlation between CO2 and some water quality parameters
2
TT
Correlation
Function
R2
1
CO2 and temperature
y = 12,18x - 124,36
0,67
2
CO2 and DO
y = -27,19x + 354,90
0,55
3
CO2 and COD
y = 5,72x + 127,12
0,23
4
CO2 and alkalinity
y = 0,66x + 75,87
0,65
5
CO2 and total nitrogen
y = 44,24x + 97,05
0,24
6
CO2 and
PO43-
y = 199,63x + 100,62
0,48
7
CO2 and pH
y = -140,59x + 1202,90
0,61
8
CO2 and TDS
y = 4,06x - 190,67
0,24
9
CO2 and conductivity
y = 0,74x + 51,12
o
0,06
3-
CO2 (mg/m /day), temperature ( C), DO (mg/l), alkalinity (mg/l), total nitrogen (mg/l), PO4 (mg/l), pH, TDS (mg/l) and
conductivity (µs/cm.)
66
N.T.T. Nguyen et al. / VNU Journal of Science: Earth and Environmental Sciences, Vol. 33, No. 2 (2017) 60-70
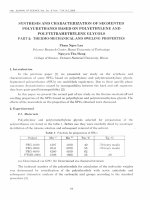
3.2.2. The correlations between CH4 and
the water quality parameters
The correlation coefficients R2 of the
dependent variable CH4 and some water quality
indicators are shown in Table 2 and Figure 4.
The results show high levels of correlation
between CH4 and temperature (R2 = 0.6), COD
(R2 = 0.57), pH (R2 = 0.58). Therefore, the
emission of CO2 in the reservoir is affected
primarily by temperature, COD, pH.
Figure 4. Correlation betweens CH4 and temperature, pH, TDS, conductivity, alkalinity,
DO, COD, total nitrogen and PO43-.
Table 2. Correlation between CH4 and some water quality parameters
TT
1
2
3
4
5
6
7
8
9
Correlation
CH4 and temperature
CH4 and DO
CH4 and COD
CH4 and alkalinity
CH4 and total nitrogen
CH4 and PO43CH4 and pH
CH4 and TDS
CH4 and conductivity
Funtion
y = 0,30x - 3,31
y = -0,48x + 7,36
y = 0,01x + 2,62
y = 0,01x + 2,62
y = 5,50x + 1,99
y = -31,57x + 6,41
y = -3,54x + 29,99
y = 0,08x - 2,76
y = 0,03x - 1,55
R2
0,61
0,25
0,57
0,26
0,28
0,12
0,58
0,13
0,17
CO2 (mg/m2/day), temperature (oC), DO (mg/l), alkalinity (mg/l), total nitrogen (mg/l),
PO43- (mg/l), pH, TDS (mg/l)and conductivity (µs/cm).
N.T.T. Nguyen et al. / VNU Journal of Science: Earth and Environmental Sciences, Vol. 33, No. 2 (2017) 60-70
3.3. Development of predictive equations of
CO2 and CH4 emissions from the Son La
hydropower reservoir
3.3.1. The predictive equation of CO2
emission
By applying the regression analysis
technique and Eiview software, the forecasting
equation of CO2 emissions is as follows:
A1 = 367,62 -3,04B -9,508C + 1,33D +
0.28E + 85,17F – 662,45G – 46,07H+ 2,55I
(1)
R2= 0,929
67
Where A1 = CO2, B = temperature, C =
DO, D = COD, E = alkalinity, F = total
nitrogen, G = PO43-, H= pH, I = TDS.
The correlation between the dependent
variable CO2 and 8 independent variables
(including temperature, DO, COD, alkalinity,
total N, PO43-, pH and total dissolved solids)
has the maximum correlation coefficient R2 =
0,929. The value of correlation coefficient value
depends on the independent variables. When
the number of independent variables decrees,
the R2 also fells (see Table 3). This means that
the predictive equation of CO2 emission should
be based on a certain number of water quality
parameters to give the best results.
Table 3. The changes in the correlation coefficients between CO2 with a number of water quality parameters
Number of
parameters
8
7
6
5
4
3
2
1
Water quality parameters
R2
Temperature, alkalinity, pH, DO, PO43-, total nitrogen, TDS, COD
Temperature, alkalinity, pH, DO, PO43-, total nitrogen, TDS
Temperature, alkalinity, pH, DO, PO43-, total nitrogen
Temperature, alkalinity, pH, DO, PO43Temperature, alkalinity, pH, DO
Temperature, alkalinity, pH
Temperature, alkalinity
Temperature
0,929
0,924
0,867
0,856
0,847
0,808
0,750
0,670
Table 4. The changes in the correlation coefficients between CO2 with a number of water quality parameters
Number of
parameters
Water quality parameters
R2
9
Temperature, pH, COD, total nitrogen, alkalinity, DO, conductivity,
TDS, PO43-
0,917
8
Temperature, pH, COD, total nitrogen, alkalinity, DO, conductivity, TDS
0,908
7
6
5
4
3
2
1
Temperature, pH, COD, total nitrogen, alkalinity, DO, conductivity
Temperature, pH, COD, total nitrogen, alkalinity, DO
Temperature, pH, COD, total nitrogen, alkalinity
Temperature, pH, COD, total nitrogen
Temperature, pH, COD
Temperature, pH
Temperature
0,861
0,857
0,840
0,839
0,838
0,680
0,612
68
N.T.T. Nguyen et al. / VNU Journal of Science: Earth and Environmental Sciences, Vol. 33, No. 2 (2017) 60-70
3.3.2. The predictive equation of CH4
emission
By applying the same process with CO2, the
forecasting equation of CH4 emission has the
following form:
A2 = 29,44 - 0,03B + 0,11C + 0,20D +
0,00087E -1,24F - 21,76G - 3,07H - 0,09I +
0,028K (2)
R2 = 0,917
Where A2 = CH4, B = temperature, C =
DO, D = COD, E = alkalinity, F = total
nitrogen, G = PO43-, H= pH, I = TDS, K =
conductivity.
The maximum correlation coefficient
between the dependent variable CH4 and the 9
independent variable (including temperature,
DO, COD, alkalinity, total N, PO43-, pH, total
dissolved solids and conductivity) is 0.917. The
reduction of number of water quality
parameters makes the R2 decreasing (Table 4).
Like CO2, the predictive equation of CH4
emission should be based on a certain number
of water quality parameters to give the best
results.
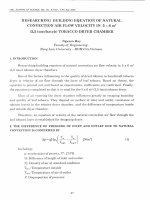
3.4. Verification of the predictive equations of
CO2 and CH4 emissions from the Son La
hydropower reservoir
In order to verify the predictive equations of
CO2 and CH4 emissions, the equations (1) and
(2) above are applied to calculate the amount of
CO2 and CH4. The input data is the measured
values of water quality in 4 stages in the years
2014, 2015 at 6 locations (Figure 1). The results
of statistical analysis are presented in table 5
and figure 5. As can be seen in those table and
figure, the predictive values of CO2 and CH4
emissions by the equations are slightly higher
than the experimental values. The results show
the same tendency as observed in nature.
Therefore, they can be applied to estimate the
greenhouse gas emissions from the Son La
hydropower reservoir.
Table 5. Statistical analysis of fluxes of CO2 and CH4 at the Son La hydropower reservoir
Values of CO2
(mg/m2/day)
Measured
24
149,92
245,72
193,45
33,85
Parameters
Number of sample (n)
Minimum value
Maximum value
Average value
Standard deviation
(a)
Calculated
24
136,61
243,60
194,14
32,70
Values of CH4
(mg/m2/day)
Measured
24
3,21
5,82
4,54
0,87
Calculated
24
3,34
5,93
4,74
0,83
(b)
Figure 5. The calculated and measured fluxes of CO2 (a) and CH4 (b) at the Son La hydropower reservoir.
N.T.T. Nguyen et al. / VNU Journal of Science: Earth and Environmental Sciences, Vol. 33, No. 2 (2017) 60-70
4. Conclusion
The amounts of CO2 and CH4 greenhouse
gas emissions from the Son La hydropower
reservoir were average compared to other
reservoirs in the world. CO2 emission from the
Son La hydropower reservoir has relationships
with several water quality parameters including
4 main factors: temperature, DO, alkalinity and
pH. The amount of CH4 emission from the
reservoir also has relationships with several
water quality parameters including 3 main
factors: temperature, COD, pH. The regression
equations predicting emissions of CO2 and CH4
in the Son La hydropower reservoir have been
developed upon the actually measured values of
water quality at the reservoir and give fairly
consistent results with reality. Therefore, those
equations can be used to estimate the amounts
of CO2 and CH4 based on the periodic
measurement of water quality. They also give a
basis for making management measures to
reduce greenhouse gas emissions from the
reservoir in a better way.
[4]
[5]
[6]
[7]
[8]
References
[1] Huttunen, J.T.; Vaisanen, T.S.; Hellsten, S.K.;
Heikkinen, M.; Nykanen, H.; Jungner, H.;
Niskanen, A.; Virtanen, M.O.; Lindqvist, O.V.;
Nenonen, O.S. & Martikainen, P.J. (2002),
“Fluxes of CH4, CO2, and N2O in hydroelectric
reservoirs Lokka and Porttipahta in the northern
boreal zone in Finland”, Global Biogeochemical
Cycles, Vol.16. No.1, 886.
[2] Guerin, F., and G. Abril (2007), “Significance of
pelagic aerobic methane oxidation in the methane
and carbon budget of a tropical reservoir”, J.
Geophys. Res. Biogeosci, 112.
[3] Abril, G., Guerin, F., Richard, S., Delmas, R.,
Galy-Lacaux, C., Gosse, P., Tremblay, A.,
Varfalvy, L., Dos Santos, M.A. & Matvienko, B.
(2005). “Carbon dioxide and methane emissions
and the carbon budget of a 10-year old tropical
[9]
[10]
[11]
[12]
69
reservoir (Petit Saut, French Guiana)”, Global
Biogeochemical Cycles, Vol.19. No.4.
Raquel Mendonça, Nathan Barros, Luciana O.
Vidal, Felipe Pacheco1, Sarian Kosten and Fábio
Roland, (2012). “Greenhouse Gas Emissions from
Hydroelectric Reservoirs: What Knowledge Do
We Have and What is Lacking?”, Greenhouse
Gases
–
Emission,
Measurement
and
Management, 55.
Yang, L., F. Lu, X. Wang, X. Duan, W. Song, B.
Sun, S. Chen, Q. Zhang, P. Hou, F. Zheng, Y.
Zhang, X. Zhou, Y. Zhou, and Z. Ouyang (2012),
“Surface methane emissions from different land
use types during various water levels in three
major drawdown areas of the Three Gorges
Reservoir”, J. Geophys. Res., 117.
Rudd JWM, Harris R, Kelly CA, Hecky RE.
(1993), “Are hydroelectric reservoirs significant
sources of greenhouse gases?”, Ambio, Vol. 22,
246.
Barros, N.; Cole, J.J.; Tranvik, L.J.; Prairie, Y.T.;
Bastviken, D.; Huszar, V.L.M.; Del Giorgio, P. &
Roland, F. (2011), “Carbon emission from
hydroelectric reservoirs linked to reservoir age
and latitude”, Nature Geoscience, Vol. 4. No. 9,
593.
Kelly CA. (1997), “Increases in fluxes of
greenhouse gases and methyl mercury following
flooding of an experimental reservoir”,
Environmental Science and Technology, Vol. 31,
1334.
Rolston, D.E. (1986), “Gases flux”, In: A. Klute,
editor, Methods of soil analysis. Part 1. Physical
and mineralogical methods. SSSA Book Ser. 5.
SSSA, Madison, WI. 1103.
Amit Kumar, M.P. Sharma. (2014), “Impact of
water quality on GHG emissions from
Hydropower Reservoir”, J. Mater. Environ. Sci.,
Vol 5 (1), 95.
Diem, T.; Koch, S.; Schwarzenbach, S.; Wehrli,
B. & Schubert, C.J.. (2007), Greenhouse-gas
(CH4, N2O and CO2) emissions from hydroelectric
reservoirs in Switzerland.
Ostrovsky, I., D. F. McGinnis, L. Lapidus, and W.
Eckert (2008), “Quantifying gas ebullition with
echosounder: the role of methane transport by
bubbles in a medium-sized lake”, Limnol.
Oceanogr. Meth., Vol. 6, 105.
70
N.T.T. Nguyen et al. / VNU Journal of Science: Earth and Environmental Sciences, Vol. 33, No. 2 (2017) 60-70
Nghiên cứu xây dựng phương trình ước tính lượng khí
nhà kính cho hồ thủy điện Sơn La
Nguyễn Thị Thế Nguyên1, Phạm Văn Hoàng2, Nguyễn Mạnh Khải3
1
Trường Đại học Thủy lợi, Tây Sơn, Đống Đa, Hà Nội, Việt Nam
Liên hiệp Khoa học và Công nghệ Môi trường, Xuân Đỉnh, Tây Hồ, Hà Nội, Việt Nam
3
Trường Đại học Khoa học Tự nhiên, ĐHQGHN, 334 Nguyễn Trãi, Thanh Xuân, Hà Nội, Việt Nam
2
Tóm tắt: Phát thải khí nhà kính như CO2 và CH4 từ các hồ chứa nhân tạo, đặc biệt là các hồ lớn ở
vùng nhiệt đới như hồ thủy điện Sơn La đang dẫn đến sự nóng lên toàn cầu. Khí CO2 và CH4 trong các
hồ thủy điện sinh ra do sự phân hủy các chất hữu cơ trong lòng hồ. Trong nghiên cứu này, các thông
số chất lượng nước như nhiệt độ, DO, COD, TDS, pH, tổng nitơ, phosphat, tổng độ kiềm, độ dẫn điện
đo được tại hồ thủy điện Sơn La đã được phân tích hồi quy để tìm mối tương quan của chúng với
lượng khí nhà kính phát thải từ hồ chứa này và từ đó xây dựng phương trình hồi quy dự đoán lượng
khí nhà kính phát thải từ hồ. Kết quả phân tích hồi quy cho thấy lượng khí CO2 phát thải từ hồ thủy
điện Sơn La có mối quan hệ với nhiều thông số chất lượng nước trong đó có 4 yếu tố chính là nhiệt độ,
DO, độ kiềm, pH. Lượng khí CH4 phát thải từ hồ thủy điện Sơn La có mối quan hệ 3 yếu tố chính là
nhiệt độ, COD, pH. Phương trình hồi quy dự đoán lượng khí CO2 và CH4 với hệ số tương quan là 0.93
và 0.92 đã được kiểm định với số liệu thực tế và cho kết quả khá tốt, từ đó có thể đưa vào áp dụng
trong thực tế.
Từ khóa: Khí nhà kính, hồ thủy điện, chất lượng nước, phương trình hồi quy.