DSpace at VNU: Synthesis and Characterization of Ni2+-doped TiO2 Nanowires
Bạn đang xem bản rút gọn của tài liệu. Xem và tải ngay bản đầy đủ của tài liệu tại đây (845.46 KB, 7 trang )
VNU Journal of Science: Mathematics – Physics, Vol. 32, No. 3 (2016) 34-40
Synthesis and Characterization of Ni2+-doped TiO2 Nanowires
Trinh Thi Loan*, Vu Hoang Huong, Tran Thi Dung, Nguyen Ngoc Long
Faculty of Physics, VNU University of Science, 334 Nguyen Trai, Thanh Xuan, Hanoi, Vietnam
Received 19 September 2016
Revised 28 September 2016; Accepted 30 September 2016
Abstract: TiO2 nanowires doped with different amounts of Ni2+ ions (from 0 to 18 mol%) were
synthesized by hydrothermal technique. The samples were characterized by X-ray diffraction
(XRD) and Raman spectroscopy, field emission scanning electron microscopy (FESEM), and
diffuse reflection spectroscopy. The XRD analysis showed that the doped samples exhibit anatase
single phase. The lattice parameters remain unchanged, independent on Ni2+ content. Diameter of
TiO2 nanowires increased significantly with increasing concentrations of Ni 2+. The investigated
results indicate that a greater portion of the Ni2+ ions are well-incorporated into the anatase TiO2
lattice. Indirect and direct band gap energies of Ni2+-doped TiO2 with different doping
concentration were found to be in the range from 3.24 to 2.99 eV and 3.54 to 3.35 eV, respectively.
Keywords: TiO2:Ni2+ nanowires, hydrothermal, diffuse reflection, band gap energy.
1. Introduction
In recent few decades, titanium dioxide (TiO2) is extensively studied by different research centers
throughout the world due to its wide applications in such areas as photocatalysis [1], solar energy
conversion [2], gas sensing [3], and many others [4, 5]. However, TiO2 has limited applications under
visible light irradiation because of its poor light absorption ability and low charge separation
efficiency under normal reaction conditions. This is due to its wide band gap [6, 7]. One effort to
improve the light absorption of TiO2 for efficient utilization of the solar energy spectrum is the doping
with transition metals, which inserts a new band into the original band gap of TiO 2 or modifies the
conduction band (CB) or the valence band (VB) of TiO2 [8].
In this article, we synthesized TiO2 nanowires doped with different amounts of Ni2+ ions (from 0 to
18 mol%) by hydrothermal technique. The prepared samples are investigated using developed
techniques such as X-ray diffraction (XRD), Raman, FESEM and diffuse reflection to find out the
influence of Ni2+ doping on the structure, morphology and optical features of the samples.
2. Experimental
The TiO2 nanowires doped with different amounts of Ni2+ ions (from 0 to 18 mol%) were
synthesized by hydrothermal technique using 10 M NaOH aqueous solution, anatase TiO2 powders,
_______
Corresponding author. Tel.: 84-904367699
Email:
34
T.T. Loan et al. / VNU Journal of Science: Mathematics – Physics, Vol. 32, No. 3 (2016) 34-40
35
0.02 M Ni(NO3)2 aqueous solution and urea powder as the precursors. The typical procedure was as
follows: 0.6 g urea was dissolved in 80 ml of 10 M solution of NaOH. Then, 0.8 g of TiO 2 was
dispersed in the above solution followed by steady stirring for 15 min. Then, an appropriate quantity
of 0.02 M solution of Ni(NO3)2 was added to the above mixed solution followed by continuous steady
stirring. The solution was transferred into Teflon-lined steel autoclave. The autoclave then was put in a
drying cabinet and kept at temperature of 200 oC for 36 h and then cooled naturally to room
temperature. Thereafter, the precipitate was filtered and washed with HCl and distilled water, and then
was poured back into Teflon-lined steel autoclave with 80 ml of distilled water and kept at temperature
of 160 oC for 15 h. Finally, the precipitate was filtered and dried in air at 120 oC for 24 h.
The crystalline phase of Ni2+-doped TiO2 was studied by a Siemens D5005 Bruker, Germany Xray diffractometer (XRD) with Cu-Kα1 irradiation (λ = 1.54056 Å). Raman spectra were measured
using LabRam HR800, Horiba spectrometer with 632.8 nm excitation. Nova Nano SEM 450, FEI field
emission scanning electron microscope (FESEM) with the energy dispersive X-ray spectrometer
(EDS) was used to observe the sample morphologies and elemental composition analysis. Diffuse
reflection spectroscopy measurements were carried out on a VARIAN UV-VIS-NIR Cary-5000
spectrophotometer. The Kubelka-Munk function F(R) proportional to the absorption coefficient was
calculated using the equation: F(R) = (1-R)2/(2R) = K/S, where R, K and S are the reflection, the
absorption and the scattering coefficient, respectively.
3. Results and discussion
3.1. Structure characterization
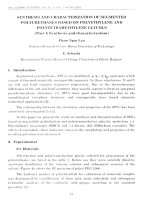
Fig.1. XRD patterns of the Ni2+-doped TiO2 samples with different doping concentration.
Fig.1 presents the XRD patterns of Ni2+-doped TiO2 samples with different doping concentration.
It can be seen that all samples show only anatase single phase regardless of Ni 2+ content. In each
pattern, the nine peaks lying at 2θ angles: 25.32, 37.02, 37.89, 38.58, 48.06, 53.97, 55.05, 62.73, and
68.70o were observed. These peaks correspond to the (101), (103), (004), (112), (200), (105), (211),
(204), and (116) planes of anatase phase with tetragonal geometry, respectively (JCPDS card: 040477). The lattice parameters of samples calculated from the XRD patterns are shown in Table 1. The
lattice parameters remain unchanged, independent on Ni2+ content. This is evident considering that
36
T.T. Loan et al. / VNU Journal of Science: Mathematics – Physics, Vol. 32, No. 3 (2016) 34-40
Ni2+ has an ionic radius similar to Ti4+ and can also form octahedral coordination as Ti4+ does [9].
When comparing to bulk anatase TiO2 (a = b = 3.784 Å and c = 9.514 Å), a variation in c lattice
constant has been observed for the prepared samples as shown in Table 1. The reason for this
may be due to the tensile strain in the lattice.
Table 1. The lattice parameters of the TiO2:Ni2+samples with different doping concentration.
Ni2+ content (mol%)
0.5
4.0
12.0
18.0
d101 (Å)
3.517
3.516
3.521
3.522
d004 (Å)
2.373
2.374
2.371
2.372
d200 (Å)
1.891
1.893
1.894
1.894
d204 (Å)
1.479
1.480
1.479
1.481
a = b (Å)
3.782 ± 0.001
3.787 ± 0.001
3.788 ± 0.005
3.789 ± 0.002
c (Å)
9.493 ± 0.002
9.497 ± 0.004
9.487 ± 0.002
9.493 ± 0.007
It is well known that the conventional crystallographic unit cell of anatase TiO2 is tetragonal
geometry (space group I41/amd) and contains two primitive unit cells, each of which contains two
formula units of TiO2. According to the factor group analysis, six modes of pure anatase TiO 2, A1g +
2B1g + 3Eg, are Raman active and three modes, A2u + 2Eu, are infrared active. One vibration, B2u, will
be inactive in both infrared and Raman spectra. Thus, group theory predicts six Raman active modes
for the tetragonal anatase phase [10]. The Raman active modes of the anatase structure were observed
at approximately 144 cm-1(Eg(1)), 197 cm-1(Eg(2)), 399 cm-1(B1g), 519 cm-1(A1g&B1g) and 639 cm1
(Eg(3)) [10, 11]. It has been known that the Eg(1), Eg(2) and B1g modes are the Ti-O bond stretching
type vibrations. The A1g, B1g and Eg(3) modes are the O-Ti-O bending type vibrations [10]. The
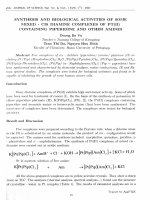
Raman spectra of Ni2+-doped TiO2 are shown in Fig. 2. The spectra exhibit modes at 142 cm-1 (Eg(1)),
196 cm-1 (Eg(2)), 395 cm-1 (B1g), 514 cm-1 (A1g, B1g) and 638 cm-1 (Eg(3)). No indication of the presence
of rutile or any secondary phases are seen.
Fig.2. Raman spectra of the Ni2+-doped TiO2 samples with different doping concentration.
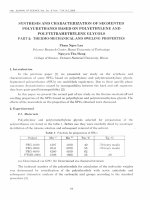
The EDS spectra of the TiO2 samples doped with 4.0 and 18.0 mol% Ni2+ are presented in Fig. 3.
The EDS spectra exhibit the peaks related to the Ti, O and Ni elements, in addition, the characteristic
peaks for Ni element increase in intensity when Ni2+ concentration increases. The results of the EDS
analysis indicate that the Ni2+ ions are incorporated in Ti4+ lattice sites.
T.T. Loan et al. / VNU Journal of Science: Mathematics – Physics, Vol. 32, No. 3 (2016) 34-40
37
Fig. 3. The EDS spectra of the Ni2+-doped TiO2 samples with different doping concentrations.
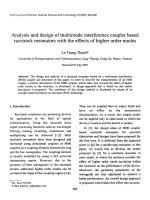
Fig. 4. The FESEM images of the Ni2+-doped TiO2 samples with different doping concentrations: a) 0.5 mol%
Ni2+, b) 4.0 mol% Ni2+, c) 12 mol% Ni2+ and d) 18 mol% Ni2+.
38
T.T. Loan et al. / VNU Journal of Science: Mathematics – Physics, Vol. 32, No. 3 (2016) 34-40
3.2. Morphology
Fig. 4 shows the FESEM images of the Ni2+-doped TiO2 nanowires with different doping
concentrations. From the images, it is clear that the nanowire diameter significantly increases with
increasing the Ni dopant concentration. Namely, average nanowire diameters were found to be 45 ± 5,
70 ± 5, 200 ± 25, and 250 ± 25 nm for the samples doped with 0.5, 4.0, 12.0, and 18.0 mol% Ni 2+,
respectively.
3.3. Absorption
The diffuse reflectance spectra of TiO2:Ni2+ with different doping concentrations are shown in
Fig.5a. As shown in this figure, the reflectivity in the range from 2.0 to 3.8 eV decreases (hence
absorption is increased) with increasing Ni2+ dopant content. Fig. 5b shows the Kubelka-Munk
functions F(R) of the TiO2:Ni2+ samples obtained from the diffuse reflection data.
Fig. 5. (a) Diffuse reflectance spectra of TiO2:Ni2+ with different concentrations,
(b) Kubelka-Munk functions deduced from diffuse reflectance spectra,
(c) plots of [F(R)hν]1/2 and (d) plots of [F(R)hν]2 versus photon energy hν.
It is well known that the band gap energy (Eg) is considered one of the important parameters of
optical materials [12]. The top of the valence band of the anatase single crystals has two maxima at M
and Г points, which are separated by a very small energy difference, only approximately 2 meV, and
the bottom of the conduction band at Г point [13]. The Г(VB)→Г(CB) transitions are direct, but the
M(VB)→Г(CB) transitions are indirect [13]. For determining band gap energies of the synthesized
samples, [F(R)hν]1/2 and [F(R)hν]2 are plotted against hν for the indirect and direct transitions,
T.T. Loan et al. / VNU Journal of Science: Mathematics – Physics, Vol. 32, No. 3 (2016) 34-40
39
respectively. The lines drawn on the linear part of [F(R)hν]1/2 and [F(R)hν]2 versus hν at [F(R)hν]1/2 =
0 and [F(R)hν]2 = 0 give the indirect and direct band gap energy, respectively. For the undoped TiO 2
samples, we have obtained the values 3.24 and 3.54 eV corresponding to the indirect and direct band
gap, respectively. These results are larger than experimental values for the band gap energy of anatase
TiO2 nanopowders reported by Trenczek-Zajac et al. [14], but are in good agreement with the
calculated values obtained by Zielinska et al. [15], and the experimental values (3.20 and 3.53 eV) for
TiO2 nanoparticles reported by Reyes-Coronado et al. [16]. The band gap energy values obtained for
the indirect and direct transitions of our TiO2 nanowires with different Ni2+ dopant contents are
summarized in Table 2. The results indicate that the band gap of the TiO2 nanowires is decreased with
increasing Ni2+ dopant content. It is generally accepted that most of the transition metal energy levels
exist between the valence and conduction bands of TiO2 [8, 11, 12, 17]. Therefore, a possible
electronic transition from Ni2+ energy level to the conduction band of TiO2 is considered a main reason
for reducing the band gap energy. Beside, the transition metals could also make significant changes on
the electronic structure of a crystalline material and thus on the values of the gap energy [18].
Table 2. Variations of the band gap energy with Ni-doped TiO2 samples
Ni2+ dopant
content (mol%)
0
1
4
8
15
Eg (eV)
Indirect transitions
3.24
3.20
3.11
3.06
2.99
Direct transitions
3.54
3.45
3.39
3.36
3.35
4. Conclusion
Nanowires of TiO2:Ni2+ were successfully obtained by hydrothermal technique from precursors of
anatase TiO2, urea powders, Ni(NO3)2 and NaOH aqueous solutions. XRD and Raman analysis
indicated that all the synthesized nanowires exhibit anatase single phase. The lattice parameters and
mode Raman positions are independents on Ni2+ dopant contents. While, the FESEM images show that
the diameter of TiO2 nanowires increased significantly with increasing concentrations of Ni2+. The
diffuse reflection spectra were used to determine both the indirect and direct band gap energy of TiO 2
nanowires as a function of the concentration of Ni2+ ions. The results indicated that band gap
decreases with increasing Ni2+ content.
Acknowledgments
This work is financially supported by Vietnam National University (Project No. QG.14.15).
References
[1]
[2]
[3]
[4]
A. Fujishima, X. Zhang , D. A. Trykc, Surface Science Reports 63 (2008) 515–582
M.I. Baraton, Recent Pat. Nanotechnol. 6 (2012) 10.
V. Galstyan, E. Comini, G. Faglia and G. Sberveglieri, Sensors 13(2013) 14813-14838.
X. Chen and S. S. Mao, Chem. Rev., 107 (7) (2007) pp 2891–2959.
40
T.T. Loan et al. / VNU Journal of Science: Mathematics – Physics, Vol. 32, No. 3 (2016) 34-40
[5] C. Dette, M.A. Perez-Osorio, C. S. Kley, P. Punke, C. E. Patrick, P.Jacobson, F. Giustino, S. J. Jung, and K.
Kern, Nano Lett.,14 (11) (2014) 6533–6538
[6] X. Chen, L.Liu, P.Y. Yu, S.S. Mao. Science 331 (2011) 746-750.
[7] S. Valencia, J.M. Marin and G. Restrepo, The Open Materials Science Journal 4 (2010) 9-14
[8] Trinh Thi Loan, Nguyen Ngoc Long, VNU Journal of Science: Mathematics – Physics, Vol. 30, No. 2 (2014) 5967.
[9] D. Jing, Y. Zhang, L. Guo, Chemical Physics Letters 415 (2005) 74–78.
[10] T. Ohsaka, E. Izumi, Y. Fujiki, J. Raman Spectrosc. 7 (1978) 321-324.
[11] A. K. Tripathi, M. C. Mathpal, P. Kumar, V. Agrahari, M. K. Singh, S. K. Mishra, M. M. Ahmad, A. Agarwal,
Adv. Mater. Lett. 6(3) ( 2015) 201-208.
[12] M.A. Ahmed, E.E. El-Katori, Z. H. Gharni, Journal of Alloys and Compounds 553 (2013) 19–29.
[13] S.D. Mo and W. Y. Ching, Phys. Rev. 51(1995) 13023-13032.
[14] A. Trenczek-Zajac, M. Radecka, M. Jasinski, K.A. Michalow, M. Rekas, E. Kusior, K. Zakrzewska, A.
Heel,T.Graule, K. Kowalski, Journal of Power Sources 194 (2009) 104–111.
[15] M. Landmann, E. Rauls and W. G. Schmidt, J. Phys.: Condens. Matter 24 (2012) 195503 (6pp).
[16] D Reyes-Coronado, G Rodr´ıguez-Gattorno, M E Espinosa-Pesqueira, C Cab, R de Coss and G Oskam,
Nanotechnology 19 (2008) 145605.
[17] B. Choudhury, M. Dey and A. Choudhury, International Nano Letters 3 No.1 (2013) 1-8.
[18] A. Hajjaji, A. Atyaoui, K. Trabelsi, M. Amlouk, L. Bousselmi, B. Bessais, M.A.E. Khakani and M. Gaidi,
American Journal of Analytical Chemistry 5 (2014) 473-482.