DSpace at VNU: Effect of Valence Band Offset and Surface Passivation Quality in the Silicon Heterojunction Solar Cells
Bạn đang xem bản rút gọn của tài liệu. Xem và tải ngay bản đầy đủ của tài liệu tại đây (171.64 KB, 4 trang )
Journal of The Electrochemical Society, 158 (11) H1129-H1132 (2011)
H1129
0013-4651/2011/158(11)/H1129/4/$28.00 © The Electrochemical Society
Effect of Valence Band Offset and Surface Passivation Quality
in the Silicon Heterojunction Solar Cells
Vinh Ai Dao,a,d Youngseok Lee,b Sangho Kim,b Jaehyun Cho,a Shihyun Ahn,a
Youngkuk Kim,a Nariangadu Lakshminarayan,c,∗ and Junsin Yia,b,z
a School
of Information and Communication Engineering, Sungkyunkwan University, Suwon, 440-746, Korea
b Department of Energy Science, Sungkyunkwan University, Suwon, 440-746, Korea
c Department of Physics, Madras Christian College, Chennai 600059, India
d Faculty of Materials Science, University of Science, Vietnam National University, Hochiminh,
Vietnam
We fabricated hydrogenated amorphous silicon/crystalline silicon (a-Si:H/c-Si) heterojunction solar cells with different intrinsic
buffer layers, to elucidate the effect of the energy band gap, as well as passivation quality on the performance of the a-Si:H/c-Si
heterojunction solar cells. Deformation (S-shaped) of J-V characteristics are observed in defiance of surface passivation quality for
heterojunction solar cells with intrinsic buffer layers of high energy band gap (Eg > 3.0 eV). The deformation of J-V characteristics
could be recovered when the energy band gap does not exceed 1.72 eV. In this given energy band gap, it seem to be that the surface
passivation quality plays a role in heterojunction solar cell performance. The electrical-optical simulator, AFORS-HET, is used to
determine the probable cause of the change in device performance. We find that the band discontinuities at the a-Si:H/c-Si interface
are responsible for such an S-shaped behavior in the high energy band gap of intrinsic buffer layers.
© 2011 The Electrochemical Society. [DOI: 10.1149/2.031111jes] All rights reserved.
Manuscript submitted April 25, 2011; revised manuscript received August 1, 2011. Published October 5, 2011.
Wafer bowing and breakage caused by high-temperature metal
back contact is a great concern due to the current industry trend
toward thinner solar cell wafers. The hydrogenated amorphous
silicon/crystalline silicon (a-Si:H/c-Si) heterojunction (HJ) solar cell
is a good solution to these problems due to the low-temperature production process, around 200◦ C. This also limits the thermal budget
and allows inexpensive, lower quality materials to be used as base
material. A considerable number of studies have been made on the
a-Si:H/c-Si heterojunction solar cells in recent years.1–8 Sanyo’s Heterojunction with Intrinsic Thin layer (HIT) solar cells hold the word
record efficiency of 23% on a-Si:H/c-S n-type wafer, in which stacks
of intrinsic buffer a-Si:H and doped a-Si:H layers help form both
the emitter and the back surface field.1 The intrinsic buffer a-Si:H
(a-Si:H(i)) layer enables very high open circuit voltage, due to its
excellent passivating properties. Hence, this incorporation of the aSi:H(i) layer at the heterointerface has been confirmed to improve
solar cell efficiency.2
The influence of band discontinuities at the a-Si:H/c-Si interface
is another important issue in a-Si:H/c-Si HJ solar cells. The collection probability of photogenerated holes and also the hole (electron)
piling up and hole (electron) trapping at the a-Si:H/c-Si interface
are strongly dependent on the magnitude of the discontinuity in the
band bending offset at the a-Si:H/c-Si interface. Reports on this value
in the research literature are contradictory and range from 0.2 to
0.8 eV.9–13 They can be classified roughly into two groups. M. Schmidt
et al. suggest that an increase in the band offset is of much benefit
to solar cell performance.3 Similar results were obtained by T. H.
Wang et al., who demonstrated that HJ solar cells based on n-type
silicon substrate perform better than a p-type silicon substrate due to
the higher band bending offset at the interface that results in lower
interface recombination.4 In contrast, Maarten W. M. van Cleef et al.,
supported M. Schmidt’s argument in their suggestive evaluation of aSiC:H/c-Si heterojunction solar cells. Nevertheless, they also showed
that for the higher band bending offset ( E > 0.5 eV), the deformation
(S-shaped) of J-V dominated solar cell performance and when the E
< 0.3 eV, the open circuit voltage drops with reduction in efficiency.5
The S-shaped J-V characteristics at higher band bending offset ( E
≥ 0.56 eV) was also confirmed by A. Datta et al.6 Eventually, in
these reports the magnitude of the discontinuity in the band bending
offset at the a-Si:H/c-Si interface was controlled by the energy band
gap of the emitter material. In this letter, we note that the solar cell
∗ Electrochemical Society Active Member.
z
E-mail:
performance of the HJ cells, as influenced by the energy band gap, as
well as surface passivation quality of intrinsic buffer layers had been
investigated. Then, the correlation between experimental J-V characteristics and theoretical simulation indicates the probable cause of the
change in solar cell performance with band offset, as well as interface
defect density.
Experimental
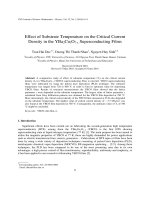
Figure 1 depicts the schematic structure of the fabricated solar
cells. It consists of a commercial n-type Czochralski-grown (CZ) Si
wafer (1-10 cm, 525 μm thick, (100) oriented), cleaned sequentially using (1) acetone/methanol/DIW and (2) RCA method. Prior to
intrinsic buffer layer deposition, native oxide layer was removed by
1 minute dip in 1% hydrofluoric acid. The HJ was then fabricated on
the polished surface of the silicon wafer by depositing different types
of intrinsic buffer layer, such as intrinsic hydrogenated amorphous
silicon oxide (a-SiOx :H(i)), hydrogenated amorphous silicon nitride
(a-SiNx :H(i)), hydrogenated amorphous silicon (a-Si:H(i)), followed
by deposition of a-Si:H(p) as an emitter layer. The details of deposition process, characteristics, and optimum conditions for each type
of intrinsic buffer layer can be found elsewhere.14 ITO thin film was
then deposited by RF magnetron sputtering at a substrate temperature
Al/Ag
Al/Ag
ITO (72nm)
p-type a-Si:H (7nm)
Intrinsic buffer layer (5nm)
n-type CZ wafer (525 μm)
Intrinsic buffer layer (5nm)
n+-type a-Si:H (10nm)
Al
Figure 1. Shematic structure of Al/Ag/ITO/a-Si:H(p)/Intricsic buffer layer/cSi(n)/Intricsic buffer layer/a-Si:H(n+ )/Al heterojunction solar cell using in this
study.
Downloaded on 2015-01-14 to IP 192.236.36.29 address. Redistribution subject to ECS terms of use (see ecsdl.org/site/terms_use) unless CC License in place (see abstract).
Journal of The Electrochemical Society, 158 (11) H1129-H1132 (2011)
One side passivation (ms)
Both side passivation (ms)
Energy band-gap (eV)
a-Si:H(i)
VHF-PECVD
a-Si:H(i)
ICP-CVD
a-SiNx:H(i)
0.1
2
1
a-SiOx:H(i)
1
a-SiOx:H(i) (Eg = 4.46 eV)
1
Current density (mA/cm )
H1130
0.1
10
a-SiNx:H(i) (Eg = 3.10 eV)
a-Si:H(i) (Eg = 1.62 eV)
0
10
a-Si:H(i) (Eg = 1.72 eV)
-1
10
-2
10
0.0
0.1
0.2
0.3
0.4
0.5
0.6
0.7
Voltage (V)
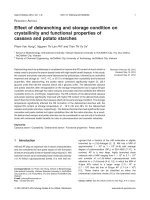
Figure 2. Comparison of measured minority carrier lifetime for CZ c-Si
wafers passivated with different intrinsic buffer layers and energy band gap of
the different intrinsic buffer layers. ICP-CVD denotes inductive couple plasma
chemical vapor deposition; VHF-PECVD denotes very high frequency plasma
enhance chemical vapor deposition.
of 200◦ C, followed by evaporation of a silver/aluminum finger as the
emitter contacts. An n+ -type a-Si:H layer was deposited on the back
prior to the Al back contact deposition, to create good ohmic contact.
Finally, the area of the solar cell was defined by mesa etching. The
active area of the solar cells was 0.36 cm2 .
The thickness measurements of the intrinsic buffer layers,
a-Si:H(p) and a-Si:H(n+ ) films were performed using spectroscopy
ellipsometry (HR-190TM ). The average value of each layer was found
to be 5, 7, and 10 nm for the intrinsic buffer layers, a-Si:H(p) and
a-Si:H(n+ ) films, respectively. The optical band gap was estimated
from these characteristics. The minority carrier lifetime (τeff ) was measured by the quasi-steady-state photoconductance (QSSPC) method,
using a commercial WCT-120 photoconductance set-up from Sinton
Consulting to determine the quality of c-Si surface passivation. The
solar cell performances was characterized by current-voltage measurements under illuminated AM1.5, 100mW/cm2 conditions.
Results and Discussion
Figure 2, the τeff is summarized, which is measured by QSSPC at
an injection level of ∼1 × 1016 cm−3 on CZ-Si samples with difference
type of intrinsic passivation layers, such as a-SiOx :H(i), a-SiNx :H(i)
and a-Si:H(i). It can be observed that maximum values of the τeff
with one-side passivation were 38.7, 83.9, 148.8 and 186.0 μs for
a-SiOx :H(i), a-SiNx :H(i), a-Si:H(i) films growth by ICP-PECVD and
a-Si:H(i) films deposited by VHF-PECVD, respectively. It is further
revealed in Fig. 2 that the τeff with passivation on both sides of the
silicon wafer showed the same trend, however, several times higher
than that of a one-side passivated wafer. The τeff of the sample deposited by VHF-PECVD, which has the highest τeff , exhibits more
than 3 ms, one of the best values for a-Si:H(i), at 5 nm, passivated
wafers. Fig. 2 illustrates the energy band gap (Eg ) for different intrinsic passivation layers. The high Eg materials, like a-SiOx :H(i) and
a-SiNx :H(i), displayed comparatively lower values of τeff than that of
a-Si:H(i) films.
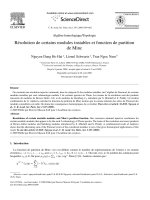
Figure 3. Measured J-V characteristics for the best cells with the different
intrinsic buffer layers under AM 1.5 illumination.
Those buffer layers were used to fabricate HJ solar cells to elucidate the effect of Eg , as well as the τeff , on performance of HIT solar
cells. Fig. 3 and Table I shows the illuminated current-voltage (J-V)
characteristics as well as solar cells output of the device with different intrinsic buffer layers. The S-shapes in the illuminated J-V curve
were observed for the intrinsic passivation materials with high band
gap. Sharp reduction was seen, not only for the open-circuit voltage
(Voc ), but also for the short-circuit current density (Jsc ). Hence, the
device efficiency is seen to be very low, even for the excellent surface
passivation of the a-SiNx :H(i) with τeff of 753.3 μs. However, the
deformation of the J-V curve and also device efficiency is recovered
when lower band gap materials are used as intrinsic passivation layers.
It is also noteworthy that the Voc of the device increases from 570 mV
to 632 mV along with the improvement in lifetime from 1.05 ms to
3.0 ms. We achieved device efficiency of 17.43% (Voc = 632 mV, FF
= 76.20%, and Jsc = 36.27 mA/cm2 ) for optimum design considerations with a-Si:H(i) (1.72 eV) acting as intrinsic passivation layer
(Table I).
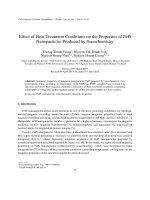
Fig. 4a shows J-V characteristics, concurrently, as simulated by
AFORS-HET under a global solar spectrum of 1 Sun of AM1.5,15
for various energy band gaps of the intrinsic buffer passivation layer
(a-Si:H(i)). The highest performance can be observed for the lowest
band gap of 1.6 eV. These seem to be a slight reduction in device
performance for further increase in Eg , up to a value of 1.72 eV.
However, this reduction is negligible, as shown by numerical values
in Table II. Deformation in the J-V curve begins to develop with an
energy band gap beyond 1.72 eV. As shown in Fig. 4b, the band energy
diagram for the simulated structure with different energy band gaps
is simulated to identify the cause of the distortion in the illuminated
J-V curve with the high energy band gap. There is no variation in
the valence band offset ( Ev ) when the energy band gap of intrinsic
buffer layers increases from 1.62 eV to 1.72 eV (Table II). However,
further increase in the energy band gap results in the increase of Ev
(Table II). It is noteworthy that the variation of device performance
and the Ev are in opposing directions. The hole accumulation at the
a-Si:H/c-Si interface is enhanced with increasing Ev ,6 and thus a
fall in FF for Ev ≥ 0.55 eV. These results are in good agreement
with van Cleef et al. and Rahmouni et al.5, 16 They demonstrate that
Table I. Photovoltaic parameters of HIT solar cells fabricated with different intrinsic buffer layers.
Intrinsic buffer layers
a-Si:H(i)
a-Si:H(i)
a-SiNx :H(i)
a-SiOx:H(i)
Eg (eV)
τeff (ms)
Jsc (mA/cm2 )
Voc (mV)
FF
η (%)
1.62
1.72
3.10
4.46
1.050
3.000
0.753
0.525
36.3
36.27
0.267
0.043
570
632
450
450
76.00
76.20
28.71
29.58
15.73
17.43
0.034
0.005
Downloaded on 2015-01-14 to IP 192.236.36.29 address. Redistribution subject to ECS terms of use (see ecsdl.org/site/terms_use) unless CC License in place (see abstract).
Journal of The Electrochemical Society, 158 (11) H1129-H1132 (2011)
H1131
35
2
Current density (mA/cm )
2
2
Current density (mA/cm
)
)
40
101
10
a-SiOx (Eg = 4.46 eV)
a-SiNx (Eg = 3.10 eV)
a-Si (E = 1.62 eV)
1.62 eV g
a-Si (E = 1.72 eV)
1.72 eV g
1.82 eV
1.92 eV
0
10
1
-1
10
30
25
20
15
0.1
0.1
0.2
0.2
0.3
0.4
0.3
0.4
Voltage
(V)
0.5
0.5
0.6
0.6
5
0
0.0
0.7
0.7
0.1
0.2
1.62 eV
1.72 eV
1.82 eV
1.92 eV
-4.0
-5.0
ΔEV = (ΔEV1 + ΔEV2)
-3
-3
3x10
4x10
-3
-3
5x10
-3
6x10 7x10
Cell position (μm)
-5.0
-3 -1
ΔEV1
-4.5
0.6
0.7
26
-4.8
-5.2
0.5
10
Recombination rate (cm s )
Energy (eV)
Energy (eV)
-3.5
0.4
(a)
-4.6
ΔEV2
0.3
Voltage (V)
(a)
-3.0
-2
10
-2
10
0.1
0.0
0.0
11
2.17 × 10 cm (1.62 eV)
11
-2
2.17 × 10 cm (1.72 eV)
11
-2
5.34 × 10 cm (1.62 eV)
12
-2
1.09 × 10 cm (1.62 eV)
13
-2
1.09 × 10 cm (1.62 eV)
24
10
22
10
20
10
11
2.17 × 10 (1.62 eV)
13
1.09 × 10 (1.62 eV)
18
10
16
-4
10
-3
10
-2
10
-1
0
10
1
10
2
10
10
3
10
10
Cell position (μm)
-3
Free hole density (cm )
17
10
Figure 5. (a) Simulated illuminated characteristics and (b) simulated recombination rate under AM1.5 light, as a function of position in the device for
different values of the density of interface defects.
15
10
13
10
11
10
-4
10
-3
10
-2
10
-1
0
10
-2
10
(b)
1.62 eV
1.72 eV
1.82 eV
1.92 eV
19
-3
8x10
Cell position (μm)
(b)
10
-3
6x10
10
1
10
2
10
3
10
Cell position (μm)
(c)
Figure 4. (a) Simulated illuminated J-V characteristics, (b) the band diagram
under AM 1.5 light, (c) the free hole density under the same conditions, as a
function of position in the device for different values of energy band gap of
intrinsic buffer layers.
with Ev ≥ 0.56 eV, by changing the band gap of emitter layers, the
S-shaped characteristics begin to develop. In our case, from Fig. 4c,
when Ev ≥ 0.55 eV, free holes accumulate at the entire interface
and also get trapped in the interface states at the back of the a-Si:H(i)
layer. This leads to a reduction in the electric field and flat bands
over the depletion region at the interface, Fig. 4b. This results in a
fall in the FF and conversion efficiency as shown in Table II. There
is an abrupt fall not only of the FF but also the Jsc , especially for the
Ev = 0.64 eV. In this case, photogenerated holes coming from the
crystalline n-type side have difficulties in reaching the emitter layers
due to the potential barrier in the valence band. This could lead to a
strong pile up of holes at the interface, resulting in a deep depletion at
the interface (Fig. 4b). Hence, the hole current is nearly suppressed,
eventually resulting in a lower current and also low fill factor.
Table I and II shows the experimental and simulation results for
HIT solar cells, as a function of the energy band gap of intrinsic passivation layers, as well as the density of interface defects (or minority
carrier lifetime) at the hetero-interface. By simulation, in which the
interface density was fixed at 2.17 × 10¹¹ (cm−2 ), the results indicate
that the device performance is almost the same with increasing energy band gap from 1.62 eV to 1.72 eV (Table II). However, this was
contrary to the device behavior observed in the experiment (Table I).
The discrepancies between the simulation and experimental result are
attributed to a reduction of measured minority carrier lifetime from
3 ms to 1.05 ms, resulting from a high defect density at the interface,
which in turn, leads to a reduction of Voc from 632 mV to 570 mV,
as seen from the experimental results (Table I). The device performance as a function of defect density at the interface, concurrently,
is modeled in order to explain the difference berween the simulation
and experimental results.
Fig. 5a and Table II show the J-V curve and numerical values of
parameters for the device simulated under AM1.5 light, as a function
of the density of interface defect (Dit ). Apparently, from the figure,
the highest Voc appears for the HIT cell with interface defect states of
2.17 × 1011 cm−2 ; there is progressive reduction in Voc with increasing
density of interface defects. The deformed J-V curves were observed
Downloaded on 2015-01-14 to IP 192.236.36.29 address. Redistribution subject to ECS terms of use (see ecsdl.org/site/terms_use) unless CC License in place (see abstract).
H1132
Journal of The Electrochemical Society, 158 (11) H1129-H1132 (2011)
Table II. Photovoltaic parameters of HIT solar cells simulated with different intrinsic buffer layers band gap, as well as density of interface
defects.
Eg (eV)
EV (eV)
1.62
1.62
1.62
1.62
1.62
1.72
1.82
1.92
0.45
0.45
0.45
0.45
0.45
0.45
0.55
0.64
Dit (cm−2 )
Jsc (mA/cm2 )
Voc (mV)
FF
η (%)
2.17 × 10¹¹
5.34 × 10¹¹
1.09 × 10¹²
2.17 × 10¹²
1.09 × 10¹³
2.17 × 10¹¹
2.17 × 10¹¹
2.17 × 10¹¹
35.5
35.5
35.49
35.5
17.07
35.48
35.49
10.57
632
610.2
568
494.5
197.7
632
633.6
660.2
77.72
79.9
81.7
77.84
20.74
77.72
76.28
21.52
17.44
17.32
16.47
13.66
0.7
17.43
17.15
1.502
when the density of the interface defect is beyond 1.09 × 10¹² (cm−2 ).
As reported by Jensen et al., the Voc value of the HJ solar cells is limited
by interface recombination as described earlier.17
Voc =
1
q Nv Sit
φc − AkT ln
q
jsc
[1]
where Sit is the interface recombination velocity, φc is the effective
barrier height in c-Si, Nv is the effective density of states in the valence
band, kT is the thermal energy, A is the diode ideality factor, jsc is the
short circuit current density, and q denotes the elementary charge.
We can deduce from Eq. 1 that a lower density of interface defects
results in lower Sit and hence an increased Voc . Moreover, the results
indicate that the density of interface defects is required to be less than
5.34 × 1011 cm−2 to obtain good performance, as is seen from earlier
research literature.8 Particularly, for an interface density ≥ 1.09 × 10¹³
cm−2 , a large number of holes get trapped at the a-Si:H/c-Si interface,
results in accumulation of holes in these states.6 This can be the
reason for reducing of the number of holes comming and attracting of
electrons at this interface, resulting in the faster recombination with
increased density of interface defects [Fig. 5b], hence lower the power
generation, in terms of lower in current density as well as fill factor
(Table II and Fig. 5a).
Eventually, from both the numerical analysis and experiment results, we can conclude that either the high energy band gap of the
intrinsic passivated layer or the high density of interface defects at
the interface is the probable cause of such an S-shape illuminated I-V.
We can interpret the curve of Figs. 2 and 3 by defining two regimes,
namely the high and low band gap regimes. In the first regime, a high
value of band gap (a-SiOx :H(i), a-SiNx :H(i)), results in high valence
band offset, lower electron affinity and opposes the flow of the photo
current in the device. Hence, the valence band bending offset is a dominant parameter. Conversely, in the second regime where the energy
band gap is ≤1.72 eV, an investigation of both the energy band gap
and measured lifetime showed a decrease in device performance with
lowering of the energy band gap. The simultaneous highest measured
lifetime and highest device performance with a-Si:H(i) deposited by
VHF-PECVD indicates that surface passivation at the interface plays
an important role in performance of heterojunction with intrinsic thin
layer solar cells.
Conclusions
We studied the performance of HIT solar cells on n-type CZ-silicon
substrates with the changing of the energy band gap, as well minority
carrier lifetime, using both experimental studies and computer simulation. The obtained results revealed the appearance of an S-shaped
J-V curve, when a high energy band gap material (Eg > 3.0 eV) is used
as an intrinsic buffer layer. This could be attributed to accumulation
of holes at the interface that results in surface recombination, and in
turn to reduced cell performance. The S-shaped J-V disappeared at
a reduced energy band gap value ≤1.72 eV. In this energy band gap
region, device performance depends on surface passivation quality.
The high measured minority carrier lifetime at the interface results
in high Voc , as well as FF, and hence better solar cell efficiency. The
photovoltaic parameters of an optimum design device were found to
be Voc = 631 mV, Jsc = 36.27 mA/cm2 , fill factor = 76.20% and
efficiency = 17.43%
Acknowledgment
This research was supported by the WCU (World Class University)
program through the National Research Foundation of Korea funded
by the Ministry of Education, Science and Technology (R31-2008000-10029-0).
References
1. T. Mishima, M. Taguchi, H. Sakata, and E. Maruyama, Solar Energy Materials &
Solar Cells 95, 18 (2011).
2. M. Taguchi, K. Kawamoto, S. Tsuge, T. Baba, H. Sakata, M. Morizane,
K. Uchihashi, N. Nakamura, S. Kiyama and O. Oota, Prog. Photovoltaics: Research
and Applications, 503 (2000).
3. M. Schmidt, L. Korte, A. Laades, R. Stangl, Ch. Schubert, H. Angermann, E. Conrad,
K. v. Maydell, Thin Solid Films 515, 7475 (2007).
4. T. H. Wang, M. R. Page, E. Iwaniczko, D. H. Levi, Y. Yan, H. M. Branz, and
Q. Wang, the 14th Workshop on Crystalline Silicon Solar Cells and Modules,
American, August 2004.
5. M. W. M. van CLEEF, F. A. Rubinelli, R. Rizzoli, R. Pinghini, R. E. I. Schropp, and
W. F. van der WEG, Jpn. J. Appl. Phys. 37, 3926 (1998).
6. A. Datta, M. Rahmouni, M. Nath, R. Boubekri, P. Roca I Cobarrocas, P. Chatterjee,
Solar Energy Material & Solar Cells 94, 1457 (2010).
7. V. A. Dao, Y. S. Lee, S. H. Kim, Y. K. Kim, N. Lakshminarayan, and J. Yi, Journal
of The Electrochemical Society 158, 312 (2011).
8. L. Korte, E. Conrad, H. Angermann, R. Stangl, M. Schmidt, Solar Energy Material
& Solar Cells 93, 905 (2009).
9. J. Essick and Z. Nobel, Y. M. Li, M. S. Bennett, Phys. Rev. B 54, 4885 (1996).
10. R. Fang and L. Ley, Phys. Rev. B 40, 3818 (1989).
11. F. Evangelisti, J. Non-Cryst. Solids 77/78, 969 (1985).
12. M. Mahmudur Rahman and S. Furukawa, Jpn. J. Appl. Phys. 23, 515 (1984).
13. L. Magafas, N. Georgoulas and A. Thainailakis, Semicond. Sci. Technol. 7, 1363
(1992).
14. V. A. Dao, Ph. D. Thesis, School of Information and Communication Engineering,
Sungkyungkwan University, Suwon, 2011.
15. R. Stangl, J. Haschke, C. Leendertz, published in the InTech e-book: “SolarEnergy”,
ISBN 978-953-7619-X-X, Dez 2009.
16. M. Rahmouni, A. Datta, P. Chatterjee, J. Damoon-Lacoste, C. Ballif, P. Roca
i Cabarrocas, J. Appl. Phys. 107, 054521 (2010).
17. N. Jensen, R. M. Hausner, R. B. Bergmann, J. H. Werner, U. Rau, Progress in
Photovoltaics: Research and Applications, 2002, pp 1-13.
Downloaded on 2015-01-14 to IP 192.236.36.29 address. Redistribution subject to ECS terms of use (see ecsdl.org/site/terms_use) unless CC License in place (see abstract).