DSpace at VNU: Efficiency and productivity of hospitals in Vietnam
Bạn đang xem bản rút gọn của tài liệu. Xem và tải ngay bản đầy đủ của tài liệu tại đây (264.89 KB, 20 trang )
Journal of Health Organization and Management
Efficiency and productivity of hospitals in Vietnam
Thuy Linh Pham
Article information:
Downloaded by Universite Libre de Bruxelles At 19:41 09 February 2015 (PT)
To cite this document:
Thuy Linh Pham, (2011),"Efficiency and productivity of hospitals in Vietnam", Journal of Health Organization
and Management, Vol. 25 Iss 2 pp. 195 - 213
Permanent link to this document:
/>Downloaded on: 09 February 2015, At: 19:41 (PT)
References: this document contains references to 38 other documents.
To copy this document:
The fulltext of this document has been downloaded 1130 times since 2011*
Users who downloaded this article also downloaded:
Joseph Sarkis, Srinivas Talluri, (2002),"Efficiency measurement of hospitals: issues and extensions",
International Journal of Operations & Production Management, Vol. 22 Iss 3 pp. 306-313 http://
dx.doi.org/10.1108/01443570210417605
Minwir Al-Shammari, (1999),"A multi-criteria data envelopment analysis model for measuring the productive
efficiency of hospitals", International Journal of Operations & Production Management, Vol. 19 Iss 9
pp. 879-891 />Ibrahim A. Al-Darrab, (2000),"Relationships between productivity, efficiency, utilization, and quality", Work
Study, Vol. 49 Iss 3 pp. 97-104 />
Access to this document was granted through an Emerald subscription provided by 277661 []
For Authors
If you would like to write for this, or any other Emerald publication, then please use our Emerald for
Authors service information about how to choose which publication to write for and submission guidelines
are available for all. Please visit www.emeraldinsight.com/authors for more information.
About Emerald www.emeraldinsight.com
Emerald is a global publisher linking research and practice to the benefit of society. The company
manages a portfolio of more than 290 journals and over 2,350 books and book series volumes, as well as
providing an extensive range of online products and additional customer resources and services.
Emerald is both COUNTER 4 and TRANSFER compliant. The organization is a partner of the Committee
on Publication Ethics (COPE) and also works with Portico and the LOCKSS initiative for digital archive
preservation.
*Related content and download information correct at time of download.
The current issue and full text archive of this journal is available at
www.emeraldinsight.com/1477-7266.htm
Efficiency and productivity of
hospitals in Vietnam
Efficiency of
hospitals in
Vietnam
Thuy Linh Pham
University of Economics and Business, Vietnam National University,
Hanoi, Vietnam
Downloaded by Universite Libre de Bruxelles At 19:41 09 February 2015 (PT)
Abstract
195
Received 6 May 2009
Revised 13 November 2009
Accepted 24 February 2010
Purpose – The purpose of this paper is to examine the relative efficiency and productivity of
hospitals during the health reform process.
Design/methodology/approach – Data envelopment analyses method (DEA) with the input-oriented
variable-returns-to-scale model was used to calculate efficiency scores. Malmquist total factor
productivity index approach was then employed to calculate productivity of hospitals. Data of 101
hospitals was extracted from databases of the Ministry of Health, Vietnam from the years 1998 to 2006.
Findings – There was evidence of improvement in overall technical efficiency from 65 per cent in
1998 to 76 per cent in 2006. Hospitals’ productivity progressed around 1.4 per cent per year, which was
mainly due to the technical efficiency improvement. Furthermore, provincial hospitals were more
technically efficient than their central counterparts and hospitals located in different regions
performed differently.
Originality/value – The paper provides an insight in the performance of Vietnamese public
hospitals that has been rarely examined before and contributes to the existing literature of hospital
performance in developing countries
Keywords Process efficiency, Productivity rate, Hospitals, Data analysis, Indexing, Vietnam
Paper type Case study
1. Introduction
Efficiency improvement in the provision of health care has been a major issue facing the
health system in Vietnam. The demand for health care is large and increasing over time
due to a growing and an ageing population. However, resources for health care provision
are limited and the government has inadequate resources to finance the rising demand
for increased and better quality services. The constrained ability to adequately meet
health care needs was exacerbated as the economy was transformed from a centrally
planned one to a market-based one in the end of 1980s. This has led to deficiencies and
inefficiencies in the health system, especially within hospitals. Therefore, since the 1990s
a series of structural and institutional reforms has been being introduced, whose main
objectives were to meet the increasing demand of health services and boost the efficiency
and productivity of the health system in general, and hospitals in particular.
Despite the extensive body of literature dealing with the efficiency and productivity
of service provision in health care, few empirical analysis in developing countries
during the reform process exist. A number of recent surveys of Hollingsworth et al.
(1999), Hollingsworth (2003), and Worthington (2004) have provided an overview of
efficiency literature in hospitals. Most of the studies identified in these review papers
are on the efficiency and productivity of developed countries, for example, out of 188
studies reviewed in Hollingsworth (2003), only one study of Zere et al. (2001)
investigated the efficiency and productivity of hospitals in a developing country, South
Journal of Health Organization and
Management
Vol. 25 No. 2, 2011
pp. 195-213
q Emerald Group Publishing Limited
1477-7266
DOI 10.1108/14777261111134428
JHOM
25,2
Downloaded by Universite Libre de Bruxelles At 19:41 09 February 2015 (PT)
196
Africa. However, recently, there are also some more studies on hospital efficiency and
productivity of developing countries such as Osei et al. (2005) on Ghana’s hospitals,
and Pilyavsky and Staat (2008) on Ukraine’s hospitals.
Inspired from an empirical literature, which has investigated the efficiency and
productivity of hospitals under the structural change circumstances, it is important to
analyse whether the Vietnamese hospital sector is able to keep up its productivity by
adapting to these changes. The study, therefore, aims to measure the relative efficiency
and changes in productivity of hospitals during the health reform process from 1998 to
2006, and then highlight possible policy implications of the results for policy makers.
This paper is organised as follows. Section 2 gives a brief overview of the healthcare
system in Vietnam. Section 3 reviews the existing literature on hospital efficiency and
productivity. Section 4 presents the selection of the estimation techniques used and the
data set. Section 5 details the analysis and the efficiency and productivity results,
which are then summarised in the conclusions in section 6.
2. The system of healthcare in Vietnam
Before the reform initiatives in the 1990s, the Vietnamese health system could be
considered a universal health system, where the government was responsible for the
provision of health services to all of the population and entirely financed health care
programmes and the operations of health facilities (Bloom, 1997). All health facilities,
especially hospitals, were state-owned, entirely funded by the government, and
provided free medical services to the entire population. These public hospitals also had
to follow state-led targets, which focused on the volume of health services delivered.
Meanwhile, private health care facilities did not officially exist. Accordingly, the health
system was characterised by the shortage of health service provision, under-funding
and inefficiency (Chen and Hiebert, 1994; Hoi et al., 2000). Since the 1990s, therefore, a
series of structural and institutional reforms has been introduced across different
sections of the healthcare system in order to meet the increasing demand for health
services and to boost its efficiency and productivity.
Following these structural change programmes, the health system has basically
changed from a state-led system providing free-of-charge health care into a mixed,
fee-for-service based care system. The health reform programmes have called for, for
example, liberalisation of the pharmaceutical industry, legalisation of the private
provision of health services, and the deregulation of the retail trade in drugs and
medicines. The most important change of the health care reform programmes has been
the restructuring of the public hospital sector. In particular, the restructuring
programme in the hospital sector has emphasised financial and managerial regulatory
changes via the introduction of user fees, the implementation of health insurance
schemes, and the granting of autonomy for public hospitals (Sepehri et al., 2005; World
Bank, 2005; Sepehri et al., 2003; Ladinsky et al., 2000).
Health care services are now carried out by both private and public health providers
in the Vietnamese healthcare system. The public health providers include health care
centres and public hospitals. The private health providers consist of private clinics and
private hospitals. Among these public and private health care providers, hospitals play
important roles in the health system, especially in the improvement of the overall
health of the public. There are 1,053 hospitals with 143,999 beds activate in the
healthcare system, including 1,002 public hospitals and 51 private hospitals. The
Downloaded by Universite Libre de Bruxelles At 19:41 09 February 2015 (PT)
public hospitals are vertically divided into first three tiers of national administrative
structure: central, provincial, district. These hospitals are closely related to each other,
with the central and provincial hospitals assisting the district ones in terms of
providing professional medical operations and techniques. The private hospitals
mainly provide health services on demand of middle- and high-income people.
Vietnam has been spending a significant proportion of its wealth on health,
approximately 5.1 per cent of gross domestic product (GDP) per year. Currently, the
health care finance comes from two sources, public and private ones. The former
source consists of revenue from direct and indirect taxes and the latter source consists
of direct payments from patients and health insurance schemes. Of these two sources,
health care expenditure has been increasingly financed by the private sources. During
the period 1990-2005, the total private spending on health has increased 2.7 times in
nominal terms, from US$ 0.76 billion to 2.06 billion. This means that the private
percentage of health expenditure has risen from 67.3 per cent of total health
expenditure in 1998 to 77.4 per cent in 2005. Meanwhile, the role of the government in
financing the health sector has gradually decreased, from 32.7 per cent of total health
expenditure to 22.6 per cent, respectively.
Most of the public funds and a large part of the private funds are spent on public
health facilities, in which public hospitals consume approximately 40 per cent of the
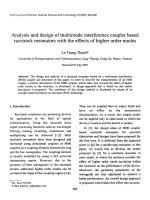
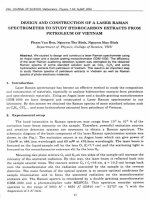
total health expenditure. The structure of financial sources for public hospitals, as
presented in Figure 1, therefore, can partly illustrate both the public and private
expenditure on health. It can be observed in the figure that public hospitals have four
financial sources: the state budget, reimbursement from health insurance; direct
patient payments (user fees), and domestic or foreign aid. The figure also shows that
the government budget is still an important financial source for public hospitals during
1994-2006. However, the proportion provided by the government budget in terms of the
total financial sources of public hospitals has considerably declined from 68.4 per cent
in 1994 to 32 per cent in 2006. The most important financial source – although only by
a small margin – is now direct patient payments. The percentage of user fees in
financing hospitals has increased over time, from 23.2 per cent of total revenues of
public hospitals in 1994 to 33 per cent in 2006. The percentage of revenue coming from
health insurance reimbursement has also gradually increased from 7.2 per cent to 28
per cent, respectively.
Among the health service providers in the Vietnamese health system, public
hospitals play the most crucial role, and their performance has a significant effect on
the well-being of the Vietnamese people. Therefore, there is a need for empirical
analysis measuring hospital efficiency and productivity under the ongoing structural
change circumstance. This is the focus of this paper.
3. Hospital efficiency: literature review
There has been an extensive body of literature examining the performance of the
health care sector. Studies, which focus on efficiency and productivity using frontier
techniques, have been undertaken in all areas of the health sector: from primary care to
secondary care, tertiary care to nursing home care, as well as from the overall health
system to health care providers, administration bodies, and subgroups in health care
providers such as departments and professionals. Of the empirical studies on efficiency
in the health care sector, many have investigated the efficiency and productivity of
Efficiency of
hospitals in
Vietnam
197
Downloaded by Universite Libre de Bruxelles At 19:41 09 February 2015 (PT)
JHOM
25,2
198
Figure 1.
Financial sources in
hospitals 1994-2006
Downloaded by Universite Libre de Bruxelles At 19:41 09 February 2015 (PT)
hospitals under the health reform process. These empirical studies focused on the
efficiency and productivity of hospitals in Turkey, South Africa, Kenya, Ghana,
Namibia, and Ukraine among others.
In Turkey, two studies were conducted to examine the technical efficiencies of
hospitals: one analysed the acute general hospitals (Ersoy et al., 1997) and the other
considered the Ministry of Health public hospitals (Sahin and Ozcan, 2000). Ersoy et al.
(1997) used the DEA method to examine technical efficiency and found that over 90
percent of Turkish acute general hospitals were inefficient. They indicated that the
inefficient hospitals used far more inputs and produced fewer outputs than their
efficient counterparts. To be specific, the inefficient hospitals, on average, utilised 32
per cent more specialists, 47 per cent more primary care physicians, and had 119 per
cent more staffed bed capacity, whilst producing 13 per cent less outpatient visits, 16
per cent less inpatient hospitalisation, and 57 per cent less surgical operations than the
efficient ones. The findings of Sahin and Ozcan (2000) were found to be in agreement
with the results obtained in Ersoy et al. (1997). According to Sahin and Ozcan (2000),
more than half of public hospitals (55 per cent) were inefficient. The inefficient
hospitals could save over 600 million dollars over five years if they reduced the number
of unused beds, the excessive number of specialist and other health labour, and the
overspent revolving funds.
In South Africa, Zere et al. (2001) measured the technical efficiency and productivity
of 86 hospitals using the DEA model, and subsequently examined the impact of some
hospital characteristics on hospital efficiency and productivity using the Tobit and
OLS regression models. The authors found that a large number of hospitals (87 per
cent) were inefficient, in which the level of pure technical efficiency was the same
whilst the degree of scale efficiency was different across size-groups of hospitals. The
decline of hospital productivity over the period studied was explained by technical
regression. Furthermore, it was shown that occupancy levels and the number of
outpatient visits as a proportion of inpatient days were significantly positively
significantly related to efficiency.
In Kenya, Kirigia et al. (2002) used two basic DEA models, constant returns to scale
and variable returns to scale, to examine the technical efficiency of 54 public district
hospitals in the financial year 1998/1999. Due to a plenitude of information from the
database of the Ministry of Health, 12 input and eight output measures were employed.
The results showed that 74 per cent of the total public hospitals were technically
efficient and 70.5 per cent achieved scale efficiency.
The relative technical efficiency and scale efficiency of public hospitals and health
centres in Ghana was evaluated by Osei et al. (2005). In the study, the sample of 21
public hospitals and 17 health centres was chosen by the simple random sampling
technique. Of the total number of hospitals and health centres investigated, 47 per cent
of hospitals and 70 per cent of health centres were found to be technically inefficient
and the number of scale inefficient hospitals and health centres accounted for 59 per
cent and 47 per cent, respectively. The findings indicated that the hospitals could
improve their efficiency by reducing their current number of medical officers/dentists,
technical staff, subordinate staff and beds, or increasing numbers of maternal and child
care visits, deliveries and discharges. Health centres could become more efficient by
increasing maternal and child health visits, deliveries, fully-immunised children, and
outpatient curative visits.
Efficiency of
hospitals in
Vietnam
199
JHOM
25,2
Downloaded by Universite Libre de Bruxelles At 19:41 09 February 2015 (PT)
200
In Namibia, Zere et al. (2006) investigated the technical efficiency of Namibian
hospitals based on a sample of 26 district hospitals during the period 1997-2001. The
input-oriented DEA model was employed and the robustness of the DEA technical
efficiency scores was tested. The authors reported that more than half of the district
hospitals were inefficient and the inefficiency was due to both pure technical
inefficiency and scale inefficiency. It was also indicated that the prevalent inefficiency
was due to the increasing returns to scale. It would be possible for the hospitals to
become efficient by reducing their excess inputs used by 26-37 per cent or by merging
some small hospitals after expanding the primary care units.
In Ukraine, Pilyavsky and Staat (2008) conducted a study to investigate technical
efficiency and efficiency changes of hospitals and polyclinics. The DEA and
Malmquist productivity index methods were employed upon the data set for the
five-year period 1997-2001. It was found that most hospitals analyzed were efficient;
however, a large number of polyclinics were inefficient. Furthermore, the findings
revealed that productivity does not almost change over the period under
consideration.
As mentioned in the introduction, although there are some studies on efficiency
and productivity of hospitals under the reform process, there is no research
regarding to productivity of hospital sector in Vietnam. This paper, therefore, uses a
complete time-series to examine the changes in efficiency and productivity of public
hospitals.
4. Estimation techniques and data set
Estimation techniques
To measure efficiency of healthcare organisations, two different frontier
methodologies, stochastic frontier analysis (SFA) and data envelopment analysis
(DEA), are widely used. These methods were developed based on the concepts of
efficiency measurement introduced by Farrell (1957). Farrell (1957) indicated that the
key to measuring efficiency is the estimation of the best practice production frontier
(isoquant) against which each individual decision-making unit (DMU) is to be
compared. Accordingly, SFA methodology developed by Aigner et al. (1997), and
Meeusen and Van den Broeck (1977), and DEA methodology developed by Charnes
et al. (1978) use different techniques to envelope data, either statistical or mathematical
programming, respectively. To that end, they make different accommodations for the
structure of production technology, for random noise and for the measurement of
efficiency.
There is a longstanding debate on how to measure the technical efficiency of health
facilities. The cornerstone of the discussion is the problem of choosing the appropriate
methodology, either DEA or SFA. Some comparisons between frontier techniques in
measuring hospital efficiency have been made (e.g. Chirikos and Sear, 2000; Jacobs,
2001; among others). These studies showed that despite the intense research effort,
there is still no consensus to the best method for measuring frontier efficiency in
hospitals. Therefore, this paper chooses the DEA approach[1] in order to measure the
efficiency of the Vietnamese hospitals for the two following reasons. First, as indicated
by Osei et al. (2005) in their study of efficiency in Ghana hospitals and Valdmanis et al.
(2004) in their study of efficiency in Thai hospitals, the application of DEA is likely to
Downloaded by Universite Libre de Bruxelles At 19:41 09 February 2015 (PT)
be suitable in low-income countries where there is insufficient health sector
information, and particularly the data on prices of hospital inputs and outputs.
Second, the preference for DEA is driven by considering its advantages and
disadvantages as opposed to SFA. The important advantage of the DEA method is
that it requires no pre-specification of a functional form and distributional form for the
inefficiency terms. It can simultaneously accommodate multiple inputs and outputs,
and enable a decomposition of the efficiency measurement into several components.
Furthermore, DEA is less “data-intensive” than econometric methods because it does
not require a relatively large sample size, information on prices of inputs and outputs,
nor transformation of input and output physical units into any other single unit
measure. However, it is sensitive to outliers and measurement errors.
In this paper, an input-oriented DEA framework is employed. Alongside the fact
that an input-based DEA orientation has been widely applied in the literature on
hospital efficiency, the input-based approach is chosen over the alternative
output-based approach for the following reasons. First, there is a growing demand
for health services in terms of both quantity and quality; however, demand for health
services is difficult to estimate. Second, the input-based orientation seems to be more
consistent with the regulated context of the public hospitals, in which managers have
more control over inputs (resources) than they do over outputs (service production).
Finally, this method also reflects the primary goal offered by policy makers that public
hospitals are obliged to meet all people’s demands of health care services and that
hospitals should reduce costs or limit input use.
In general, any analysis using DEA method provides only a “snap-shot” of hospital
performance in a given point of time (i.e. static performance). However, an extension to
the standard DEA model such as Malmquist productivity index approach developed
by Fa¨re et al. (1994) can take into account the hospital performance in a time-series
setting. Therefore, the Malmquist productivity index[2] is also analysed in this paper,
to measure performance over time (i.e. productivity change) and decompose any
change into the efficiency and frontier shift effects.
Data set
Data for this study were obtained from the database on the hospitals of Vietnamese
Ministry of Health and cover a period of nine years from 1998-2006. The sample
hospitals used in this study, was the 101 general public hospitals over a total of 116
hospitals belonging to the hospitals under consideration. Central general hospitals
and provincial general hospitals, operating as either the tertiary or main secondary
centres, were chosen because they consume the largest part of the health resources in
the health care system and their performance will have a significant influence on the
health services provided and the health status of the overall population. The general
district hospitals were taken out of the sample because they are of a small size and
less complicated, and provide fewer kinds of health services at a lower quality than
the sampled hospitals. The specialty central and provincial hospitals have distinct
missions, unique production processes, and serve distinct patients, which would have
resulted in a heterogeneous sample. In addition, due to the elimination of some
inaccurate and missing values, 15 provincial hospitals were excluded. As a result, the
sample had 101 hospitals, including nine central hospitals and 98 provincial
hospitals.
Efficiency of
hospitals in
Vietnam
201
JHOM
25,2
Downloaded by Universite Libre de Bruxelles At 19:41 09 February 2015 (PT)
202
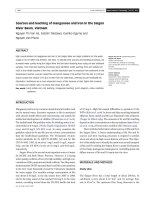
The selected model for the empirical analysis of this paper is presented in Table I
and the descriptive statistics of input and output variables are displayed in
Appendices 2 and 3.
Regarding the output variables, following the hospital efficiency studies by Hu and
Huang (2004), Chang et al. (2004); hospital outputs in this study are proxied by
outpatient visits (Y1), inpatient days (Y2) and surgical operations (Y3) performed.
First, outpatient visits (Y1) are chosen as an output, which include both the scheduled
visits to physicians and the unscheduled visits to the emergency room of hospitals.
Second, health services for inpatients have different features and consume more
resources than outpatient services, therefore, inpatient health services is another
output of hospitals. This study follows the argument of Granneman et al. (1986) that
the inpatient day factor is more medically homogeneous unit than the inpatient factor;
therefore the use of inpatient days (Y2) can provide a more favourable hospital output.
Finally, the surgical operation output (Y3) is used because it requires different
combinations of inputs than medical care, such as specialised equipment and
personnel. All of these output measures are aggregate, and measuring hospital outputs
by such aggregate variables does not capture case-mix variation and quality of
services provided. Even though the use of case-mix index such as
diagnosis-related-groups (DRGs) applied in many health systems may handle the
problem, the absence of data makes its use limited in Vietnam as well as in most
developing countries (Zere et al., 2006; Pilyavsky et al., 2006; Pilyavsky and Staat,
2008).
Regarding the input variables, inputs used in assessment of hospital efficiency often
fall into two categories: recurrent resources and capital resources. The numbers of
personnel and hospital beds are considered as proxies for recurrent and capital
resources used in hospitals, respectively; and therefore they are widely used in the
studies of hospital efficiency (e.g. Ferrari, 2006; Chen, 2006). Accordingly, the number
of actual hospital beds used to provide health services and surgical operations are
employed as an overall indicator of the capital input (X1). However, due to
unavailability of disaggregate data on personnel, only the total number of hospital’s
personnel (X2), including physicians and non-physicians working in the hospitals, is
used as a proxy of recurrent capital. The use of these inputs can be explained by the
fact that the hospital production process, as mentioned above, is largely
administrative, delivers the health care services, and extensively uses the qualified
labour and beds to produce health outputs.
Variables
Inputs
Beds (X1)
Personnel (X2)
Table I.
Selected variables for
DEA and Malmquist TFP
models
Outputs
Outpatient visits (Y1)
Inpatient days (Y2)
Surgical operations (Y3)
Definitions
The total number of beds actually used by the hospital within a year
The total number of full-time physicians and non-physicians
employed by the hospital in a year
Total number of outpatient visits to the hospitals within a year
Total number of days that inpatients stayed in hospital beds and
received inpatient services within a year
Total inpatient and ambulatory surgical operations within a year
Downloaded by Universite Libre de Bruxelles At 19:41 09 February 2015 (PT)
5. Results
Efficiency results
The resulting efficiency scores of 101 general hospitals in Vietnam are presented in
Table II. It is worth noting that the efficiencies reported are only relative, i.e.
efficiencies relative to the best performing hospitals. The results reveal that the
average overall technical efficiency increased from 65.2 per cent in 1998 to 76.7 per cent
in 2006, and the pure technical efficiency increased from 71 per cent to 80.1 per cent,
respectively. It can be seen that both overall and pure technical efficiency had a slight
decrease initially (1998-1999) and rose sharply for the last two years. Overall,
Vietnamese hospitals have experienced an upward trend in technical efficiency during
the sample period 1998-2006. This implies that the levels of hospital efficiency scores
are getting better over time. An explanation for this could lie in the fact that structural
changes in public hospitals in terms of financing mechanism and management were
undertaken during the period of study.
The scale efficiency of the hospitals is quite high and, in general, increased over the
period studied. It has increased from 91.9 per cent in 1998 to 96 per cent in 2006,
resulting in average scale efficiency for the entire sample period of 92.4 per cent. It can
be observed that the average scale efficiency was more than 93 per cent in the last three
years of the sample period. This suggests that the sample hospitals move closer to the
most productive scale and that there is a little room for the inefficient hospitals to
improve their performance by operating at the optimal scale.
Furthermore, technical efficiency is investigated in terms of hospital types and
location. The results are presented in Table III and Table IV, respectively. Table III
shows that the central hospitals have experienced an increase in overall and pure
technical efficiency from 2002, after a slight reduction in 1999. The average overall
technical efficiency of central hospitals increased from 58 per cent in 1998 to 79 per
cent in 2006 and average pure technical efficiency increased from 66.1 per cent to
81.8 per cent, respectively. Meanwhile, the efficiency of provincial hospitals
increased by 10.7 per cent for overall technical efficiency and 8.4 per cent for pure
technical efficiency increased over the sample period. This suggests that central
hospitals’ performance may differ from that of provincial hospitals. Non-parametric
Mann-Whitney test is used to compare the distribution of the efficiency measures of
provincial and central hospitals. The result of the test is at the 95 per cent level of
1998
1999
2000
2001
2002
2003
2004
2005
2006
Average
CRSTE
VRSTE
SCALE
Number of CRSTE ¼ 1
0.652
0.599
0.620
0.619
0.635
0.661
0.674
0.748
0.767
0.664
0.710
0.672
0.677
0.685
0.704
0.731
0.722
0.781
0.801
0.720
0.919
0.898
0.920
0.906
0.907
0.909
0.934
0.958
0.960
0.924
5
3
5
6
6
6
5
6
7
Efficiency of
hospitals in
Vietnam
203
Table II.
Annual average
efficiency scores
JHOM
25,2
Downloaded by Universite Libre de Bruxelles At 19:41 09 February 2015 (PT)
204
Table III.
Annual average technical
efficiency scores by
hospital types
Central hospitals
Provincial hospitals
All hospitals
Overall technical efficiency
1998
1999
2000
2001
2002
2003
2004
2005
2006
Mean
0.584
0.555
0.568
0.562
0.566
0.608
0.665
0.778
0.791
0.631
0.659
0.603
0.625
0.624
0.641
0.666
0.675
0.745
0.765
0.667
0.652
0.599
0.620
0.619
0.635
0.661
0.674
0.748
0.767
0.664
Pure technical efficiency
1998
1999
2000
2001
2002
2003
2004
2005
2006
Mean
0.661
0.650
0.671
0.672
0.694
0.721
0.743
0.809
0.818
0.715
0.715
0.674
0.677
0.686
0.705
0.732
0.720
0.779
0.799
0.721
0.710
0.672
0.677
0.685
0.704
0.731
0.722
0.781
0.801
0.720
confidence, therefore, the null hypothesis that the efficiency distributions are the
same for two types of hospitals are rejected. It means that the provincial hospitals,
in general, have performed better than their central counterparts during the period
under consideration.
Table IV shows that the overall technical efficiency scores of hospitals located in
North East, South East and Mekong River Delta regions are 68 per cent, 70 per cent,
and 67 per cent, respectively; and the pure technical efficiency are 74 per cent, 74.1 per
cent and 73.2 per cent. These scores are slightly higher than those of hospitals located
in other regions. These results suggest that hospitals located in the different regions
may have performed differently. The non-parametric Kruskal-Wallis test is employed
to examine the null hypothesis that there is no median difference in overall and pure
technical efficiency across regions. The result shows that the null hypothesis is rejected
at the 99 per cent of level of confidence, implying that at least one pair of the efficiency
medians is not equal, and that the technical efficiency in the sample hospitals changed
across regions.
As noted earlier in section 4, the DEA efficiency results are sensitive to outliers and
measurement errors. Therefore, this stage analyses the robustness of the efficiency
scores using the jackknife technique (Magnussen, 1996; Zere et al., 2006). The efficient
hospitals are removed one at a time from the analysis and the efficiency measures are
recalculated. The similarity of the efficiency ranking between the model – prior to
deleting any efficient hospitals and new models – omitting each of the efficient
hospitals, is then tested by using the Spearman rank correlation coefficients. If the
efficient hospitals are influential, the results should be varied and not correlated.
0.636
0.569
0.662
0.651
0.664
0.682
0.699
0.775
0.806
0.683
0.695
0.648
0.728
0.719
0.737
0.747
0.740
0.806
0.840
0.740
Pure technical efficiency
1998
0.704
1999
0.651
2000
0.619
2001
0.655
2002
0.694
2003
0.696
2004
0.691
2005
0.762
2006
0.794
Mean
0.696
North East
Overall technical efficiency
1998
0.660
1999
0.604
2000
0.580
2001
0.594
2002
0.627
2003
0.635
2004
0.655
2005
0.720
2006
0.755
Mean
0.648
Red River Delta
0.666
0.700
0.680
0.595
0.622
0.677
0.634
0.749
0.890
0.690
0.503
0.492
0.492
0.452
0.483
0.549
0.535
0.714
0.869
0.565
North West
0.756
0.656
0.634
0.667
0.669
0.652
0.664
0.753
0.778
0.692
0.663
0.557
0.544
0.568
0.567
0.570
0.603
0.699
0.747
0.613
North Central
Coast
0.684
0.638
0.615
0.658
0.701
0.725
0.688
0.803
0.804
0.702
0.637
0.591
0.587
0.616
0.661
0.672
0.661
0.783
0.782
0.666
South Central
Coast
0.668
0.602
0.612
0.609
0.624
0.712
0.726
0.825
0.824
0.689
0.587
0.510
0.531
0.497
0.503
0.588
0.632
0.755
0.772
0.597
Central
Highland
Downloaded by Universite Libre de Bruxelles At 19:41 09 February 2015 (PT)
0.707
0.694
0.729
0.707
0.722
0.752
0.757
0.809
0.793
0.741
0.665
0.628
0.687
0.662
0.675
0.701
0.722
0.790
0.767
0.700
South East
0.744
0.716
0.679
0.708
0.711
0.767
0.746
0.749
0.767
0.732
0.691
0.646
0.630
0.642
0.641
0.687
0.682
0.713
0.725
0.673
Mekong River
Delta
Efficiency of
hospitals in
Vietnam
205
Table IV.
Annual average technical
efficiency scores by
regions
JHOM
25,2
Downloaded by Universite Libre de Bruxelles At 19:41 09 February 2015 (PT)
206
Subsequently, the value of 0 implies that there is no correlation between the rankings.
The value of 1 (or 2 1) indicates that there is no influence of outliers on hospital
efficiency.
Jack-knifing analysis has been done on a year-by-year basis for the above pure
technical efficiency and overall technical efficiency. The results yield the value ranges
of Spearman rank order correlation coefficient from 0.801 to 0.951 for pure technical
efficiency and from 0.851 to 0.997 for technical efficiency, which are significantly
different from zero at 1 per cent level of significance. This suggests that no efficient
hospital influences the efficiency of other hospitals and the efficiencies obtained from
the sample are reasonably robust, at least on an ordinal scale of ranking of the
hospitals.
As compared with the findings of the previous study on the performance of
developing countries reviewed above, the efficiency findings of the Vietnamese
hospitals, to some extent, are similar to the hospital efficiency in those studies. First,
the study on hospital efficiency during the period 1997-2001 in Ukraine (Pilyavsky
et al., 2006), that used to be a member of the communist block before 1990s and has
undertaken economic reform at the same time as Vietnam, shows that the Ukraine’s
hospitals could increase from 26 per cent to 32 per cent of their outputs, if they
could operate on the production frontier. The findings of this study show that
Vietnamese hospitals can save from 28 per cent to 36 per cent of their resources if
they can operate on the efficiency frontier. Furthermore, the comparison of these
findings indicates that the efficiency level of both Ukraine’s and Vietnamese
hospitals can be improved by a reduction in number of beds and number of
employees used. However, between two different kinds of labour – nurses and
physicians – in Ukraine hospitals, nurses were the source of inefficiency whilst
physicians resulted in efficiency improvement. Accordingly, hospitals’ managers in
Ukraine needed to replace some nurses by a number of physicians to increase their
efficiency. In contrast, because data on labour was limited in this paper, the findings
could only show that hospital’ managers need to reduce number of staff employed
to improve their overall technical efficiency. The findings in this study did not
identify what kinds of hospital personnel – nurses, physicians or non-health
personnel – need to be reduced or replaced.
Second, when compared to another study – on Namibian hospitals (Zere et al., 2006)
– the efficiency level of hospitals found in this study is also similar to that of Namibian
hospitals. In particular, the overall technical efficiency of Namibian hospitals was
found to range from 62.7 per cent to 74.3 per cent during the period 1997-2001, whilst it
ranged from 59.9 per cent to 76.7 per cent during the period 1998-2006 for Vietnamese
hospitals. However, whilst the overall technical inefficiency in Namibian hospital was
equally attributed to pure technical inefficiency and scale inefficiency, the overall
technical inefficiency in Vietnamese hospitals was mainly attributed to pure technical
inefficiency. Additionally, the main source of the efficiency improvement of the
Namibian hospitals was the reduction in number of hospital beds whilst it was the
reduction in number of hospital personnel employed in hospitals in Vietnam.
Malmquist total factor productivity results
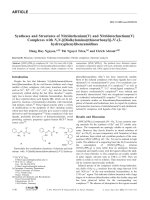
The results of the Malmquist indices and all of its components are presented in Table V.
It includes the geometric means of all the indices as well as the cumulative indices for
Downloaded by Universite Libre de Bruxelles At 19:41 09 February 2015 (PT)
Year
1998-1999
1999-2000
2000-2001
2001-2002
2002-2003
2003-2004
2004-2005
2005-2006
Mean
1998-2006a
Technical
efficiency
change
(EFFCH)
0.922
1.033
0.995
1.028
1.040
1.019
1.119
1.029
1.022
1.189
Technological
Change in pure
change
technical efficiency
(TECHCH)
(PECH)
1.045
0.953
1.023
1.008
0.949
0.963
0.961
1.040
0.992
0.938
0.946
1.005
1.012
1.028
1.038
0.988
1.089
1.026
1.016
1.133
Change in
scale
efficiency
(SECH)
Total factor
productivity
change
(TFPCH)
0.975
1.028
0.983
1.000
1.003
1.032
1.028
1.002
1.006
1.050
0.964
0.984
1.018
1.037
0.987
0.981
1.075
1.069
1.014
1.114
Note: a Cumulative indices for period 1998-2006
the entire period 1998-2006. It is worth noting that all of these indices are measured by
geometric means, which are used to preserve the multiplicative decompositions of the
Malmquist productivity indices (Fa¨re et al., 1994). Furthermore, values of the
Malmquist index or its components greater than 1 denote progress or improvement in
performance, whilst indices less than 1 represent the regress or the deterioration of
performance. The indices equal to 1 reflect no change in performance.
The results in Table V show that the technical efficiency regressed in the initial
years (1998-1999 and 2000-2001) and then the trend reversed, with progression in the
subsequent pairs of years. Due to improvement in technical efficiency change in
1999-2000 and from 2001 to the end of the period under consideration, the hospitals
have experienced an overall net efficiency progress with the value of 1.022,
representing an increase of 2.2 per cent in technical efficiency per year. It can be also
observed that the improvement in technical efficiency change is due to the
simultaneous increases of 1.6 per cent in pure technical efficiency and 0.6 per cent in
scale efficiency per year.
Meanwhile, the results of technological change index, are reported to be mixed. The
production frontier progressed in the initial years of the sample period (1998-2002)
before regressing in the period 2003-2005. In the final year of the sample period, the
hospitals have again experienced progress in technological change, with an
improvement of 4 per cent. However, the combined results of these changes produce
a net negative of 0.8 per cent per year in technological change.
As shown in the table, it appears that there is an upward trend in the total factor
productivity index (TFPCH), a product of technical efficiency change and technological
change, during the entire period under consideration; although it experiences some
downward movements in particular pair of years. In particular, after an initial
regression in the first two periods (1998-1999 and 1999-2000), productivity progressed
in the two subsequent periods (2000-2001 and 2001-2002). Afterwards, it regressed and
then progressed evenly for the next four consecutive periods. Overall, the Vietnamese
public hospitals experienced a 1.4 per cent productivity growth rate per year during
Efficiency of
hospitals in
Vietnam
207
Table V.
Malmquist productivity
indices and its
components
JHOM
25,2
Downloaded by Universite Libre de Bruxelles At 19:41 09 February 2015 (PT)
208
1998-2006. This increase of 1.4 per cent per year of Malmquist productivity change
index can be found to be due to the improvement in technical efficiency changes of 2.2
per cent per year, and is counterbalanced by the worsening in technological change of
0.8 per cent per year. This suggests that on average the hospitals are getting closer
(experiencing efficiency improvement) to the frontier. However, the hospitals have on
average experienced negative technological change during the sample period, thus
offsetting somewhat the technical efficiency progress. As compared with the findings
of a study on the productivity of South African hospitals (Zere et al., 2001), the only
study on hospital productivity currently undertaken in developing countries, the
efficiency scores of Vietnamese hospitals are found to be lower. However, whilst
productivity growth and technical efficiency change was revealed to have regressed in
South African hospitals, they are progressed in Vietnamese general hospitals.
6. Conclusions
This study is an attempt to provide an empirical picture of the efficiency and
productivity of Vietnamese hospitals during the period of reform process. The
findings showed that there are a considerable room for the efficiency improvement
in the Vietnamese public hospitals as the average overall and pure technical
efficiencies were 66.4 per cent and 72 per cent, respectively. These results, to some
extent, are similar to those found in some studies on hospital efficiency in other
developing countries such as the Ukraine and Namibia. These results could be
attributed for the impact of the structural changes in the public hospital sector since
the 1990s. It also showed that the efficiency of hospitals have improved over the
sample period. The provincial hospitals were found to outperform their central
counterparts and hospitals located in different regions were also found to perform
differently. Furthermore, the results of the Malmquist productivity indices showed
that the total factor productivity progressed over the sampled period of 1.4 per cent
per annual. This progress of average productivity was mainly due to the technical
efficiency improvement of 2.2 per cent per year and the worsening of technological
change of 0.8 per cent per year.
The most striking results of this study of the efficiency and productivity in
Vietnamese public hospitals suggest that the structural regulatory changes in the
public hospital sector during the health reform process may have affected the technical
efficiency and productivity of the public hospitals. However, the findings also implied
that these regulatory changes might not have created any improvement in technology.
This may be due to some constraints such as the lack of financial resources for new
technologies, the limited ability of staff in acknowledging and applying new medical
techniques, and the insufficient attention of hospital managers to technological
development in public hospitals. In order to improve the performance of public
hospitals, the regulators in the health sector may need to provide policies to solve these
constraints.
Overall, this paper provides an insight of the performance of public hospitals during
the reform process, which can then assist policy makers in choosing the best regulatory
framework for the ongoing health sector reform process. This analysis also shows that
not only reform programmes but also hospital operating characteristics such as
location and hospital types can affect the performance of hospitals.
Notes
1. The detail of DEA approach is presented in Appendix 1.
Downloaded by Universite Libre de Bruxelles At 19:41 09 February 2015 (PT)
2. The Malquist productivity index approach is detailed in Appendix 1.
References
Aigner, D.J., Lovell, C.A.K. and Schmidt, P. (1977), “Formulation and estimation of stochastic
frontier production function models”, Journal of Econometrics, Vol. 6 No. 1, pp. 21-37.
Banker, R.D., Charnes, A. and Cooper, W.W. (1984), “Some models for estimating technical and
scale inefficiencies in data envelopment analysis”, Management Science, Vol. 30,
pp. 1078-92.
Bloom, G. (1997), “Primary health care meets the market: lessons from China and Vietnam”,
Working Paper 53, IDS, Brighton.
Chang, H., Chang, W., Das, S. and Li, S. (2004), “Health care regulation and the operating
efficiency of hospitals: evidence from Taiwan”, Journal of Accounting and Public Policy,
Vol. 23 No. 6, pp. 483-510.
Charnes, A., Cooper, W.W. and Rhodes, E. (1978), “Measuring the efficiency of decision making
units”, European Journal of Operational Research, Vol. 2, pp. 429-44.
Chen, L.C. and Hiebert, L.G. (1994) “From socialism to private markets: Vietnam’s health in rapid
transition”, working paper, Harvard Center for Population and Development Studies,
Harvard School of Public Health, Cambridge, MA.
Chen, S.N. (2006), “Productivity changes in Taiwanese hospitals and the national health
insurance”, The Service Industries Journal, Vol. 26 No. 4, pp. 459-77.
Chirikos, T.N. and Sear, A.M. (2000), “Measuring hospital efficiency: a comparison of two
approaches”, Health Services Research, Vol. 34 No. 6, pp. 1389-408.
Ersoy, K., Kavuncubasi, S., Ozcan, Y.A. and Harris, J.M. II (1997), “Technical efficiencies of
Turkish hospitals: DEA approach”, Journal of Medical Systems, Vol. 21 No. 2, pp. 67-74.
Fa¨re, R., Grosskopf, S., Lindgren, B. and Roos, P. (1994), “Productivity developments in Swedish
hospitals: a Malmquist output index approach”, in Charnes, A., Cooper, W.W., Lewin, A.Y.
and Seiford, L.M. (Eds), Data Envelopment Analysis: Theory, Methodology and
Applications, Kluwer Academic, Boston, MA, pp. 253-72.
Farrell, M.J. (1957), “The measurement of productive efficiency”, Journal of the Royal Statistical
Society (A, General), Vol. 120, pp. 253-81.
Ferrari, A. (2006), “Market oriented reforms of health services: a non-parametric analysis”,
The Service Industries Journal, Vol. 26 No. 1, pp. 1-13.
Grannemann, T.W., Brown, R.S. and Pauly, M.V. (1986), “Estimating hospital costs:
a multiple-output analysis”, Journal of Health Economics, Vol. 5 No. 2, pp. 107-27.
Hoi, N.D., Kiet, T.D., Ninh, L.H., Hung, T.P., Nguyen, N.D., Loan, N.B., Dung, D.V. and Lich, B.D.
(2000), “Health development during the reform process”, Efficient, Equity-oriented
Strategies for Health: International Perspectives – Focus on Vietnam, The Centre for
International Mental Health, Melbourne.
Hollingsworth, B. (2003), “Non-parametric and parametric applications measuring efficiency in
health care”, Health Care Management Science, Vol. 6 No. 4, pp. 203-18.
Hollingsworth, B., Dawson, P.J. and Maniadakis, N. (1999), “Efficiency measurement of health
care: a review of non-parametric methods and applications”, Health Care Management
Science, Vol. 2 No. 3, pp. 161-72.
Hu, J.-L. and Huang, Y.-F. (2004), “Technical efficiencies in large hospitals: a managerial
perspective”, International Journal of Management, Vol. 21 No. 4, pp. 506-13.
Efficiency of
hospitals in
Vietnam
209
JHOM
25,2
Downloaded by Universite Libre de Bruxelles At 19:41 09 February 2015 (PT)
210
Jacobs, R. (2001), “Alternative methods to examine hospital efficiency: data envelopment analysis
and stochastic frontier analysis”, Health Care Management Science, Vol. 4 No. 2, pp. 103-15.
Kirigia, J.M., Emrouznejad, A. and Sambo, L.G. (2002), “Measurement of technical efficiency of
public hospitals in Kenya: using data envelopment analysis”, Journal of Medical Systems,
Vol. 26 No. 1, pp. 39-45.
Ladinsky, J., Nguyen, H.T. and Volk, N.D. (2000), “Changes in the health care system of Vietnam
in response to the emerging market economy”, Public Health Policy, Vol. 21 No. 1, pp. 82-98.
Magnussen, J. (1996), “Efficiency measurement and the operationalization of hospital
production”, Health Services Research, Vol. 31 No. 1.
Meeusen, W. and Van den Broeck, J. (1977), “Efficiency estimation from Cobb-Douglas
production functions with composed errors”, International Economic Review, Vol. 18 No. 2,
pp. 435-44.
Osei, D., d’Almeida, S., George, M.O., Kirigia, J.M., Mensah, A.O. and Kainyu, L.H. (2005),
“Technical efficiency of public district hospitals and health centres in Ghana: a pilot
study”, Cost Effectiveness and Resource Allocation, Vol. 3 No. 9.
Pilyavsky, A.I. and Staat, M. (2008), “Efficiency and productivity change in Ukrainian health
care”, Journal of Productivity Analysis, Vol. 29, pp. 143-54.
Pilyavsky, A.I., Aaronson, W.E., Bernet, P.M., Rosko, M.D., Valdmanis, V. and Golubchikov,
M.V. (2006), “East-west: does it make a difference to hospital efficiencies in Ukraine?”,
Health Economics, Vol. 15 No. 11, pp. 1173-86.
Sahin, I. and Ozcan, Y.A. (2000), “Public sector hospital efficiency for provincial markets in
Turkey”, Journal of medical Systems, Vol. 24 No. 6, pp. 307-20.
Sepehri, A., Chernomas, R. and Akram-Lodhi, H. (2003), “If they get sick, they are in trouble:
health care restructuring, user charges, and equity in Vietnam”, International Journal of
Health Service, Vol. 33 No. 1, pp. 137-61.
Sepehri, A., Chernomas, R. and Akram-Lodhi, H. (2005), “Penalizing patients and rewarding
providers: user charges and health care utilization in Vietnam”, Health Policy, Vol. 20 No. 2,
pp. 90-9.
Valdmanis, V., Kumanarayake, L. and Lertiendumrong, J. (2004), “Capacity in Thai public
hospitals and the production of care for poor and non-poor patients”, Health Services
Research, Vol. 39 No. 6p2, pp. 2117-34.
World Bank (2005), Vietnam: Managing Public Expenditure for Poverty Reduction and Growth:
Public Expenditure Review and Integrated Fiduciary Assessment, World Bank,
Washington, DC.
Worthington, A.C. (2004), “Frontier efficiency measurement in health care: a review of empirical
techniques and selected applications”, Medical Care Research and Review, Vol. 61 No. 2,
pp. 135-70.
Zere, E., Mbeeli, T., Shangula, K., Mandlhate, C., Mutirua, K., Tjivambi, B. and Kapenambili, W.
(2006), “Technical efficiency of district hospitals: evidence from Namibia using data
envelopment analysis”, Cost Effectiveness and Resource Allocation, Vol. 4 No. 5.
Zere, E., Mcintyre, D. and Addison, T. (2001), “Technical efficiency and productivity of public
sector hospitals in three South African provinces”, The South African Journal of
Economics, Vol. 69 No. 2, pp. 336-58.
Further reading
Coelli, T.J., Rao, D.S. and Battese, G.E. (2005), An Introduction to Efficiency and Productivity
Analysis, Kluwer Academic Publishers, London.
Downloaded by Universite Libre de Bruxelles At 19:41 09 February 2015 (PT)
Fa¨re, R., Grosskopf, S., Norris, M. and Zhang, Z. (1994), “Productivity growth, technical progress,
and efficiency change in industrialized countries”, The American Economic Review, Vol. 84
No. 1, pp. 66-83.
McCallion, G., Glass, J.C., Jackson, R., Kerr, C.A. and McKillop, D.G. (2000), “Investigating
productivity change and hospital size: a nonparametric frontier approach”, Applied
Economics, Vol. 32 No. 2, pp. 161-74.
Maniadakis, N., Hollingsworth, B. and Thanassoulis, E. (1999), “The impact of the internal
market on hospital efficiency, productivity and service quality”, Health Care Management
Science, Vol. 2 No. 2, pp. 75-85.
Ramanathan, R. (2005), “Operations assessment of hospitals in the Sultanate of Oman”,
International Journal of Operations & Production Management, Vol. 25, pp. 39-54.
Appendix 1. Methodology
DEA methodology
Data envelopment analysis method (DEA) constructs production frontiers and measures
efficiency of a decision-making unit (DMU) relative to these constructed frontiers using
mathematical programming technique. This method was first developed by Charnes et al. (1978)
(CCR model) based on the work of Farrell (1957) on efficiency measurement. The CCR model
assumes a production technology with constant returns to scale, implying that any proportional
change in inputs usage result in the same proportional change in outputs. It was then extended
by Banker et al. (1984) (BCC model). The BCC model relaxes the assumption of constant returns
to scale to allow for variable returns to scale. The paper, in the first stage, employs the BCC
model to measure the relative efficiency of hospitals. The input-oriented BCC model is
formulated as follows:
MinE o ¼ uo
subjectto
n
X
lk X ik # uo X io ;i
k¼1
n
X
lk Y rk $ Y ro ;r
k¼1
n
X
lk ¼ 1
k¼1
lk $ 0;k; r; i
where: uo represents the efficiency score of DMU0, which is within a range from zero to one and a
higher score implies a higher efficiency; lk is non-negative values related to the k th DMU.
Malmquist total factor productivity index
The DEA-based Malmquist total factor productivity (TFP) index approach (Fa¨re et al., 1994) is to
measure the productivity changes of DMUs at different points in time, identify the sources of
productivity changes, and decompose total productivity change into technical efficiency change
(the catch-up effect) and technological change (the frontier shift effect). The TFP change index
between period ðtÞ and period ðt þ 1Þ is given by:
Efficiency of
hospitals in
Vietnam
211
JHOM
25,2
Downloaded by Universite Libre de Bruxelles At 19:41 09 February 2015 (PT)
212
M I ðY
tþ1
;X
tþ1
"
#1=2
tþ1
Dtþ1
; X tþ1 Þ DtI ðY tþ1 ; X tþ1 Þ DtI ðY t ; X t Þ
I ðY
;Y ;X Þ ¼
tþ1 ; X tþ1 Þ Dtþ1 ðY t ; X t Þ
DtI ðY t ; X t Þ
Dtþ1
I ðY
I
t
t
where the notion DI denotes the input-based distance function, and M I is the product of technical
efficiency change and technological change. The part outside the square brackets of the equation
represents the technical efficiency change between period ðtÞ and period ðt þ 1Þ, which denotes
the ratio of Farrell technical efficiency in period ðt þ 1Þ over the technical efficiency in period ðtÞ.
Technical efficiency change indicates whether a unit comes closer to (or further away from) its
production frontier when moving from period ðtÞ to period ðt þ 1Þ. The remaining part inside the
square brackets is a measure of technological change. It is the geometric mean of the shift in the
production frontier observed at Y t and the shift in the production frontier observed at Y tþ1 .
Technological change indicates whether the production frontier has shifted between two periods
ðtÞ and ðt þ 1Þ evaluated.
Appendix 2
Inputs
Table AI.
Descriptive statistics for
input variables
Mean
Standard deviation
Minimum value
Maximum value
Total number of beds
1998
363.41
1999
370.81
2000
400.58
2001
404.59
2002
410.16
2003
439.12
2004
449.10
2005
482.51
2006
500.50
195.17
196.73
221.74
220.67
224.84
237.17
236.60
259.32
266.72
60
63
63
70
74
78
80
87
103
1,090
1,090
1,340
1,340
1,360
1,400
1,407
1,550
1,567
Total number of personnel
1998
367.83
1999
381.55
2000
404.58
2001
424.35
2002
449.75
2003
463.06
2004
520.62
2005
537.16
2006
554.99
214.93
224.62
239.59
256.37
284.27
318.75
359.77
369.86
380.23
35
40
42
47
56
64
72
79
85
1,409
1,409
1,409
1,567
1,768
2,206
2,552
2,709
2,830
Appendix 3
Downloaded by Universite Libre de Bruxelles At 19:41 09 February 2015 (PT)
Outputs
Mean
Standard deviation
Total number of outpatient visits
1998
7,970.31
1999
8,554.87
2000
8,517.53
2001
8,717.71
2002
9,532.60
2003
9,660.62
2004
10,455.10
2005
11,143.30
2006
10,920.31
Total number of inpatient days
1998
141,804.14
1999
136,987.77
2000
146,012.08
2001
155,007.44
2002
163,661.26
2003
170,394.30
2004
179,362.98
2005
199,156.47
2006
219,271.34
Total number of surgical operations
1998
3,944.56
1999
4,178.88
2000
4,577.05
2001
4,845.57
2002
5,235.38
2003
5,526.48
2004
5,985.72
2005
6,862.79
2006
7,634.77
Minimum value
Maximum value
21,767.92
22,130.04
22,069.02
22,284.63
24,485.12
25,621.91
28,136.63
28,228.80
25,563.87
80
95
120
118
132
125
162
152
155
175,813
171,215
170,361
167,983
189,281
197,960
207,337
191,450
221,221
80,906.52
78,882.07
85,517.79
92,597.37
98,309.30
105,552.09
116,893.76
124,421.97
133,915.14
15,195
15,823
17,684
19,802
23,451
23,940
27,560
33,017
33,475
473,370
510,700
564,550
599,319
589,425
657,439
749,510
788,145
850,183
4,315.87
4,655.62
5,050.74
5,209.60
5,837.68
5,964.11
6,232.03
6,967.27
7,239.97
86
145
160
176
186
198
210
176
220
30,224
31,708
32,373
33,256
35,612
37,583
37,057
35,839
36,590
About the author
Thuy Linh Pham is a Lecturer in Human Resource Management and Operations Management.
Her research interests include influence of public policy on performance of public and private
organizations, human resource management and operations management in small and medium
enterprises. Thuy Linh Pham can be contacted at:
To purchase reprints of this article please e-mail:
Or visit our web site for further details: www.emeraldinsight.com/reprints
Efficiency of
hospitals in
Vietnam
213
Table AII.
Descriptive statistics for
output variables