DSpace at VNU: Production of associated Y and open charm hadrons in pp collisions at root s=7 and 8 TeV via double parton scattering
Bạn đang xem bản rút gọn của tài liệu. Xem và tải ngay bản đầy đủ của tài liệu tại đây (1.19 MB, 36 trang )
Published for SISSA by
Springer
Received: October
Revised: May
Accepted: June
Published: July
21,
18,
27,
11,
2015
2016
2016
2016
The LHCb collaboration
E-mail:
Abstract: Associated production of bottomonia and open charm hadrons in pp collisions
√
at s = 7 and 8 TeV is observed using data corresponding to an integrated luminosity
of 3 fb−1 accumulated with the LHCb detector. The observation of five combinations,
Υ(1S)D0 , Υ(2S)D0 , Υ(1S)D+ , Υ(2S)D+ and Υ(1S)D+
s , is reported. Production cross0
+
sections are measured for Υ(1S)D and Υ(1S)D pairs in the forward region. The measured
cross-sections and the differential distributions indicate the dominance of double parton
scattering as the main production mechanism.
Keywords: Forward physics, Hadron-Hadron scattering (experiments), Hard scattering,
Heavy quark production, QCD
ArXiv ePrint: 1510.05949
Open Access, Copyright CERN,
for the benefit of the LHCb Collaboration.
Article funded by SCOAP3 .
doi:10.1007/JHEP07(2016)052
JHEP07(2016)052
Production of associated Υ and open charm hadrons
√
in pp collisions at s = 7 and 8 TeV via double
parton scattering
Contents
1
2 Detector and data sample
3
3 Event selection
4
4 Signal extraction and cross-section determination
5
5 Kinematic distributions of ΥC events
13
6 Systematic uncertainties
16
7 Results and discussion
21
8 Summary
24
The LHCb collaboration
31
1
Introduction
Production of multiple heavy quark pairs in high-energy hadron collisions was first observed
in 1982 by the NA3 collaboration in the channels π− (p) nucleon → J/ψ J/ψ + X [1, 2]. Soon
after, evidence for the associated production of four open charm particles in pion-nucleon reactions was obtained by the WA75 collaboration [3]. A measurement of J/ψ pair production
√
in proton-proton (pp) collisions at s = 7 TeV [4] has been made by the LHCb collaboration in 2011. This measurement appears to be in good agreement with two models within
the single parton scattering (SPS) mechanism, namely non-relativistic quantum chromodynamics (NRQCD) calculations [5] and kT -factorization [6]. However the obtained result
also agrees with predictions [7] of the double parton scattering (DPS) mechanism [8–12].
The production of J/ψ pairs has also been observed by the D0 [13] and CMS [14] collaborations. A large double charm production cross-section involving open charm in pp col√
lisions at s = 7 TeV has been observed by the LHCb collaboration [15]. The measured
cross-sections exceed the SPS expectations significantly [16–20] and agree with the DPS
estimates. A study of differential distributions supports a large role for the DPS mechanism
in multiple production of heavy quarks.
The study of (bb)(cc) production in hadronic collisions started with the observation of
B+
mesons
in pp collisions by the CDF collaboration [21]. A detailed study of B+
c
c production spectra in pp collisions by the LHCb collaboration [22] showed good agreement with
leading-order NRQCD calculations [23–25] including the SPS contribution only.
–1–
JHEP07(2016)052
1 Introduction
The leading-order NRQCD calculations using the same matrix element as in ref. [23],
applied to another class of (bb)(cc) production, namely associated production of bottomonia and open charm hadrons in the forward region, defined in terms of the rapidity y
as 2 < y < 4.5, predict [26]
RSPS =
σΥcc
= (0.2–0.6) % ,
σΥ
(1.1)
RSPS =
σΥcc
= (0.1–0.3) % .
σΥ
(1.2)
Within the DPS mechanism, the Υ meson and cc-pair are produced independently in
different partonic interactions. Neglecting the parton correlations in the proton, the contribution of this mechanism is estimated according to the formula [38–40]
σΥ × σcc
,
σeff
σΥcc =
(1.3)
where σcc and σΥ are the inclusive charm and Υ cross-sections, and σeff is an effective
cross-section, which provides the proper normalization of the DPS cross-section estimate.
The latter is related to the transverse overlap function between partons in the proton.
Equation (1.3) can be used to calculate the ratio RDPS as
RDPS =
σΥcc
σcc
=
.
σΥ
σeff
(1.4)
Using the measured production cross-section for inclusive charm in pp collisions at the
centre-of-mass energy 7 TeV [41] in the forward region and σeff ∼ 14.5 mb [42, 43], one obtains RDPS ∼ 10%, which is significantly larger than RSPS from eq. (1.1). The production
√
cross-sections for Υ(1S)D0 and Υ(1S)D+ at s = 7 TeV are calculated using the measured prompt charm production cross-section from ref. [41] and the Υ(1S) cross-section
from ref. [44]. In the LHCb kinematic region, covering transverse momenta pT and
rapidity y of Υ(1S) and D0,+ mesons of pT (Υ(1S)) < 15 GeV/c, 1 < pT (D0,+ ) < 20 GeV/c,
2.0 < y(Υ(1S)) < 4.5 and 2.0 < y(D0,+ ) < 4.5, the expected production cross-sections are
(1S)D0
Bà+ à ì s=7 TeV
DPS
(1S)D+
Bà+ à × σ√s=7 TeV
DPS
= 206 ± 17 pb,
(1.5a)
= 86 ± 10 pb,
(1.5b)
where Bµ+ µ− is the branching fraction of Υ(1S) → µ+ µ− [45], σeff = 14.5 mb is used with
no associated uncertainty included [42, 43]. The basic DPS formula, eq. (1.3), leads to
–2–
JHEP07(2016)052
where σΥcc denotes the production cross-section for associated production of Υcc-pair and
σΥ denotes the inclusive production cross-section of Υ mesons. A slightly smaller value of
RSPS is obtained through the kT -factorization approach [17, 27–34] using the transverse
momentum dependent gluon density from refs. [35–37],
the following predictions for the ratios of production cross-sections RD
0
0
0
σΥ(2S)D
= B2/1 Υ(1S)D0
σ
Υ(2S)/Υ(1S)
and RC
0
σΥD
σD
R
= ΥD+ = D+ = 2.41 ± 0.18 ,
σ
σ
+
Υ(2S)D
Υ(2S)
σ
σ
= B2/1 Υ(1S)D+ = B2/1 Υ(1S) = 0.249 ± 0.033 ,
σ
σ
D0 /D+
Υ(2S)/Υ(1S)
RC
0 /D+
(1.6a)
(1.6b)
+
Here we report the first observation of associated production of bottomonia and open
charm hadrons. The production cross-sections and the differential distributions are measured. The latter provide crucial information for understanding the production mechanism.
The analysis is performed using the Run 1 data set recorded by the LHCb detector, consist√
ing of 1 fb−1 of integrated luminosity accumulated at s = 7 TeV and 2 fb−1 accumulated
at 8 TeV.
2
Detector and data sample
The LHCb detector [46, 47] is a single-arm forward spectrometer covering the pseudorapidity range 2 < η < 5, designed for the study of particles containing b or c quarks. The detector includes a high-precision tracking system consisting of a silicon-strip vertex detector
surrounding the pp interaction region, a large-area silicon-strip detector located upstream
of a dipole magnet with a bending power of about 4 Tm, and three stations of siliconstrip detectors and straw drift tubes placed downstream of the magnet. The tracking
system provides a measurement of the momentum, p, of charged particles with a relative
uncertainty that varies from 0.5% at low momentum to 1.0% at 200 GeV/c. The minimum
distance of a track to a primary vertex, the impact parameter, is measured with a resolution of (15 + 29/pT ) µm, where pT is the component of the momentum transverse to
the beam, in GeV/c. Different types of charged hadrons are distinguished using information
from two ring-imaging Cherenkov detectors. Photons, electrons and hadrons are identified by a calorimeter system consisting of scintillating-pad and preshower detectors, an
electromagnetic calorimeter and a hadronic calorimeter. Muons are identified by a system
composed of alternating layers of iron and multiwire proportional chambers. The online
event selection is performed by a trigger [48], which consists of a hardware stage, based on
information from the calorimeter and muon systems, followed by a software stage, which
applies a full event reconstruction. At the hardware stage, events for this analysis are
selected requiring dimuon candidates with a product of their transverse momenta pT lar√
ger than 1.7 (2.6) GeV2 /c2 for data collected at s = 7 (8) TeV. In the subsequent software
trigger, two well reconstructed tracks are required to have hits in the muon system, to have
pT > 500 MeV/c and p > 6 GeV/c and to form a common vertex. Only events with a dimuon
candidate with a mass mµ+ µ− larger than 4.7 GeV/c2 are retained for further analysis.
–3–
JHEP07(2016)052
where σD , σD and σΥ stand for the measured production cross-sections of D0 , D+ and
Υ mesons [41, 44], and B2/1 is the ratio of dimuon branching fractions of Υ(2S) and
Υ(1S) mesons.
The simulation is performed using the LHCb configuration [49] of the Pythia 6
event generator [50]. Decays of hadronic particles are described by EvtGen [51] in
which final-state photons are generated using Photos [52]. The interaction of the generated particles with the detector, and its response, are implemented using the Geant4
toolkit [53, 54] as described in ref. [55].
3
Event selection
–4–
JHEP07(2016)052
The event selection strategy is based on the independent selection of Υ(1S), Υ(2S) and
Υ(3S) mesons (jointly referred to by the symbol Υ throughout the paper) and charmed
+
hadrons, namely D0 , D+ and D+
s mesons and Λc baryons (jointly referred to by the symbol C herafter) originating from the same pp collision vertex. The Υ candidates are recon+ − +
structed via their dimuon decays, and the D0 → K− π+ , D+ → K− π+ π+ , D+
s →K K π
− +
and Λ+
c → pK π decay modes are used for the reconstruction of charm hadrons. Charge
conjugate processes are implied throughout the paper. The fiducial region for this analysis
is defined in terms of the pT and the rapidity y of Υ and C hadrons to be pΥ
T < 15 GeV/c,
Υ
C
C
2.0 < y < 4.5, 1 < pT < 20 GeV/c and 2.0 < y < 4.5.
The event selection for Υ → µ+ µ− candidates follows previous LHCb studies [44],
and the selection of C hadrons follows refs. [15, 56]. Only good quality tracks [57], identified as muons [58], kaons, pions or protons [59] are used in the analysis. A good qual+ − +
ity vertex is required for Υ → µ+ µ− , D0 → K− π+ , D+ → K− π+ π+ , D+
s → K K π and
− +
+
+ − +
+ −
Λ+
c → pK π candidates. For Ds → K K π candidates, the mass of the K K pair is
+
required to be in the region mK+ K− < 1.04 GeV/c2 , which is dominated by the D+
s → φπ
decay. To suppress combinatorial background the decay time of C hadrons is required to
exceed 100 µm/c. Full decay chain fits are applied separately for selected Υ and C candidates [60]. For Υ mesons it is required that the vertex is compatible with one of the reconstructed pp collision vertices. In the case of long-lived charm hadrons, the momentum
direction is required to be consistent with the flight direction calculated from the locations
of the primary and secondary vertices. The reduced χ2 of these fits, both χ2fit (Υ) /ndf and
χ2fit (C) /ndf, are required to be less than 5, where ndf is the number of degrees of freedom
in the fit. The requirements favour the selection of charm hadrons produced promptly at
the pp collision vertex and significantly suppress the feed down from charm hadrons produced in decays of beauty hadrons. The contamination of such C hadrons in the selected
sample varies between (0.4 ± 0.2)% for D+ mesons to (1.5 ± 0.5)% for Λ+
c baryons.
The selected Υ and C candidates are paired to form ΥC candidates. A global fit to
the ΥC candidates is performed [60], similar to that described above, which requires both
hadrons to be consistent with originating from a common vertex. The reduced χ2 of this fit,
χ2fit (ΥC) /ndf, is required to be less than 5. This reduces the background from the pile-up
of two independent pp interactions producing separately a Υ meson and C hadron to
a negligible level, keeping 100% of the signal Υ mesons and C hadrons from the same
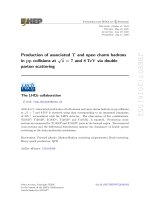
primary vertex. The two-dimensional mass distributions for ΥC pairs after the selection
are displayed in figure 1.
LHCb
ΥD0
N/(100 × 5 MeV2 /c4 )
b)
250
200
150
100
50
N/(100 × 10 MeV2 /c4 )
c)
m µ+ µ−
2
GeV/c
1.89
1.88
K − 1.871.86
π+
1.85
π+
G 1.84
eV/
c2
LHCb
ΥD+
s
d)
16
14
12
10
8
6
4
2
2
m
140
120
100
80
60
40
20
m
10.5
10
9.5
1.98
1.96
K−
K+
1.94
π+
Ge 1.92
V/
c2
10
9.5
m µ+ µ−
LHCb
ΥD+
10.5
2
GeV/c
10.5
10
9.5
m µ+ µ−
2
GeV/c
LHCb
ΥΛ+
c
10
8
6
4
2
2.31
m
pK
2.3
2.29
2.28
−
π+
2.27
G 2.26
eV/
c2
10
9.5
m µ+ µ−
10.5
2
GeV/c
Figure 1. Invariant mass distributions for selected combination of Υ mesons and C hadrons:
+
a) ΥD0 , b) ΥD+ , c) ΥD+
s and d) ΥΛc .
4
Signal extraction and cross-section determination
The event yields are determined using unbinned extended maximum likelihood fits to
the two-dimensional ΥC mass distributions of the selected candidates. The fit model is
a sum of several components, each of which is the product of a dimuon mass distribution,
corresponding to an individual Υ state or combinatorial background, and a C candidate mass distribution, corresponding to a C signal or combinatorial background component. The Υ(1S) → µ+ µ− , Υ(2S) → µ+ µ− and Υ(3S) → µ+ µ− signals are each modelled
by a double-sided Crystal Ball function [4, 61, 62] and referred to as SΥ in this section.
A modified Novosibirsk function [63] (referred to as SC ) is used to describe the D0 → K− π+ ,
+ − +
+
− +
D + → K − π+ π+ , D +
s → K K π and Λc → pK π signals. All shape parameters and
signal peak positions are fixed from fits to large inclusive Υ → µ+ µ− and C hadron
data samples. Combinatorial background components Bµ+ µ− and BC are modelled with
a product of exponential and polynomial functions
B(m) ∝ e−βm × Pn (m),
–5–
(4.1)
JHEP07(2016)052
1.89
1.88
K − 1.871.86
π+
Ge 1.851.84
V/
c2
m
N/(100 × 10 MeV2 /c4 )
N/(100 × 5 MeV2 /c4 )
a)
with a slope parameter β and a polynomial function Pn , which is represented as a B´ezier
sum of basic Bernstein polynomials of order n with non-negative coefficients [64]. For the
large yield ΥD0 and ΥD+ samples, the second-order polynomials (n = 2) are used in the fit,
+
while n = 1 is used for the ΥD+
s and ΥΛc cases.
These basic functions are used to build the components of the two dimensional mass
fit following ref. [15]. For each C hadron the reconstructed signal sample consists of the following components:
– Three components describing the production of single Υ mesons together with combinatorial background for the C signal: each component is modelled by a product of
the signal Υ component, SΥ (mµ+ µ− ) and the background component BC (mC ).
– Single production of C hadrons together with combinatorial background for the Υ
component: this is modelled by a product of the signal C component, SC (mC ), and
the background component Bµ+ µ− (mµ+ µ− ).
– Combinatorial background: this is modelled by a product of the individual background components Bµ+ µ− (mµ+ µ− ) and BC (mC ).
For each C hadron the complete fit function F (mµ+ µ− , mC ) is
F (mµ+ µ− , mC ) = N (1S)C ì S(1S) (mà+ à ) ì SC (mC )
+ N (2S)C ì S(2S) (mà+ à ) ì SC (mC )
+ N (3S)C ì S(3S) (mà+ à ) × SC (mC )
+ N Υ(1S)B × SΥ(1S) (mµ+ µ− ) ì BC (mC )
+ N (2S)B ì S(2S) (mà+ µ− ) × BC (mC )
(4.2)
+ N Υ(3S)B × SΥ(3S) (mà+ à ) ì BC (mC )
+ N BC ì Bà+ à (mà+ à ) ì SC (mC )
+ N BB ì Bà+ à (mà+ à ) ì BC (mC ),
where the different coefficients N ΥC , N ΥB , N BC and N BB are the yields of the eight
components described above.
The fit results are summarized in table 1, and the fit projections are presented in
figures 2, 3, 4 and 5. The statistical significances of the signal components are determined using a Monte-Carlo technique with a large number of pseudoexperiments. They
are presented in table 2. For the five modes, Υ(1S)D0 , Υ(2S)D0 , Υ(1S)D+ , Υ(2S)D+ and
Υ(1S)D+
s , the significances exceed five standard deviations. No significant signals are found
for the associated production of Υ mesons and Λ+
c baryons.
The possible contribution from pile-up events is estimated from data following the
method from refs. [15, 56] by relaxing the requirement on χ2fit (ΥC) /ndf. Due to the requirements χ2fit (Υ) /ndf < 5 and χ2fit (C) /ndf < 5, the value of χ2fit (ΥC) /ndf does not
exceed 5 units for signal events with Υ and C hadron from the same pp collision vertex.
–6–
JHEP07(2016)052
– Three ΥC signal components: each is modelled by a product of the individual signal Υ components, SΥ(1S) (mµ+ µ− ), SΥ(2S) (mµ+ µ− ) or SΥ(3S) (mµ+ µ− ), and signal C
hadron component, SC (mC ).
D0
D+
D+
s
Λ+
c
Υ(1S)
Υ(2S)
Υ(3S)
980 ± 50
556 ± 35
31 ± 7
11 ± 6
184 ± 27
116 ± 20
9±5
1±4
60 ± 22
55 ± 17
6±4
1±3
Table 1. Signal yields N ΥC for ΥC production, determined with two-dimensional extended unbinned maximum likelihood fits to the candidate ΥC samples.
Υ(2S)
Υ(3S)
> 5 (26)
> 5 (19)
> 5 (6)
2.5
> 5 (7.7)
> 5 (6.4)
2.5
0.9
3.1
4.0
1.9
0.9
Table 2. Statistical significances of the observed ΥC signals in units of standard deviations determined using pseudoexperiments. The values in parentheses indicate the statistical significance
calculated using Wilks’ theorem [65].
The background is subtracted using the sPlot technique [66]. The χ2fit (ΥC) /ndf distributions are shown in figure 6. The distributions exhibit two components: the peak at
low χ2 is attributed to associated ΥC production, and the broad structure at large values
of χ2 corresponds to the contribution from pile-up events. The distributions are fitted
with a function that has two components, each described by a Γ-distribution. The shape is
motivated by the observation that χ2fit /ndf should follow a scaled-χ2 distribution. The possible contribution from pile-up events is estimated by integrating the pile-up component in
the region χ2fit (ΥC) /ndf < 5. It does not exceed 1.5% for all four cases and is neglected.
The production cross-section is determined for the four modes with the largest yield:
Υ(1S)D0 , Υ(2S)D0 , Υ(1S)D+ and Υ(2S)D+ . The cross-section is calculated using a subsample of events where the reconstructed Υ candidate is explicitly matched to the dimuon
candidate that triggers the event. This requirement reduces signal yields by approximately 20%, but allows a robust determination of trigger efficiencies. The cross-section for
the associated production of Υ mesons with C hadrons in the kinematic range of LHCb is
calculated as
1
Bà+ à ì C =
N C ,
(4.3)
L ì BC corr
where L is the integrated luminosity [67], Bµ+ µ− and BC are the world average branching
ΥC is the efficiencyfractions of Υ → µ+ µ− and the charm decay modes [45], and Ncorr
corrected yield of the signal ΥC events in the kinematic range of this analysis. Production
√
cross-sections are determined separately for data sets accumulated at s = 7 and 8 TeV.
ΥC are determined using an extended unbinned
The efficiency-corrected signal yields Ncorr
maximum likelihood fit to the weighted two-dimensional invariant mass distributions of
the selected ΥC candidates. The weight ω for each event is calculated as ω = 1/εtot ,
where εtot is the total efficiency for the given event.
–7–
JHEP07(2016)052
D0
D+
D+
s
Λ+
c
Υ(1S)
250
a)
250
Candidates/(2 MeV/c2 )
Candidates/(20 MeV/c2 )
300
LHCb
ΥD0
200
150
100
50
9.5
10
10.5
mµ+ µ−
GeV/c
50
1.84
1.86
1.88
1.9
1.92
GeV/c2
80
90
c)
80
Candidates/(2 MeV/c2 )
Candidates/(2 MeV/c2 )
100
m K − π+
100
LHCb
Υ(2S)D0
70
60
50
40
30
20
10
0
1.82
150
0
1.82
11
2
LHCb
Υ(1S)D0
1.84
1.86
1.88
mK− π+
1.9
GeV/c
1.92
2
70
d)
60
LHCb
Υ(3S)D0
50
40
30
20
10
0
1.82
1.84
1.86
1.88
m K − π+
1.9
1.92
2
GeV/c
Figure 2.
Projections from two-dimensional extended unbinned maximum likelihood fits in bands a) 1.844 < mK− π+ < 1.887 MeV/c2 , b) 9.332 < mµ+ µ− < 9.575 GeV/c2 ,
c) 9.889 < mµ+ µ− < 10.145 GeV/c2 and d) 10.216 < mµ+ µ− < 10.481 GeV/c2 .
The total fit
function is shown by a solid thick (red) curve; three individual ΥD 0 signal components are shown
by solid thin (red) curves; three components describing Υ signals and combinatorial background
in K− π+ mass are shown with short-dashed (blue) curves; the component modelling the true
D0 signal and combinatorial background in µ+ µ− mass is shown with a long-dashed (green) curve
and the component describing combinatorial background is shown with a thin dotted (black) line.
The effective DPS cross-section and the ratios RΥC are calculated as
σΥ × σ C
,
σΥC
σΥC
= Υ ,
σ
σeff =
RΥC
(4.4a)
(4.4b)
where σΥ is the production cross-section of Υ mesons taken from ref. [44]. The double√
differential production cross-sections of charm mesons has been measured at s = 7 TeV in
the region 2.0 < y C < 4.5, pCT < 8 GeV/c [41]. According to FONLL calculations [68–70], the
contribution from the region 8 < pCT < 20 GeV/c is significantly smaller than the uncertainty
for the measured cross-section in the region 1 < pCT < 8 GeV/c. It allows to estimate the pro-
–8–
JHEP07(2016)052
0
9
b)
200
120
180
a)
160
Candidates/(2 MeV/c2 )
Candidates/(20 MeV/c2 )
200
LHCb
ΥD+
140
120
100
80
60
40
20
9.5
10
10.5
mµ+ µ−
GeV/c
60
40
20
0
1.82
1.84
1.86
1.88
1.9
GeV/c2
m K − π+ π+
50
45
c)
40
Candidates/(2 MeV/c2 )
Candidates/(2 MeV/c2 )
80
11
2
50
LHCb
Υ(2S)D+
35
30
25
20
15
10
5
0
1.82
LHCb
Υ(1S)D+
1.84
1.86
1.88
mK− π+ π+
45
d)
40
LHCb
Υ(3S)D+
35
30
25
20
15
10
5
0
1.82
1.9
GeV/c2
1.84
1.86
1.88
m K − π+ π+
1.9
GeV/c2
Figure 3.
Projections from two-dimensional extended unbinned maximum likelihood
fits in bands a) 1.848 < mK− π+ π+ < 1.891 MeV/c2 , b) 9.332 < mµ+ µ− < 9.575 GeV/c2 ,
c) 9.889 < mµ+ µ− < 10.145 GeV/c2 and d) 10.216 < mµ+ µ− < 10.481 GeV/c2 . The total fit
function is shown by a solid thick (red) curve; three individual ΥD + signal components are shown
by solid thin (red) curves; three components describing Υ signals and combinatorial background
in K− π+ π+ mass are shown with short-dashed (blue) curves; the component modelling the true
D+ signal and combinatorial background in µ+ µ− mass is shown with a long-dashed (green) curve
and the component describing combinatorial background is shown with a thin dotted (black) line.
duction cross-section of charm mesons in the region 2.0 < y C < 4.5, 1 < pCT < 20 GeV/c,
√
used in eq. (4.4a). For the production cross-section of charm mesons at s = 8 TeV,
√
FONLL (p , y) of the
the measured cross-section at s = 7 TeV is rescaled by the ratio R8/7
T
√
double-differential cross-sections, as calculated with FONLL [68–70] at s = 8 and 7 TeV.
0
+
Υ(2S)/Υ(1S)
The ratios RD /D and RC
, defined in eq. (1.6), are calculated as
0
R
D0 /D+
Υ(2S)/Υ(1S)
RC
0
σΥD
N ΥD
= ΥD+ = corr
,
ΥD+
σ
Ncorr
= B2/1
εΥ(1S)C
σΥ(2S)C
N Υ(2S)C
=
×
,
Υ(1S)C
Υ(1S)C
σ
N
εΥ(2S)C
–9–
(4.5a)
(4.5b)
JHEP07(2016)052
0
9
b)
100
20
a)
25
Candidates/(4 MeV/c2 )
Candidates/(50 MeV/c2 )
30
LHCb
ΥD+
s
20
15
10
5
9.5
10
10.5
mµ+ µ−
GeV/c
12
10
8
6
4
2
1.95
2
m(K− K+ )φ π+ GeV/c2
10
9
c)
8
Candidates/(4 MeV/c2 )
Candidates/(4 MeV/c2 )
LHCb
Υ(1S)D+
s
14
0
1.9
11
2
10
LHCb
Υ(2S)D+
s
7
6
5
4
3
2
1
0
1.9
b)
1.95
d)
8
LHCb
Υ(3S)D+
s
7
6
5
4
3
2
1
0
1.9
2
m(K− K+ )φ π+
9
1.95
GeV/c2
2
m(K− K+ )φ π+ GeV/c2
Figure 4.
Projections from two-dimensional extended unbinned maximum likelihood
fits in bands a) 1.952 < m(K− K+ )φ π+ < 1.988 MeV/c2 , b) 9.332 < mµ+ µ− < 9.575 GeV/c2 ,
c) 9.889 < mµ+ µ− < 10.145 GeV/c2 and d) 10.216 < mµ+ µ− < 10.481 GeV/c2 . The total fit function is shown by a solid thick (red) curve; three individual ΥD +
s signal components are shown by
solid thin (red) curves; three components describing Υ signals and combinatorial background in
(K− K+ )φ π+ mass are shown with short-dashed (blue) curves; the component modelling the true
+ −
D+
s signal and combinatorial background in µ µ mass is shown with a long-dashed (green) curve
and the component describing combinatorial background is shown with a thin dotted (black) line.
where εΥC denotes the average efficiency. Within the DPS mechanism, the transverse
momenta and rapidity spectra of C mesons for the signal Υ(1S)C and Υ(2S)C events are
expected to be the same. This allows to express the ratio of the average εΥC efficiencies
in terms of ratio of average efficiencies for inclusive Υ mesons
εΥ(1S)C
εΥ(2S)C
=
and the latter is taken from ref. [44].
– 10 –
εΥ(1S)
εΥ(2S)
,
(4.6)
JHEP07(2016)052
0
9
18
16
20
a)
25
Candidates/(6 MeV/c2 )
Candidates/(100 MeV/c2 )
30
LHCb
ΥΛ+
c
20
15
10
5
9.5
10
10.5
mµ+ µ−
GeV/c
10
8
6
4
2
2.26
2.28
2.3
2.32
GeV/c2
10
9
c)
8
Candidates/(6 MeV/c2 )
Candidates/(6 MeV/c2 )
12
mpK− π+
10
LHCb
Υ(2S)Λ+
c
7
6
5
4
3
2
1
0
2.24
LHCb
Υ(1S)Λ+
c
14
0
2.24
11
2
b)
2.26
2.28
mpK− π+
2.3
9
LHCb
Υ(3S)Λ+
c
7
6
5
4
3
2
1
0
2.24
2.32
d)
8
GeV/c2
2.26
2.28
mpK− π+
2.3
2.32
GeV/c2
Figure 5.
Projections from two-dimensional extended unbinned maximum likelihood
fits in bands a) 2.273 < mpK− π+ < 2.304 MeV/c2 , b) 9.332 < mµ+ µ− < 9.575 GeV/c2 ,
c) 9.889 < mµ+ µ− < 10.145 GeV/c2 and d) 10.216 < mµ+ µ− < 10.481 GeV/c2 . The total fit
function is shown by a solid thick (red) curve; three individual ΥΛ +
c signal components are shown
by solid thin (red) curves; three components describing Υ signals and combinatorial background
in pK− π+ mass are shown with short-dashed (blue) curves; the component modelling the true
+ −
Λ+
mass is shown with a long-dashed green curve
c signal and combinatorial background in µ µ
and the component describing combinatorial background is shown with a thin dotted (black) line.
The total efficiency εtot , for each ΥC candidate is calculated following ref. [15] as
tot
tot
εtot
ΥC = εΥ × εC ,
(4.7)
tot
and applied individually an on event-by-event basis, where εtot
Υ and εC are the total
efficiencies for Υ and charm hadrons respectively. These efficiencies are calculated as
trg
àID
rec
tot
= ì ì ,
(4.8a)
rec
hID
tot
C = εC × εC ,
(4.8b)
where εrec is the detector acceptance, reconstruction and event selection efficiency and
εtrg is the trigger efficiency for selected events. The particle identification efficiencies for
– 11 –
JHEP07(2016)052
0
9
18
16
250
350
a)
LHCb
ΥD0
b)
fit
200
dN
χ2fit dχ
2
dN
χ2fit dχ
2
fit
300
ln 10
0.2
ln 10
0.2
400
250
200
150
LHCb
ΥD+
150
100
100
50
50
0
0
2
4
6
−2
0
log10 χ2fit ΥD0 /ndf
35
c)
6
LHCb
ΥD+
s
d)
15
LHCb
ΥΛ+
c
fit
30
25
dN
χ2fit dχ
2
fit
4
20
ln 10
0.5
ln 10
0.5
40
dN
χ2fit dχ
2
2
log10 χ2fit (ΥD+ ) /ndf
20
15
10
5
10
5
0
0
−2
0
2
4
2
+
log10 χfit (ΥDs ) /ndf
6
−2
0
2
4
2
+
log10 χfit (ΥΛc ) /ndf
6
Figure 6. Background-subtracted distributions of χ2fit (C) /ndf for a) ΥD0 , b) ΥD+ , c) ΥD+
s and
+
2
d) ΥΛc cases. A thin vertical (green) line indicates the requirement χfit (ΥC) /ndf < 5 used in the
analysis. The solid (red) curves indicate a fit to a sum of two components, each described by
Γ-distribution shape. The pileup component is shown with a dashed (blue) line.
Υ and C candidates εµID
and hID
are calculated as
C
ID
ID
àID
= à + ì à ,
hID
=
C
ID
K ×
K
(4.9a)
εID
π
(4.9b)
π
ID
ID
where εID
µ± , εK and επ are the efficiencies for the single muon, kaon and pion identification,
respectively.
The efficiencies εrec and εtrg are determined using simulated samples of Υ, D0 and
D+ events as a function of pT and y of the Υ and the C hadron. The differential treatment
results in a robust determination of the efficiency-corrected signal yields, with no dependence on the particle spectra in the simulated samples. The derived values of the efficiencies
are corrected to account for small discrepancies in the detector response between data and
simulation. These corrections are obtained using data-driven techniques [57, 58].
– 12 –
JHEP07(2016)052
0
−2
5
Kinematic distributions of ΥC events
The differential distributions are important for the determination of the production mechanism. In this section, the shapes of differential distributions for Υ(1S)D 0 and Υ(1S)D+
events are studied. Assuming that the production mechanism of ΥC events is essentially
√
the same at s = 7 and 8 TeV, both samples are treated together in this section.
The normalized differential distribution for each variable v is calculated as
ΥC
1 dσ
1 Ncorr,i
= ΥC
,
σ dv
Ncorr ∆v
(5.1)
ΥC is the number of efficiency-corrected signal events in bin i of width ∆v, and
where Ncorr,i
ΥC is the total number of efficiency-corrected events. The differential distributions are
Ncorr
presented for the following variables
Υ(1S)
– pT
, the transverse momentum of the Υ(1S) meson;
– pCT , the transverse momentum of the D0 (D+ ) meson;
– y Υ(1S) , the rapidity of the Υ(1S) meson;
– y C , the rapidity of the D0 (D+ ) meson;
– ∆φ = φΥ(1S) − φC , the difference in azimuthal angles between the Υ(1S) and the
C mesons;
– ∆y = y Υ(1S) − y C , the difference in rapidity between the Υ(1S) and the C mesons;
Υ(1S)C
– pT
, the transverse momentum of the Υ(1S)C system;
1
The CMS measurements for Υ(1S) mesons are consistent with small transverse polarisation in the helicity frame with the central values for the polarisation parameter 0 λϑ 0.2 [73].
– 13 –
JHEP07(2016)052
The efficiencies for muon, kaon and pion identification are determined directly from
data using large samples of low-background J/ψ → µ+ µ− and D∗+ → D0 → K− π+ π+ decays. The identification efficiencies are evaluated as a function of the kinematic parameters
of the final-state particles, and the track multiplicity in the event [59].
The efficiency is dependent on the polarisation of the Υ mesons [44, 62, 71, 72] The po√
larisation of the Υ mesons produced in pp collisions at s = 7 TeV at high pΥ
T and central
rapidity has been studied by the CMS collaboration [73] in the centre-of-mass helicity,
Collins-Soper [74] and the perpendicular helicity frames. No evidence of significant transverse or longitudinal polarisation has been observed for the region 10 < pΥ
T < 50 GeV/c,
Υ
y < 1.2. Therefore, the efficiencies are calculated under the assumption of unpolarised production of Υ mesons and no corresponding systematic uncertainty is assigned on
the cross-section.
Under the assumption of transversely polarised Υ mesons with λϑ = 0.2 in the LHCb
kinematic region,1 the total efficiency would result in an decrease of 3% [44].
a)
0.2
1
1 GeV/c
0.25
LHCb
Υ(1S)D0
0.15
1 dσ
σ dpΥ
T
1 dσ
σ dpΥ
T
1
1 GeV/c
0.25
0.1
0.05
b)
0.2
LHCb
Υ(1S)D+
0.15
0.1
0.05
0
0
5
10
Υ(1S)
pT
15
0
5
10
Υ(1S)
[GeV/c]
pT
c)
1
1 GeV/c
1
1
1 GeV/c
1
15
[GeV/c]
LHCb
Υ(1S)D0
LHCb
Υ(1S)D+
10−1
1 dσ
σ dpC
T
1 dσ
σ dpC
T
10−1
d)
10−2
10−3
0
10−2
2
4
6
pD
T
0
8
10
[GeV/c]
10−3
0
2
4
pD
T
6
+
8
10
[GeV/c]
C
Figure 7. Background-subtracted and efficiency-corrected pΥ
T (top) and pT (bottom) distribu0
+
tions for Υ(1S)D events (left) and Υ(1S)D event (right). The transverse momentum spectra,
derived within the DPS mechanism using the measurements from refs. [41, 44], are shown with
the open (blue) squares. The SPS predictions [75] for the pΥ
T spectra are shown with dashed (orange)
and long-dashed (magenta) curves for calculations based on the kT -factorization and the collinear
approximation, respectively. All distributions are normalized to unity.
– y Υ(1S)C , the rapidity of the Υ(1S)C system;
– AT =
Υ(1S)
− pCT
Υ(1S)
+ pCT
pT
pT
, the pT asymmetry for the Υ(1S) and the C mesons;
– mΥ(1S)C , the mass of the Υ(1S)C system.
The distributions are shown in figures 7, 8, 9, 10 and 11. Only statistical uncertainties are
displayed on these figures, as the systematic uncertainities discussed in section 6 are small.
For all variables the width of the resolution function is much smaller than the bin width,
i.e. the results are not affected by bin-to-bin migration.
The shapes of the measured differential distributions are compared with the SPS
and DPS predictions. The DPS predictions are deduced from the measurements given in
refs. [41, 44], using a simplified simulation assuming uncorrelated production of the Υ(1S)
– 14 –
JHEP07(2016)052
0
a)
LHCb
Υ(1S)D0
0.4
0.3
0.2
0.2
0.1
0.1
3
y
3.5
Υ(1S)
4
0
2
4.5
0.35
c)
1
0.5
1
0.5
3.5
4
4.5
4
4.5
0.4
LHCb
Υ(1S)D0
0.35
0.25
0.2
0.15
0.15
0.1
0.1
0.05
0.05
3
3.5
y
4
4.5
D0
LHCb
Υ(1S)D+
0.25
0.2
2.5
d)
0.3
1 dσ
σ dy C
0.3
1 dσ
σ dy C
3
y Υ(1S)
0.4
0
2
2.5
0
2
2.5
3
3.5
+
D
y
Figure 8. Background-subtracted and efficiency-corrected y Υ (top) and y C (bottom) distributions
for Υ(1S)D0 (left) and Υ(1S)D+ (right) events. The rapidity spectra, derived within the DPS mechanism using the measurements from refs. [41, 44], are shown with the open (blue) squares. The SPS
predictions [75] for the y Υ spectra are shown with dashed (orange) and long-dashed (magenta) curves
for calculations based on the kT -factorization and the collinear approximation, respectively. All distributions are normalized to unity.
and charm hadron. The agreement between all measured distributions and the DPS predictions is good. For the SPS mechanism, the predictions [75] based on kT -factorization [17,
27–34] using the transverse momentum dependent gluon density from refs. [35–37] are used
along with the collinear approximation [26] with the leading-order gluon density taken from
ref. [76]. The transverse momentum and rapidity distributions of Υ(1S) mesons also agree
well with SPS predictions based on kT -factorization, while the shape of the transverse
momentum spectra of Υ mesons disfavours the SPS predictions obtained using the collinear approximation. The shapes of the y Υ distribution have very limited sensitivity to
the underlying production mechanism.
The distribution |∆φ| is presented in figure 9(a,b). The DPS mechanism predicts a flat
distribution in ∆φ, while for SPS a prominent enhancement at |∆φ| ∼ π is expected in
collinear approximation. The enhancement is partly reduced taking into account transverse
momenta of collinding partons [33, 77] and it is expected to be further smeared out at
– 15 –
JHEP07(2016)052
2.5
LHCb
Υ(1S)D+
0.4
0.3
0
2
b)
0.5
1 dσ
σ dy Υ
1 dσ
σ dy Υ
0.5
1
0.5
0.6
1
0.5
0.6
a)
1 dσ
σ d|∆φ|
0.4
π
0.2
0.45
LHCb
Υ(1S)D0
1
0.35
0.3
0.5
0.4
0.15
0.3
0.1
0.2
0.05
0.1
0.6
0.8
0
0
1
0.2
0.25
1
0.5
LHCb
Υ(1S)D0
1 dσ
σ d∆y
1
0.5
1 dσ
σ d∆y
c)
0.3
0.4
0.35
0.15
0.15
0.1
0.1
0.05
0.05
0
0
−1
0
1
−0.05
2
∆y
LHCb
Υ(1S)D+
0.25
0.2
−2
d)
0.3
0.2
−0.05
1
|∆φ| /π
0.4
0.35
0.8
0.4
|∆φ| /π
−2
−1
0
1
2
∆y
Figure 9. Background-subtracted and efficiency-corrected distributions for |∆φ| /π (top) and
∆y (bottom) for Υ(1S)D0 (left) and Υ(1S)D+ (right) events. Straight lines in the |∆φ| /π plots show
the result of the fit with a constant function. The SPS predictions [75] for the shapes of ∆φ distribution are shown with dashed (orange) and long-dashed (magenta) curves for calculations based
on the kT -factorization and the collinear approximation, respectively. The solid (blue) curves in
the ∆y plots show the spectra obtained using a simplified simulation based on data from refs. [41, 44].
The dashed (green) lines show the triangle function expected for totally uncorrelated production of
two particles, uniformly distributed in rapidity. All distributions are normalized to unity.
next-to-leading order. The measured distributions for Υ(1S)D0 and Υ(1S)D+ events, shown
in figure 9(a,b) agree with a flat distribution. The fit result with a constant function
gives a p-value of 6% (12%) for the Υ(1S)D0 (Υ(1S)D+ ) case, indicating that the SPS
contribution to the data is small. The shape of ∆y distribution is defined primarily by
the acceptance of LHCb experiment 2 < y < 4.5 and has no sensitivity to the underlying
production mechanism, in the limit of current statistics.
6
Systematic uncertainties
The systematic uncertainties related to the measurement of the production cross-section
for ΥC pairs are summarized in table 3 and discussed in detail in the following.
– 16 –
JHEP07(2016)052
0.4
0.6
0.7
0.2
0.2
LHCb
Υ(1S)D+
0.6
0.25
0
0
b)
0.9
0.8
1 dσ
σ d|∆φ|
π
0.1
0.5
a)
0.2
1
1 GeV/c
0.25
LHCb
Υ(1S)D0
0.15
1 dσ
σ d pT
1 dσ
σ d pT
1
1 GeV/c
0.25
0.1
0.05
0.1
10
15
20
Υ(1S)D0
pT
[GeV/c]
0
5
10
15
20
Υ(1S)D+
pT
[GeV/c]
0.35
c)
LHCb
Υ(1S)D0
0.35
0.25
0.2
0.15
0.15
0.1
0.1
0.05
0.05
3
y
3.5
Υ(1S)D0
4
0
2
4.5
LHCb
Υ(1S)D+
0.25
0.2
2.5
d)
0.3
1 dσ
σ dy
0.3
1
0.25
0.4
2.5
3
3.5
y Υ(1S)D
4
4.5
+
Υ(1S)C
Figure 10. Background-subtracted and efficiency-corrected pT
(top) and y Υ(1S)C (bottom) dis0
+
tributions for Υ(1S)D (left) and Υ(1S)D (right) events. The blue curves show the spectra obtained
using a simplified simulation based on data from refs. [41, 44]. All distributions are normalized
to unity.
The signal shapes and parameters are taken from fits to large low-background inclusive Υ → µ+ µ− and charm samples. The parameters, signal peak positions and resolutions
and the tail parameters for the double-sided Crystal Ball and the modified Novosibirsk
functions, are varied within their uncertainties as determined from the calibration samples.
√
The small difference in parameters between the data sets obtained at s = 7 and 8 TeV is
also used to assign the systematic uncertainty. For D0 and D+ signal peaks alternative fit
models have been used, namely a double-sided asymmetric variant of an Apolonious function [78] without power-law tail, a double-sided Crystal Ball function and an asymmetric
Student-t shape. The systematic uncertainty related to the parameterization of the combinatorial background is determined by varying the order of the polynomial function in
eq. (4.1) between zeroth and second order. For the purely combinatorial background component (last line in eq. (4.2)), a non-factorizable function is used
n
k
F BB (mµ+ µ− , mC ) ∝ e−β1 mµ+ µ− 2 mC ì
2ij Pni mà+ à Pkj (mC ) ,
i=0 j=0
– 17 –
(6.1)
JHEP07(2016)052
5
0.4
1
0.25
0.15
0
0
1 dσ
σ dy
LHCb
Υ(1S)D+
0.05
0
0
2
b)
0.2
a)
LHCb
Υ(1S)D0
0.2
1 dσ
σ dAT
1 dσ
σ dAT
0.2
1
0.1
0.25
1
0.1
0.25
0.15
0.1
0.05
0.05
0
0
0
0.5
1
−1
AT
c)
0.4
LHCb
Υ(1S)D0
0.5
1
d)
0.4
LHCb
Υ(1S)D+
0.3
1 dσ
σ dm
1 dσ
σ dm
0.3
0.2
0.1
0.2
0.1
0
10
0
AT
0.5
1
1 GeV/c2
1
1 GeV/c2
0.5
−0.5
0
15
20
25
0
mΥ(1S)D
30
10
GeV/c2
15
20
25
+
Υ(1S)D
m
30
2
GeV/c
Figure 11. Background-subtracted and efficiency-corrected AT (top) and mΥ(1S)C (bottom) distributions for Υ(1S)D0 (left) and Υ(1S)D+ (right) events. The blue curves show the spectra obtained
using a simplified simulation based on data from refs. [41, 44]. All distributions are normalized
to unity.
where the parameters β1 , β2 and κi,j are allowed to float in the fit, and Pni and Pkj are
basic Bernstein polynomials, and the order of these polynomials, n and k, is varied between
zero and two. The corresponding variations of ΥC signal yields are taken as the systematic
uncertainty related to the description of the signal and background components.
Other systematic uncertainties are related to the imperfection of the Photos generator [52] to describe the radiative tails in Υ → µ+ µ− decays. This systematic is studied in
ref. [79] and taken to be 1%.
The systematic uncertainty related to efficiency correction is estimated using an alΥC , where the efficiency-corrected yields are
ternative technique for the determination of Ncorr
obtained via
wi
ΥC
Ncorr
=
,
(6.2)
εtot
i
where wi is the signal event weight, obtained with the sPlot technique [66] using fits
to the efficiency-uncorrected data sets, and εtot is a total efficiency for the given event,
defined with eq. (4.7). The difference in the efficiency-corrected yields with respect to
– 18 –
JHEP07(2016)052
−0.5
LHCb
Υ(1S)D+
0.15
0.1
−1
b)
σΥD
Source
σΥD
+
0.1 ⊕ 0.3
0.4
1.0
0.1
0.1 ⊕ 0.5
0.7
1.0
1.3
0.2
0.5
0.2
0.4 ⊕ 4 × 0.4
2 × 1.4
2.0
1.0
1.3
0.2
0.8
0.2
0.5 ⊕ 5 × 0.4
3 × 1.4
2.0
1.0
2.1
4.3
5.9
Total
Table 3. Summary of relative systematic uncertainties for σΥC (in %). The total systematic
uncertainty does not include the systematic uncertainty related to the knowledge of integrated
luminosity [67]. The symbol ⊕ denotes the sum in quadrature.
the baseline approach of 0.1 (1.3)% for ΥD0 (ΥD+ ), is assigned as the corresponding systematic uncertainty.
The systematic uncertainty related to the particle identification is estimated to be 0.2%
for muons and 0.5 (0.8)% for hadrons for the Υ(1S)D0 (Υ(1S)D+ ) case and is obtained from
the uncertainties for the single particle identification efficiencies using an error propagation
technique with a large number of pseudoexperiments. The same approach is used to propagate the uncertainties in εacc , εrec and εtrg related to the limited simulation sample size.
The efficiency is corrected using data-driven techniques to account for small differences in the tracking efficiency between data and simulation [57, 58]. The uncertainty in
the correction factor is propagated to the cross-section measurement using pseudoexperiments resulting in a global 0.4 (0.5)% systematic uncertainty for the ΥD 0 (ΥD+ ) cases plus
an additional uncertainty of 0.4% per track. The knowledge of the hadronic interaction
length of the detector results in an uncertainty of 1.4% per final-state hadron [57].
The systematic uncertainty associated with the trigger requirements is assessed by
studying the performance of the dimuon trigger for Υ(1S) events selected using the single
muon high-pT trigger [48] in data and simulation. The comparison is performed in bins of
the Υ(1S) meson transverse momentum and rapidity and the largest observed difference of
2.0% is assigned as the systematic uncertainty associated with the imperfection of trigger
simulation [44].
Using large samples of low-background inclusive Υ → µ+ µ− , D0 → K− π+ and
D+ → K− π+ π+ events, good agreement between data and simulation is observed for the se-
– 19 –
JHEP07(2016)052
Signal ΥC extraction
Υ and C signal shapes
2D fit model
Υ radiative tail
Efficiency corrections
Efficiency calculation
muon identification
hadron identification
simulated samples size
tracking
hadronic interactions
trigger
data-simulation agreement
BC
0
σΥbb
= (2–5)% ,
σΥcc
(6.3)
obtained using the kT -factorization approach with the transverse momentum dependent
gluon density taken from refs. [35–37]. The uncertainty reflects the variation of scale and
the difference with results obtained using the collinear approximation with the gluon density
from ref. [76]. Combining the estimates from eqs. (6.3), (1.1) and (1.2) with the probability
for a charm hadron from the decay of beauty hadron to pass the selection criteria, this feed
down is found to be totally negligible.
The effect of possible extreme polarization scenarios for Υ mesons from SPS processes
is proportional to the SPS contamination, αSPS , and could lead to +0.08 (−0.16)αSPS correction [71] to the cross-sections σΥC and the ratios RΥC for totally transverse (longitudinal)
polarizations of Υ mesons in centre-of-mass helicity frame. It is very small for small
0
+
SPS contamination. The corresponding corrections to ratios RD /D are non-zero only
if SPS has different contributions to ΥD0 and ΥD+ production processes and accouts for
+0.08 (−0.16)∆αSPS , where ∆αSPS is the difference in SPS contaminations to the considered processes. The same estimate is valid also for the ratios RΥ(1S)/Υ(2S) .
A large part of the systematic uncertainties cancels in the ratio RΥC and in the vari0
+
able σeff . The systematic uncertainties for σeff , RΥC and RD /D are summarized in tables 4
√
and 5. For the production cross-section of charm mesons at s = 8 TeV the measured
√
cross-section at s = 7 TeV is extrapolated using FONLL calculations [68–70]. The uncertainty related to the imperfection of the extrapolation is estimated from the comparison of
the measured ratio σC√s=13 TeV /σC√s=7 TeV [41, 84] and the corresponding FONLL estimate.
As a result of this comparison the C hadron production cross-section is scaled up by 2.7%
– 20 –
JHEP07(2016)052
lection variables used in this analysis, in particular for dimuon and charm vertex quality
and χ2fit (Υ)/ndf. The small differences seen would affect the efficiencies by less than 1.0%,
which is conservatively taken as a systematic uncertainty accounting for the disagreement
between data and simulation.
The systematic uncertainty related to the uncertainties of the branching fractions of
0
D and D+ mesons is 1.3% and 2.1% [45]. The integrated luminosity is measured using
a beam-gas imaging method [80, 81]. The absolute luminosity scale is determined with
√
1.7 (1.2)% uncertainty for the sample collected at s = 7 (8) TeV, dominated by the vertex
resolution for beam-gas interactions, the spread of the measurements and the detector
alignment [67, 81, 82].
The selection criteria favour the selection of charm hadrons produced promptly at
the pp collision vertex and significantly suppress the feed down from charm hadrons produced in decays of beauty hadrons. The remaining feed down is estimated separately for
DPS and SPS processes with the simultaneous production of an Υ meson and a bb-pair.
The former is estimated using simulation, normalized to the measured bb and cc production cross-sections [41, 83] and validated using a data-driven technique. It is found
to be smaller than 1.5% of the observed signal and is neglected. The contribution from
SPS processes with the associated production of Υ meson and bb pairs is estimated using
the prediction for the ratio of production cross-sections,
Source
σeff |ΥD+
0.1 ⊕ 0.3
0.4
0.1
0.1 ⊕ 0.5
0.7
1.3
0.5
0.2
6.7
2.1
0.8
0.2
9.7
2.1
6.7
7.0
9.9
10.1
Table 4. Summary of relative systematic uncertainties for σeff (in %). The reduced uncertainty
for C hadron production cross-section, denoted as δ(σC ), is recalculated from ref. [41] taking into
account the cancellation of correlated systematic uncertainties.
Source
Signal extraction
Υ and C signal shapes
2D fit model
Efficiency corrections
Efficiency calculation:
hadron identification
tracking
hadronic interactions
data-simulation agreement
simulated samples size
BC
Total
RΥD
0
RΥD
+
RD
0 /D+
0.1 ⊕ 0.3
0.4
0.1
0.1 ⊕ 0.5
0.7
1.3
0.3 ⊕ 0.5
0.4 ⊕ 0.7
0.1 ⊕ 1.3
0.5
0.4 ⊕ 4 × 0.4
2 × 1.4
1.0
0.2
1.3
0.8
0.5 ⊕ 5 × 0.4
3 × 1.4
1.0
0.2
2.1
0.5 ⊕ 0.8
0.6 ⊕ 1 × 0.4
1 × 1.4
1.0 ⊕ 1.0
0.2 ⊕ 0.2
1.3 ⊕ 2.1
3.4
5.3
3.8
Table 5. Summary of relative systematic uncertainties for the ratios RΥC and RD
0
/D+
(in %).
and a systematic uncertainty of 2.1% is assigned. The systematic uncertainty for the ratios
Υ(2S)/Υ(1S)
RC
is small compared to the statistical uncertainty and is neglected.
7
Results and discussion
The associated production of Υ and charm mesons is studied. Pair production of Υ(1S)D 0 ,
Υ(2S)D0 , Υ(1S)D+ , Υ(2S)D+ and Υ(1S)D+
s states is observed with significances exceeding
five standard deviations. The production cross-sections in the fiducial region 2.0 < y Υ < 4.5,
– 21 –
JHEP07(2016)052
Signal ΥC extraction
Υ and C signal shapes
2D fit model
Efficiency corrections
Efficiency calculation
hadron identification
simulated samples size
δ(σC )
√
FONLL extrapolation ( s = 8 TeV only)
√
s = 7 TeV
√
Total
s = 8 TeV
σeff |ΥD0
C
C
0
pΥ
T < 15 GeV/c, 2.0 < y√ < 4.5 and 1 < pT < 20 GeV/c are measured for Υ(1S)D and
Υ(1S)D+ final states at s = 7 and 8 TeV as:
(1S)D0
Bà+ à ì s=7 TeV = 155 21 (stat) 7 (syst) pb ,
(1S)D+
Bà+ à ì s=7 TeV = 82 ± 19 (stat) ± 5 (syst) pb ,
Υ(1S)D0
Bµ+ µ− × σ√s=8 TeV = 250 ± 28 (stat) ± 11 (syst) pb ,
(1S)D+
Bà+ à ì s=8 TeV = 80 16 (stat) ± 5 (syst) pb ,
Υ(1S)D0
D0 /D+
R√s=7 TeV =
σ√s=7 TeV
Υ(1S)D+
= 1.9 ± 0.5 (stat) ± 0.1 (syst) ,
σ√s=7 TeV
Υ(1S)D0
D0 /D+
R√s=8 TeV =
σ√s=8 TeV
Υ(1S)D+
= 3.1 ± 0.7 (stat) ± 0.1 (syst) ,
σ√s=8 TeV
where the systematic uncertainty is discussed in detail in section 6. The results are compatible with the DPS expectation of 2.41 ± 0.18 from eq. (1.6a).
The cross-section ratios RΥC are measured to be
Υ(1S)D0
R√s=7 TeV
σΥ(1S)D
=
σΥ(1S)
Υ(1S)D+
R√s=7 TeV =
Υ(1S)D0
R√s=8 TeV =
Υ(1S)D+
R√s=8 TeV =
σΥ(1S)D
σΥ(1S)
0
= (6.3 ± 0.8 (stat) ± 0.2 (syst)) % ,
√
s=7 TeV
+
= (3.4 ± 0.8 (stat) ± 0.2 (syst)) % ,
√
s=7 TeV
0
σΥ(1S)D
σΥ(1S)
= (7.8 ± 0.9 (stat) ± 0.3 (syst)) % ,
√
s=8 TeV
+
σΥ(1S)D
σΥ(1S)
= (2.5 ± 0.5 (stat) ± 0.1 (syst)) % .
√
s=8 TeV
Extrapolating the ratios RΥC down to pCT = 0 using the measured transverse momentum
spectra of D0 and D+ mesons from ref. [41], and using the fragmentation fractions
f (c → D0 ) = 0.565 ± 0.032 and f (c → D+ ) = 0.246 ± 0.020, measured at e+ e− colliders
– 22 –
JHEP07(2016)052
where the first uncertainty is statistical, and the second is the systematic uncertainty
from table 3, combined with the uncertainty related to the knowledge of the luminosity.
All these measurements are statistically limited. The measured cross-sections are in agreement with the DPS expectations from eq. (1.5), and significantly exceed the expectations
from the SPS mechanism in eqs. (1.1) and (1.2). Differential kinematic distributions are
studied for ΥD0 and ΥD+ final states. All of them are in good agreement with DPS expectations as the main production mechanism.
The ratios of the cross-sections for Υ(1S)D0 and Υ(1S)D+ are
operating at a centre-of-mass energy close to the Υ(4S) resonance [85], the ratios RΥcc
are calculated to be
Υ(1S)cc
R√s=7 TeV =
Υ(1S)cc
R√s=8 TeV =
σΥ(1S)cc
σΥ(1S)
√
σΥ(1S)cc
σΥ(1S)
√
= (7.7 ± 1.0) % ,
s=7 TeV
= (8.0 ± 0.9) % ,
s=8 TeV
Υ(2S)D0
Υ(2S)/Υ(1S)
R D0
= B2/1 ×
σ√s=7 TeV
Υ(1S)D0
= (13 ± 5)% ,
σ√s=7 TeV
Υ(2S)D0
Υ(2S)/Υ(1S)
R D0
= B2/1 ×
σ√s=8 TeV
Υ(1S)D0
= (20 ± 4)% ,
σ√s=8 TeV
where B2/1 is the ratio of dimuon branching fractions of Υ(2S) and Υ(1S) mesons and
where the systematic uncertainties are negligible compared to statistical uncertainties.
These values are smaller than, but compatible with the DPS expectations from eq. (1.6b).
For the ΥD+ production one obtains
Υ(2S)D+
Υ(2S)/Υ(1S)
R D+
= B2/1 ×
σ√s=7 TeV
Υ(1S)D+
= (22 ± 7)% ,
σ√s=7 TeV
Υ(2S)D+
Υ(2S)/Υ(1S)
R D+
= B2/1 ×
σ√s=8 TeV
Υ(1S)D+
= (22 ± 6)% ,
σ√s=8 TeV
where again the systematic uncertainties are negligible with respect to the statistical ones
and are ignored. These values are compatible with the DPS expectation of 25% from
eq. (1.6b).
Neglecting the contributions from SPS mechanism, the effective cross-section σeff is
√
determined using eq. (4.4a) for the s = 7 TeV data as
σeff |Υ(1S)D0 = 19.4 ± 2.6 (stat) ± 1.3 (syst) mb ,
σeff |Υ(1S)D+ = 15.2 ± 3.6 (stat) ± 1.5 (syst) mb .
The central values of σeff increase by up to 10% if SPS contribution exceeds by a factor of
two the central value from eq. (1.1). Both values are consistent with previous measurements
of σeff [11, 15, 43, 86–91], and their average is
σeff |Υ(1S)D0,+ ,√s=7 TeV = 18.0 ± 2.1 (stat) ± 1.2 (syst) = 18.0 ± 2.4 mb .
– 23 –
JHEP07(2016)052
which significantly exceed SPS expectations from eqs. (1.1) and (1.2).
The large statistical uncertainty for the other ΥC modes does not allow to obtain a numerical model-independent measurement, but, assuming similar kinematics for Υ(2S) and
charm mesons to the prompt production, the following ratios are measured
√
For the s = 8 TeV data the effective cross-section σeff is estimated using the meas√
ured Υ(1S) cross-section at s = 8 TeV [44] combined with σC , extrapolated from
√
√
s = 7 TeV [41] to s = 8 TeV using FONLL calculations [68–70]. The obtained effective DPS cross-sections are:
σeff |Υ(1S)D0 = 17.2 ± 1.9 (stat) ± 1.2 (syst) mb ,
σeff |Υ(1S)D+ = 22.3 ± 4.4 (stat) ± 2.2 (syst) mb .
The mean value of
σeff |Υ(1S)D0,+ = 18.0 ± 1.3 (stat) ± 1.2 (syst) = 18.0 ± 1.8 mb .
The large value of the cross-section for the associated production of Υ and open charm
hadrons, compatible with the DPS estimate of eq. (1.4), has important consequences for
the interpretation of heavy-flavor production measurements, especially inclusive measurements and possibly for b-flavor tagging [92–95], where the production of uncorrelated charm hadrons could affect the right assignment of the initial flavour of the studied
beauty hadron.
8
Summary
The associated production of Υ mesons with open charm hadrons is observed in pp collisions
at centre-of-mass energies of 7 and 8 TeV using data samples corresponding to integrated
luminosities of 1 fb−1 and 2 fb−1 respectively, collected with the LHCb detector. The production of Υ(1S)D0 , Υ(2S)D0 , Υ(1S)D+ , Υ(2S)D+ and Υ(1S)D+
s pairs is observed with
significances larger than 5 standard deviations. The production cross-sections in the fiduC
C
cial region 2.0 < y Υ < 4.5, pΥ
T < 15 GeV/c, 2.0 <√y < 4.5 and 1 < pT < 20 GeV/c are
0
+
measured for Υ(1S)D and Υ(1S)D final states at s = 7 and 8 TeV. The measured crosssections are in agreement with DPS expectations and significantly exceed the expectations
from the SPS mechanism. The differential kinematic distributions for ΥD 0 and ΥD+ are
studied and all are found to be in good agreement with the DPS expectations as the main
production mechanism. The measured effective cross-section σeff is in agreement with most
previous measurements.
Acknowledgments
We thank J.R. Gaunt, P. Gunnellini, M. Diehl, A.K. Likhoded, A.V. Luchinsky, R. Maciula,
S. Poslavsky and A. Szczurek for interesting and stimulating discussions on the SPS and
DPS mechanisms. We are greatly indebted to S.P. Baranov for providing us with predictions eqs. (1.2) and (6.3) and the differential kinematic distributions for Υ + cc SPS process. We express our gratitude to our colleagues in the CERN accelerator departments for
– 24 –
JHEP07(2016)052
σeff |Υ(1S)D0,+ ,√s=8 TeV = 17.9 ± 1.8 (stat) ± 1.2 (syst) = 17.9 ± 2.1 mb ,
(7.1)
√
is in good agreement with those obtained for s = 7 TeV data. Averaging these values,
σeff is found to be