DSpace at VNU: Quartz crystal microbalance (QCM) as biosensor for the detecting of Escherichia coli O157:H7
Bạn đang xem bản rút gọn của tài liệu. Xem và tải ngay bản đầy đủ của tài liệu tại đây (1.73 MB, 9 trang )
Home
Search
Collections
Journals
About
Contact us
My IOPscience
Quartz crystal microbalance (QCM) as biosensor for the detecting of Escherichia coli
O157:H7
This content has been downloaded from IOPscience. Please scroll down to see the full text.
2014 Adv. Nat. Sci: Nanosci. Nanotechnol. 5 045004
( />View the table of contents for this issue, or go to the journal homepage for more
Download details:
IP Address: 198.91.36.79
This content was downloaded on 21/02/2015 at 09:46
Please note that terms and conditions apply.
|
Vietnam Academy of Science and Technology
Advances in Natural Sciences: Nanoscience and Nanotechnology
Adv. Nat. Sci.: Nanosci. Nanotechnol. 5 (2014) 045004 (8pp)
doi:10.1088/2043-6262/5/4/045004
Quartz crystal microbalance (QCM) as
biosensor for the detecting of Escherichia
coli O157:H7
Vo Ke Thanh Ngo1,3, Dang Giang Nguyen2, Hoang Phuong Uyen Nguyen2,
Van Man Tran4, Thi Khoa My Nguyen4, Trong Phat Huynh2,
Quang Vinh Lam3, Thanh Dat Huynh5 and Thi Ngoc Lien Truong6
1
Integrated Circuit Design Research and Education Center (ICDREC), Vietnam National University, in Ho
Chi Minh City ( VNUHCM), Community 6, Linh Trung Ward, Thu Duc District, Ho Chi Minh City,
Vietnam
2
Research and Development Center in Saigon Hi-Tech Park, Lot I3, N2 Street, Saigon Hi-Tech Park,
District 9, Ho Chi Minh City, Vietnam
3
Faculty of Physics, University of Science, Vietnam National University in Ho Chi Minh City, 227 Nguyen
Van Cu Street, District 5, Ho Chi Minh City, Vietnam
4
Faculty of Chemistry, VNUHCM University of Science, Vietnam National University, in Ho Chi Minh
City, 227 Nguyen Van Cu Street, District 5, Ho Chi Minh City, Vietnam
5
Vietnam National University, Ho Chi Minh City, Community 6, Linh Trung Ward, Thu Duc District, Ho
Chi Minh City, Vietnam
6
School of Engineering Physics, Hanoi University of Science and Technology, 1 Dai Co Viet Road, Hanoi,
Vietnam
E-mail: and
Received 19 August 2014
Accepted for publication 6 September 2014
Published 14 October 2014
Abstract
Although Escherichia coli (E. coli) is a commensalism organism in the intestine of humans and
warm-blooded animals, it can be toxic at higher density and causes diseases, especially the
highly toxic E. coli O157:H7. In this paper a quartz crystal microbalance (QCM) biosensor was
developed for the detection of E. coli O157:H7 bacteria. The anti-E. coli O157:H7 antibodies
were immobilized on a self-assembly monolayer (SAM) modified 5 MHz AT-cut quartz crystal
resonator. The SAMs were activated with 16-mercaptopropanoic acid, in the presence of 1-ethyl3-(3-dimethylaminopropyl) carbodiimide (EDC) and ester N-hydroxysuccinimide (NHS). The
result of changing frequency due to the adsorption of E. coli O157:H7 was measured by the
QCM biosensor system designed and fabricated by ICDREC-VNUHCM. This system gave good
results in the range of 102–107 CFU mL−1 E. coli O157:H7. The time of bacteria E. coli O157:H7
detection in the sample was about 50 m. Besides, QCM biosensor from SAM method was
comparable to protein A method-based piezoelectric immunosensor in terms of the amount of
immobilized antibodies and detection sensitivity.
Keywords: E. coli O157:H7, quartz crystal microbalance, self assembled monolayer,
piezoelectric sensor, immunosensor
Classification numbers: 2.04, 6.09
1. Introduction
microorganism in the enteric bacteria. This bacterium causes
serious illnesses such as bloody diarrhea, bloody feces, anemia and kidney failure [1, 2]. It has been estimated that E. coli
O157:H7 causes up to eight million deaths worldwide every
year from diarrheal diseases [3]. Hence, an establishment of
Escherichia coli O157:H7 (E. coli O157:H7), as one of the
most dangerous foodborne pathogens in food industry, is a
gram-negative non-spore forming rod and a representative
2043-6262/14/045004+08$33.00
1
© 2014 Vietnam Academy of Science & Technology
Adv. Nat. Sci.: Nanosci. Nanotechnol. 5 (2014) 045004
V K Thanh Ngo et al
rapid and sensitive methods for E. coli O157:H7 dectection is
strongly needed to control this pathogenic bacterium in water
supplies or food.
Traditional methods for testing of E. coli O157:H7
include plating and culturing, enumeration methods and
biochemical testing [4]. Although the detection limits for
these methods are very low (about a few colony forming units
(CFU)/ml), the testing time is time-consuming (from 1 day to
1 week) [5, 6]. Besides, some new techniques for rapid
detection of this bacteria have been developed including
immunoassays [7], polymerase chain reaction (PCR) [8],
DNA microarrays [9], and immunomagnetic separations [10].
It has been shown that sensitivity and selectivity of these
methods are good and detection time for these methods is
from about 2 h to 24 h [11]. However, these methods have a
disadvantage in that they are expensive or complicated due to
the use of laboratories equipped with specific instruments and
chromospheres. Therefore, they are not suitable for rapid test
of E. coli O157:H7 bacteria.
In recent years, quartz crystal microbalance (QCM) based
biosensor has been a new technology for the rapid detection
of pathogens and toxins because of its simplicity in concept,
ease of use, low cost, online monitoring, shorter analysis time
and suitability for label-free measurement [12]. A QCM
biosensor includes an AT-cut quartz crystal wafer sandwiched
between two metal electrodes. An applied oscillating electric
field induces an acoustic wave. The resonant frequency of
QCM is dependent on the mass change at the crystal surface.
The relationship between the frequency change and mass
loading is shown by the Sauerbrey equation [13]
Δf = −
2Δm f02
A μq ρq
,
improving detection sensitivity, speed, and reproducibility.
Aiming at the gold electrode substrate of QCM (8 MHz ATcut quartz crystals with diameter about 13.7 mm) for detecting
E. coli O157:H7, the way to form an SAM with 16-mercaptopropanoic acid (MHDA), in the presence of 1-ethyl-3-(3dimethylaminopropyl) carbodiimide (EDC) and ester Nhydroxysuccinimide (NHS) was popularly reported in antibody immobilization, which provides for detecting E. coli
O157: H7 with a detection limit of 103–108 CFU ml−1 within
30–50 min [14].
In this work we developed a 5 MHz QCM sensor with
QCM system designed and fabricated from ICDREC as a
biosensor system based on immobilization of the antibodies
onto a MHDA-SAM onto gold surface with NHS ester as
reactive intermediate for the rapid detection E. Coli O157:H7
bacteria as shown by Xiao-Li Su [20]. The immobilization
process was optimized to improve the performance of biosensor. The method is simple and fast. Besides, we have a
comparision between MHDA-SAM and protein A method for
considering the amount of immobilized antibodies and
detection sensitivity for testing E. coli O157H7.
2. Experimental
2.1. Materials and instrumental
Affinity purified antibodies E. coli O157:H7 were purchased
from Abcam Company, UK. Protein A-soluble, 16-mercaptohexadecanoic acid (MHDA), 1-ethyl-3- (3-dimethylaminopropyl) carbodimide (EDC), ester N-hydroxysuccinimide
(NHS), photphate PBS pH 7,4, bovine serum albumin (BSA)
were supplied from Sigma Aldrich (USA). And ethanol,
NaOH, acetone HCl, H2SO4 (98%), H2O2 were purchased
and were used without treatment from Merck Company
(Germany). All the reagents used were AR grade.
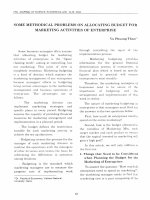
We applied a QCM system designed and fabricated by
ICDREC-VNUHCM (figure 1) for this study, controlled by a
laptop under Windows environment and connected with
5 MHz QCM devices provided by Stanford Research Systems
Company. In addition, FE-SEM-MX-51(OLYMPUS Company, Japan) and atomic force microscopy (AFM, Model
5500 AFM system, Agilent Company, USA) were employed
to analyze the surface of QCM biosensor.
(1)
where ρq is the quartz density, μq is crystal shear module, f0 is
crystal fundamental frequency of the piezoelectric quartz
crystal, A is crystal piezoelectrically active geometrical area
which is defined by the area of the deposited metallic film on
the crystal, Δm and Δf correspond to mass and system frequency changes. Based on the combination of QCM devices
with highly specific antigen–antibody, enzyme–substrate, and
receptors–ligand interaction, QCM biosensor can be used for
directly testing the bacteria. Following the Sauerbrey
equation, the frequency decrease is proportional to the mass
change, which connects to the bacterial concentration [14].
Hence, many researchers applied QCM based biosensor as the
transducer to the detection of hygienic important microorganisms as alternatives to the conventional method [15, 16].
Antibody E. coli O157:H7 immobilization on the surface
of gold electrode is an important work to catch bacteria E. coli
O157:H7. Until now, many immobilization methods for
development of QCM immunosensor in testing E. coli O157:
H7 are mainly based on polymer membrane [17], Langmuir–
Blodgett film [18], protein A [19] and self-assembled
monolayer (SAM) [20]. Among these methods, the SAM
method presents the simplest way to provide a reproducible,
ultrathin and well-ordered functional layer suitable for modification with antibodies, which was responsible for
2.2. Bacteria and culture plating method
E. coli O157:H7 as target bacterium was supplied by the
Pasteur Institute in Ho Chi Minh City, Vietnam. The bacterial
concentration was determined by the conventional surface
plating-count method. The culture was then heated in a
100 °C water bath for 15 m to kill all the bacteria, and diluted
to the desired concentrations with PBS for further use.
2
Adv. Nat. Sci.: Nanosci. Nanotechnol. 5 (2014) 045004
V K Thanh Ngo et al
performed in a solution of 5 mM potassium ferrocyanide of
50 mV s−1 for 10 scans. The impedance measurements were
carried out using an ace signal of 8 mV amplitude at a formal
potential of the redox couple using a wide frequency range of
10 mHz to 100 kHz.
2.3.3. Protein a method-based immunosensor.
The method
for fabricating QCM immunosensor by protein A as described
by Babacabm et al [19] is shown as follows: we added about
5 μl of 2.5 mg ml−1 protein A to the pretreated crystals, spread
over the entire Au electrodes and stored at 4 °C overnight.
The excess protein A was removed by rinsing with PBS.
Then, anti-E. coli O157:H7 antibodies with 10 μl of
1 mg ml−1 were added onto gold surface QCM sensor,
spread over the entire gold electrodes and kept at 4 °C
overnight. The excess antibodies were removed by PBS.
Finally, the sample was dried and stored at 4 °C.
Figure 1. 5 MHz QCM System for testing E. coli O157:H7 designed
by ICDREC.
2.4. Method for detection of E. coli O157:H7 bacteria by using
5 MHz QCM biosensor
2.3. Method for fabrication of quartz crystal microbalance
based immunosensor
The holder which had the antibodies-treated QCM sensor was
a fitted 5 MHz QCM system. Then, the sensor was added with
1 ml PBS solution, while the frequency shift caused by the
combination was collected until the curve reached a plateau.
During the E. coli O157:H7 detection process, 1 ml of 101–
107 colony forming units CFU ml−1 bacterial suspension was
added into the detection cell for 1 h.
2.3.1. Self-assembled monolayer (SAM) method-based
immunosensor [14]. The quartz crystal microbalance
(QCM) sensors were pretreated with 1 M NaOH for 20 min,
1 M HCl for 5 min in ultrasonic bath and pirannha etch
solution (H2O2:H2SO4 = 2:3) for 1 min, in sequence, to obtain
a clean and highly hydrophobic Au surface. After each
pretreatment the QCM sensors were rinsed with ethanol and
water successively and dried in a stream of nitrogen.
The pretreated QCM sensors were immersed in an
ethanol solution of 200 μl MHDA for 24 h to form a SAM
(with one side of the crystal exposed to the solution). After
rinsing with ethanol and water, the MHDA-modified crystals
were treated with 75 mM EDC and 15 mM NHS for 2 h to
convert the terminal carboxylic group to an active NHS ester.
After rinsing with water and drying, 100 μl of 0.1 mg ml antiE. coli O157:H7 antibodies were added onto one side of the
QCM sensor and spread over the entire Au electrode for 2 h at
37 °C. The excess antibodies were removed by rinsing with
PBS. This crystal was treated continuously with BSA–PBS
solution for 1 h to block the untreated and nonspecific sites.
After rinsing with PBS and water, the QCM sensors were
dried in nitrogen, and finally the sensors were fabricated.
3. Results and discussion
3.1. Characterization of SAM on QCM biosensor
In this work we applied SAM method for the protein linkage
interface and used MHDA, a long chain carboxylic acid terminating alkanethiol which was proved to be more stable than
other shorter chains [21]. Besides, MHDA in the function of
an oriented monolayer on gold surface of QCM sensor was
shaped through the strong Au–thiolate bond. In additon, the
co-addition of EDC and NHS will improve the stability of the
linker compounds by activating the MHDA monolayer and
will conjugate E. coli O157:H7 antibody by replacing the
active NHS esters through amide bonds [22]. As shown by
the Sauerbrey equation, the frequency shift will be deduced
from the mass change on the surface. We can calculate the
amounts of molecules of each layer on gold surface QCM
sensor according to the mass as described by equation [20]
2.3.2. Electrochemical characterization of the gold surface on
QCM with SAM. For electrochemical characterization, a
Δm = −
conventional three-electrode electrochemical cell was used. A
platinum foil of large surface area was used as counter
electrode and Ag/AgCl was used as a reference electrode with
SAM modified gold QCM electrode as a working electrode.
All the experiments were performed at room temperature.
Cyclic voltammetry (CV) and electrochemical impedance
spectroscopy (EIS), which were proceesed by Biologic MPG2
(Biologic Company, France) were used for the
electrochemical characterization of SAMs. CV was
A ΔF
2.26 × 10⁻⁶F 2
⋅
(2)
Besides, the amounts of molecules N can be calculated
by mass as shown by the following equation
N=
Δm
,
AMw
(3)
with molecular weight Mw and Avogadro’s constant A
(6.023 × 10²³ mol−1). Substituting expression (2) into
3
Adv. Nat. Sci.: Nanosci. Nanotechnol. 5 (2014) 045004
V K Thanh Ngo et al
Table 1. Changes of frequency shift and molecules numbers in each step (QCM system from ICDREC—VNUHCM).
Mw
ΔF (Hz)
Δm (ng)
mol
N
288.49
115.09
150000
322
97
205
1832.5
553
1166.6
6.4
4.8
0.0077
3.853 × 10¹⁵
2.889 × 10¹⁵
4.635 × 10¹²
Layer
MHDA
NHS
Antibody
equation (3) we obtain
N = − 2.664 × 1029
AΔF
.
Mw F 2
(4)
The result derived from equation (4) and presented in
table 1 showed that frequency shift of QCM crystal changes
after each treated step. Based on the observed frequency shift
the mass loaded onto the surface crystal was calculated. The
frequency shift of MHDA-treated crystals is 322 Hz,
equivalent to 3.853 × 10¹⁵ MHDA molecules attached onto
electrode, density was 11.983 × 10¹³ MHDA molecules/mm2,
i.e. about 57 ng MHDA mm2. The mass of MHDA attached
onto gold electrode is 3.6 times as many as in the study of
Wang’s group [20]. It is explained that the active area of the
Au electrode in two studies are different. Our study used a
device with the basic frequency of 5 MHz, while Wang and
Su [14, 20] used an 8 MHz device. Thus, after immersion in
solution of MHDA, density of this molecule is disposed
regularly and there were many attached molecules. This
means that the immersion time (24 h) was suitable. This result
was in agreement with the result recently reported in [14].
Figure 2 indicated that after the MHDA-NHS/EDC
treatment of the crystal for 2 h, the difference of its surface in
comparison with the gold surface of QCM sensor was almost
negligible. But the frequency shift of the MHDA-NHS/EDC
treated crystal was very low (97/322 ∼ 30.12%). It means that
NHS/EDC quantity was not more than that of attached
MHDA. For example, with the frequency shift of 97 Hz,
equivalent to 2.889 × 10¹⁵ NHS molecules attached onto
electrode, density was 8.987 × 10¹³ NHS molecules/mm2,
about 17.2 ng NHS mm−2, ratio NHS/MHDA of 75.5%
shown that the activating efficiency of NHS is about 75.5%,
namely almost 3 MHDA molecules could be activated by 2
NHS molecules (in table 1). Besides, the frequency shift of
the immobilized antibodies crystal was about 205 Hz,
equivalent to 4.636 × 10¹² antibodies anchored. It means that
800 MHDA molecules could be immobilized by 1 antibody.
Density of antibody was 1.442 × 10¹¹ antibodies/mm2, and
hence about 36.3 ng mm−2. Antibody attachment is lower
than MHDA and NHS. NAntibodies/MHDA is 0.12%, as good
as the ratio in the study of Wang (0.14%). The result of this
experiment in QCM sytem designed and fabricated by
ICDREC is as good as the result of Wang [20].
Analyzing the low immobilization efficiency, there are
two possible reasons to be considered. First, the volume of
anti-E. coli O157:H7 antibody is more gigantic than that of
MHDA (about 520 times). Second, many active NHS esters
would be hydrolyzed by H+ ions in the reagent during the
course of immobilization reaction. It is important to adjust the
pH value of the antibody solution to the alkalescent level so
Figure 2. Frequency shift of the immunosensors fabrication: MHDA-
SAM, EDC/NHS, antibody immobilization.
Figure 3. Cyclic voltammetry of gold QCM electrode. (a) bare gold
QCM, (b) SAM of MHDA, (c) SAM of EDC/NHS, (d) SAM of
antibody.
the OH- ions could neutralize the H+ ions and inhibit the
hydrolization of active NHS ester [20].
Figure 3 shows the CV of bare gold QCM electrode and
SAMs coated gold QCM electrode in 5 mM potassium ferrocyanide at a potential scan rate of 50 mV s−1. It can be seen
from the figure that the bare gold electrode shows a typical
CV for the redox couple where the electron transfer reaction
is under controlled diffusion. In contrast, the monolayer of the
SAM layer modified gold electrode does show a weak peak in
the voltammogram since the redox reaction is significantly
blocked by the monolayer.
4
Adv. Nat. Sci.: Nanosci. Nanotechnol. 5 (2014) 045004
V K Thanh Ngo et al
3.2. Influence of PBS solution for testing in 5 MHz QCM sytem
We measure the frequency shift of QCM immersed in PBS
solution for 2 h. At first, there is oscillation because of action
on the electrode of PBS. After the establishment of stable
surface, the shift barely changes with time. Hence, the baseline in PBS was determined. Results of measurement with
PBS show that there was no frequency shift after the establishment of stability (<1 Hz) as antibodies do not capture any
antigen. There was no increase of mass on the surface
of QCM.
3.3. Investigation of specific antibody E. coli O157:H7 with
5 MHz sensor QCM
Figure 7 shows the result of the test of E. coli O124 suspension in 106 CFU ml−1 concentrations, when there was
strong frequency change during the first 1000 s. After the time
moment when measured system and suspension became
stable, the frequency shift reached the baseline (influence of
PBS solution), and the frequency did not change. This phenomena should be explained as specific antibodies have not
captured any antigen in the suspensions, the mass increase on
the SAM layer surface did not take place and there was not
any frequency shift. For two remaining control bacteria
(Salmonella typhimurium and Bacillus subtilize), results are
as good as for E. coli O124. It can be concluded that antibody
E. coli O157:H7 is specific.
Figure 4. Nyquist plots of the impedance measurement of gold QCM
electrode: ( ) bare gold QCM, ( ) SAM of MHDA, ( ) SAM of
EDC/NHS, ( ) SAM of antibody.
Figure 4 shows the impedance plots (Nyquist plots) of
the monolayer of SAMs on gold QCM surface in potassium
ferrocyanide. The EIS was carried out at a formal potential of
[Fe(CN)6]3−/4− redox couple. It can be seen from the figure
that the bare gold electrode shows a very small semicircle at
high frequency region, and a straight line at low frequency
region indicates that the electron transfer process of the redox
couple is under controlled diffusion. On the other hand, the
SAM modified electrode shows the formation of semicircle in
the entire range of frequency used for the study, implying a
good blocking behavior and complete charge transfer control
for the electron transfer process. A very large semicircle
obtained in the case of SAM of antibody on gold QCM
surface compared to other SAM indicates a high charge
transfer resistance and hence an excellent electrochemical
blocking ability of the SAM.
Atomic force microscopy (AFM) allows characterizing
the organic thin films at a molecular resolution. The surface of
the waveguide was then examined by AFM. The topography
image on an area of 3 μm, and an example of a roughness
profile, are shown in figure 5. A set of several lines drawn in
different places of the waveguide and the profile curves show
that the surface has an average surface roughness (Rms) of
2.12 nm. The topography image of the sensor surface with a
monolayer after binding of MHDA is also presented in
figure 5. Examination of the curves of profile at different
locations shows that the Rms is of the same order of magnitude as that of the initial surface, about 5 nm. AFM confirms
that the most uniform layer is obtained for a binding time of
about 24 h in determined experimental conditions. Thus, for
periods of the binding of 24 h, the Rms is 1.79 nm. This result
suggests that the molecules of MHDA bind uniformly on the
roughened surface, as well as in the recesses on the bumps,
and there was little aggregate.
The results shown by FE-SEM (figure 6), AFM images,
electrochemical characterization and frequency shift after
each treated step indicated that SAM and anchorage of anti-E.
coli O157:H7 antibodies have been successfully performed on
a QCM device.
3.4. Detection of E. coli O157:H7 by SAM method with 5 MHz
QCM sensor
Figure 8 shows that in the entire working range of 101–
107 CFU ml−1 of E. coli O157:H7, the higher the concentration, the greater the sensor responses. However, the cell
concentration was 101 CFU ml−1, the temporal response
curves could not distinguish from the baseline of negative
control (about 4.67 Hz). Because this concentration is very
low, bacteria numbers captured by specific antibodies are not
enough to make a remarkable frequency change.
Running a sample solution of 102 and 103 CFU ml−1 of
E. coli O157:H7, frequency shift was about 15 Hz and
34.67 Hz, respectively. This result allows QCM system
(figure 1) to be used for qualitative and quantitative analysis
of cell concentration in solution. Besides, testing a suspension
of 104–107 CFU ml−1 of E. coli O157:H7 for 2 h resulted in
frequency decreases which change, respectively, with each
other concentration. The higher the cell concentration, the
greater the frequency shifts. As more E. coli O157:H7 bacteria have been captured by specific antibodies, the more the
mass covered the surface of the Au electrode, and then the
more frequency shift of measurement decreased. It takes
50 min to determine frequency shift. This result was as good
as the result recently reported [20, 23, 24].
Frequency shift when running a sample solution from 102
to 107 CFU ml−1 of E. coli O157:H7 can be distinguished. It
means that QCM system, made in ICDREC-VNUHCM, acts
well with a detection range of 102–107 CFU ml−1. This also
5
Adv. Nat. Sci.: Nanosci. Nanotechnol. 5 (2014) 045004
V K Thanh Ngo et al
Figure 5. AFM of the gold surface QCM sensor. (a) Gold surface and (b) MHDA-NHS/EDC binding.
Figure 6. FE-SEM of the gold surface QCM sensor. (a) Gold surface, (b) MHDA-NHS/EDC binding.
Figure 8. Frequency shift of the immunosensor as a function of time
in E.coli O157:H7 suspension of different concentrations (CFU
ml−1) on the QCM system (designed by ICDREC).
Figure 7. Frequency shift of the immunosensor as a function of time
in E. coli O124 suspension (106 CFU ml−1).
6
Adv. Nat. Sci.: Nanosci. Nanotechnol. 5 (2014) 045004
V K Thanh Ngo et al
Table 2. Frequency shift of QCM devices when measured by MHDA and protein A methods.
Frequency shift (Hz)
Method
Time
10 (CFU−ml )
104 (CFU ml−1)
106 (CFU ml−1)
MHDA
1
2
3
Mean
1
2
3
Mean
12
16
15
14.33
9
6
6
7
43
47
42
44
29
25
27
27
67
70
72
69.67
39
30
30
33
Protein A
−1
2
proves that sensitivity of the QCM system is similar to few
other systems [14, 25].
3.5. Comparison of protein a method-based 5 MHz QCM
sensor with SAM method for detection of E. coli O157:H7
A protein A based immunosensor has been developed for
detection of E.coli O157:H7 [19]. The SAM-based immunosensor was compared with the protein A in QCM system
which was fabricated in ICDREC. As shown in table 2, when
testing a sample solution of E.coli O157:H7 in three different
concentrations, the frequency shift signals observed by
MHDA method are more obvious than that by protein A. It
would mean that the peptide binds between specific antibodies and NHS/EDC-MHDA SAM layer are better than
those between specific antibodies and protein A.
Figure 9 showed that frequency shift values at any concentration also have remarkable difference. Frequency shift
obtained from MHDA-SAM layer method is 2, 1.6 and 2.1
times (n = 3), respectively better than that from protein A
method at 102, 104 and 106 CFU ml−1. This problem
demonstrated that MHDA-SAM layer is more sensitive than
protein A method.
Moreover, there is a greater number of antibodies which
anchored onto NHS/EDC-MHDA SAM layer than onto
protein A. The frequency shift is 322 Hz with MHDA–SAM
layer and from 54 to 83 Hz with protein A when the antibodies were imobilized. Therefore, MHDA-SAM method
attached antibodies 4.7 times higher than the protein A
method.
Figure 9. Frequency shift of immunosensor versus time for bacterial
concentration by MHDA and protein A methods using QCM system
(designed by ICDREC).
system gave good results in the range of 102–107 CFU ml−1
E. coli O157:H7. Moreover, the results have proved the
specificity of the antibodies in the detection of E. coli O157:
H7. The time of bacteria E.coli O157:H7 detection in the
sample was about 50 m. Besides, SAM method for making a
piezoelectric immunosensor is better than protein A method.
Acknowledgements
This research was supported by Department of Science and
Technology Ho Chi Minh City. We thank APCLab, University of Science in VNUHCM for technical support.
4. Conclusions
In this study we succeeded in fabricating an MHDA-SAM
immunosensor on gold surface onto QCM sensor with a
system made in ICDREC-VNUHCM for rapid and sensitive
detection of E. coli O157:H7. The QCM system from
ICDREC was successfully applied for the stepwise characterization of the immunosensor and testing E.coli O157:H7.
Results showed that NHS ester improved the stability of the
linker compounds, and the frequency shifts obtained by
5 MHz QCM sensor were 327, 97, 205 Hz for layers of
MHDA, EDC/NHS, and antibody E. coli O157:H7. The
References
[1] Bunchnan R L and Dolye M P 1997 Food Technol. 51 69
[2] Griffin P M and Tauxe R V 1991 Epidemiol. Rev. 13 60
[3] Velusamy V, Arshak K, Korostynska O, Oliwa K and Adley C
2010 Biotechnol. Adv. 28 232
[4] Deisingh A K and Thompson M 2004 J. Appl. Microbiol.
96 419
[5] Adams M R and Moss M O 1995 Food Microbiology
(Cambridge: The Royal Society of Chemistry)
[6] Silk T M and Donnelly C W 1997 J. Food Protect. 60 1483
7
Adv. Nat. Sci.: Nanosci. Nanotechnol. 5 (2014) 045004
V K Thanh Ngo et al
[18] Pathirana S T, Barbaree J, Chin N A, Hartell M G,
Neely W C and Vodyanoy V 2000 Biosens. Bioelectron.
15 135
[19] Babacabm S., Pivarnik P, Letcher S and Rand A G 2000
Biosens. Bioelectron. 15 615
[20] Wang L, Wu C, Hu Z, Zhang Y and Wang R 2008 J. Zhejiang
Uni. Sci. B 9 121
[21] Mirsky V M, Riepl M and Wolfbeis O S 1997 Biosens.
Bioelectron. 12 977
[22] Fung Y S and Wong Y Y 2001 Anal. Chem. 73 5302
[23] Li F, Zhao Q, Wang C, Lu X, Li X F and Le X C 2010 Anal.
Chem. 82 3399
[24] Mao X, Yang L, Su X L and Li Y 2005 Biosens. Bioelectron.
21 1178
[25] Han H C, Chang Y R, Hsu W L and Chen C Y 2008 Biosens.
Bioelectron. 24 1543
[7] Magliulo M, Simoni P, Guardigli M, Michelini E, Luciani M,
Lelli R and Roda A 2007 J. Agr. Food Chem. 55 4933
[8] Kumar A, Grover S and Kumar Batish V 2013 J. Gen. Appl.
Microbiol. 59 11
[9] Donhauser S C, Niessner R and Seidel M 2011 Anal. Chem.
83 3153
[10] Wang L, Li Y and Mustaphai A 2007 J. Food Protect. 70 1366
[11] Keay R W and McNeil C J 1998 Biosens. Bioelectron. 13 963
[12] Serra P A 2011 Biosensors–Emerging Materials and
Applications ed Y Montagut (Rijeka: InTech) chapter 9
pp 154–78
[13] Sauerbrey G 1959 Z. Phys. 155 2333
[14] Su X L and Li Y 2004 Biosens. Bioelectron. 19 563
[15] Deisingh A K and Thompson M 2002 Analyst. 127 567
[16] Ivniski D, Abdel-Hamid I, Atanasov P and Wilkins E 1999
Biosens. Bioelectron. 14 599
[17] Nakanishi K, Muguruma H and Karube I 1996 Anal. Chem.
68 1695
8