DSpace at VNU: Supply chain quality management practices and performance: An empirical study
Bạn đang xem bản rút gọn của tài liệu. Xem và tải ngay bản đầy đủ của tài liệu tại đây (304.37 KB, 13 trang )
Oper Manag Res (2013) 6:19–31
DOI 10.1007/s12063-012-0074-x
Supply chain quality management practices and performance:
An empirical study
Jing Zeng & Chi Anh Phan & Yoshiki Matsui
Received: 11 May 2012 / Revised: 8 November 2012 / Accepted: 18 December 2012 / Published online: 13 January 2013
# Springer Science+Business Media New York 2013
Abstract This study proposed a conceptual framework to
study the relationships among three dimensions of supply
chain quality management (SCQM) – in-house quality management practices (internal QM), interaction for quality with
suppliers on the upstream side of supply chain (upstream QM),
and interaction for quality with customers on the downstream
side of supply chain (downstream QM) – and their impact on
two types of quality performance (conformance quality, and
customer satisfaction). Survey data were collected from 238
plants in three industries across eight countries and structural
equation modeling was used to test this framework. The results
indicate a dominant role of the internal QM in SCQM which
has a positive impact on the other SCQM dimensions and two
types of quality performance. Downstream QM is found to
mediate the relationship between internal QM and customer
satisfaction, while there is a lack of direct impact of upstream
QM on either type of quality performance.
Keywords Supply chain . Quality management . Quality
performance . Empirical study
J. Zeng (*)
International Graduate School of Social Sciences,
Yokohama National University,
Yokohama, Japan
e-mail:
C. A. Phan
Department: Faculty of Business Administration,
University of Economics and Business - Vietnam
National University, Hanoi,
Hanoi, Vietnam
e-mail:
Y. Matsui
Faculty of Business Administration,
Yokohama National University,
Yokohama, Japan
e-mail:
1 Introduction
As competition intensified and markets became global in the
1990s, supply chain management (SCM) began to take center
stage as a means to respond rapidly, correctly, and profitably to
market demands. This is a holistic approach advocating the
“philosophy by which firms can operate inter-organizationally
and merge both strategic initiatives and upstream and downstream processes in order to achieve business excellence”
(Robinson and Malhotra, 2005, p.316). The concept of SCM
has evolved from two separate paths: “purchasing and supply
management, and transportation and logistics management”
(Li et al., 2006, p.108), and quality management (QM) usually
is not considered as a significant dimension of SCM (Robinson
and Malhotra, 2005).
Since 1980s, QM has been widely adopted by many
organizations as an approach to achieve competitive advantage. However, research in QM has besen criticized for
focusing too much on the internal view of quality (Foster,
2008). The adoption of the system approach implicit in
SCM necessitates externalizing the view of quality improvement by focusing on customers and developing suppliers
(Foster and Ogden, 2008). Quality practices must advance
even further “from traditional firm centric and productbased mindsets to an inter-organizational supply chain orientation” (Robinson and Malhotra, 2005, p.315).
A merging of these two approaches can be seen within
recent research as “Supply Chain Quality Management”
(SCQM) (Kuei et al., 2001; Lin et al., 2005; Sila et al.,
2006). However, this merging is still far from complete and
“essential features that lead to achieving SCQM have not yet
been fully explored”. (Lin et al., 2005, p.356). The purpose
of this study is therefore to empirically examine the relationship among critical factors for SCQM and their impact
on quality performance. The practices of SCQM are proposed to be a multi-dimensional concept, including the
20
upstream, internal and downstream QM from a supply chain
perspective. In addition, two types of quality performance –
conformance quality, and customer satisfaction – are examined.
A conceptual framework is developed in this study to postulate
causal linkages between these SCQM dimensions and quality
performance. Data for this study were collected from 283 plants
in eight countries across three industries and the framework is
tested using structural equation modeling (SEM).
It is expected that addressing SCQM practices simultaneously from upstream, internal, and downstream aspects
will expand the understanding of the scope and the activities
in regards to SCQM and the interactions among the dimensions of SCQM. Further, the empirical evidence concerning
the impact of SCQM on quality performance would benefit
supply chain members by offering useful guidance for integrating quality initiatives into the supply chain.
The remainder of this paper is organized as follows. In
the next section, a review of relevant literature on SCQM is
presented. Based on the review of the literature, a research
model and related hypotheses are proposed in section three.
Section four describes the research methodology. Section
five presents the results of hypotheses testing carried out.
The main findings and implications stemming from this
research are discussed in section six. Section seven contains
limitations of this study and future research. Finally, the
conclusions are summarized in the last section.
2 Literature
The trend of integrating quality and supply chain management has been suggested by several researchers. Levy
(1998) refer to “total quality supply chain management” as
a paradigm shift in which supplier-customer relationships
and co-making quality products would emerge as the major
concern instead of the traditionally firm-centered concern
such as price, quality and delivery time. Ross (1998) points
out the three general trends leading to an increased emphasis
on supply chain quality: expansion of quality initiatives,
deregulation in the transportation sector, and expansion of
logistics activities. SCQM can be seen as “the latest stage in
the total quality movement”, and can be defined as “the
formal coordination and integration of business processes
involving all partner organizations in the supply channel to
measure, analyze and continually improve products, services,
and processes in order to create value and achieve satisfaction
of intermediate and final customers in the market place”
(Ross, 1998). Kuei et al. (2002) argue that SCQM should be
distinguished from supply chain technology management.
The former emphasizes the customer-driven culture, which
is the social base to facilitate the supply chain’s workflow,
while the latter addresses the development of the technical
base to facilitate the information sharing. SCQM is more and
J. Zeng et al.
more recognized as a significant dimension of the supply
chain. With a comprehensive literature review, Robinson and
Malhotra (2005) point out that SCQM has received scant
research attention. SCQM is an important emerging field that
needs to be further studied (Sila et al., 2006; Foster, 2008).
Much of the current research on SCQM focuses on only
the upstream side of the supply chain. Forker et al. (1997)
demonstrate that the proper implementation and coordination of quality management activities in the upstream side of
the supply chain improve supplier quality performance.
Their work is extended by Park et al. (2001), including the
supplier’s overall rating as a performance measure. Their
findings suggest that supplier can obtain a higher rating by
its buyer through emphasis on process management and
employee satisfaction. Trent and Monczka (1999) propose
a hierarchy of QM activities which can support world-class
supplier quality performance. Shin et al. (2000) conclude
that an improvement in supply management orientation has
impact on both suppliers’ and buyers’ performance, particular in terms of delivery- and quality-related performance.
Fynes et al. (2005) found a positive impact of supply chain
relationship quality on quality performance. Lai et al. (2005)
suggest that supplier firms regard a stable relationship as
being positively linked to supplier commitment to quality.
Tracey and Tan (2001) state that customer satisfaction can
be improved through supplier involvement and selecting
suppliers based on product quality, delivery reliability, and
product performance.
Some studies consider quality process integration both with
suppliers on the upstream side and with customers on the
downstream side simultaneously, however, the internal quality
activities and their relationships with the upstream and downstream quality management have not been addressed. Forza
(1996) investigates how interactions with suppliers and customers for quality and flow are related to quality and time
performance. Salvador et al. (2001) demonstrate that by interacting with suppliers and with customers regarding materials
flow and quality, a firm can obtain better time-related operational performance in terms of speed and delivery punctuality.
Romano and Vinelli (2001), in their case study, examine the
two different supply chains operated by a textile and apparel
manufacturer – one is traditionally managed without formal
integration, whereas the other is more coordinated with suppliers and customers. Their findings indicate that the integrated supply network is able to better meet the quality
expectations of the final customers through the joint definition
and co-management of quality practices.
While SCQM requires simultaneous integration of internal
practices, upstream supplier quality performance and downstream customer requirements, only a few studies have simultaneously addressed all these dimensions. Tan et al. (1999)
investigate the impact of in-house quality management, supply
base management and customer relations practices on corporate
Supply chain quality management practices and performance: an empirical study
performance. Kuei et al. (2001) extend the QM instrument
proposed by Saraph et al. (1989) by including four quality
factors (supplier selection, supplier participation, customer relations and benchmarking) to study the association between
SCQM and organizational performance. Though these two
studies consider the dimensions of SCQM from the internal,
upstream and downstream sides of supply chain, the relationships among these dimensions are not examined. Lin et al.
(2005) identify three dimensions of SCQM (QM practices,
supplier participation and supplier selection) and investigate
the causal relationship between them and organizational performance using two data sets collected from Taiwan and Hong
Kong. The results show that organization performance can be
improved directly by supplier participation strategy which is
significantly correlated with both supplier selection and QM
practices. In their study, the construct of customer relations is
not treated as an independent dimension of SCQM but lumped
together with internal quality practices such as training and
employee relations. The relationships between customer relations and internal/upstream quality management are not examined either. Kaynak and Hartley (2008) which uses supplier
quality management and customer focus to extend the causal
framework for QM practices and performance in Kaynak
(2003) into the supply chain. This study examines how these
two upstream and downstream practices lead to improved
performance and how other practices mediate those relationships. The findings reveal that supply chain members need each
develop interclocking practices based on communication, collaboration and integration to improve quality performance at
the end of the supply chain. This study examines the detailed
interplay between quality practices both internal and external.
A further study which captures SCQM by three major dimensions of internal, upstream and downstream QM would be
valuable to provide more macro guidance for quality integration throughout the entire supply chain, and help practitioners
identify the most significant dimension and leverage its linkage
with the other dimensions.
From this literature review, we can see that studies on
SCQM suffer incomplete consideration of the dimensions of
SCQM covering internal, upstream and downstream sides of
supply chain, and insufficient examination of the causal
linkages among these dimensions. This empirical study will
try to fill this void by proposing a comprehensive framework covering all these dimensions and testing their causal
linkages as discussed in more detail below.
3 Research framework
SCM consists of internal practices, which are contained
within a firm, and external practices, which cross organizational boundaries to integrate a firm with its customers and
suppliers (Dröge et al., 2004; Li et al., 2006). From the
21
operations management perspective, flow management and
quality management are the two dimensions of the supply
chain (Forza, 1996). Maintaining high conformity in the
upstream stages helps to avoid the extra inspection activities
or the management of return flows for repairs in the downstream phases, facilitating the supply chain’s workflow. As
one significant dimension of supply chain, SCQM not only
requires QM to be implemented internally within each supply chain member’s organization, but also requires communication, collaboration, and integration with both upstream
and downstream supply chain members with respect to
quality (Kaynak and Hartley, 2008). Based on this concept,
we conceptualize SCQM as three components: internally
implemented QM (internal QM), interaction with suppliers
for quality (upstream QM), and interaction with customers
for quality (downstream QM). The latter two QM practices,
upstream QM and downstream QM, are clearly in the domain of SCM, and extend QM into the supply chain.
Based on a comprehensive literature view, QM practices
with internal focus have been identified as internal QM – Top
management leadership, Strategic planning, Quality information, Process management, Workforce management, and
Product design process. Upstream QM contains the following
supply management practices identified from the literature,
such as a long-term relationship with suppliers, supplier involvement in product development and quality improvement,
quality focus in selecting suppliers, and supplier certification.
Downstream QM includes such practices as frequent meetings
with customers, customer visits to the plant, encouragement of
customer feedback on quality; customer involvement in product design and use of customer needs survey. In addition, we
adopt Juran (1992)’s concept of “Little Q” and “Big Q” to
examine quality performance. “Little Q” relates to the internal
dimensions of quality linking to the production point of view,
while “Big Q” considers external or marketplace quality linking to the user’s point of view. Conformance quality refers to
the ability to meet targets for quality within the manufacturing
unit (Flynn et al., 1994), and responds to “Little Q”. Customer
satisfaction reflects not only delivered quality but also intangibles such as value and customer expectations (Flynn et al.,
1994; Anderson et al., 1995), and relates to the aspect of “Big
Q”. The above SCQM practices and quality performance, and
the associated supporting literature are showed in Table 1.
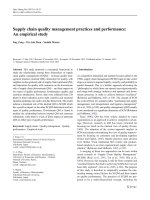
Figure 1 presents the proposed conceptual framework in a
structural equation model. In this model, internal QM is
presented as a latent construct which is linked to each of
its measurement scales (Top management leadership,
Strategic planning, Quality information, Process management, Workforce management, and Product design process).
In addition, the structural relationships depicted by arrows
H1-H8 correspond to the hypotheses developed as below.
From a cooperation perspective, Hillebrand and Biemans
(2003) propose that internal cooperation may function as a
22
J. Zeng et al.
Table 1 Description of the constructs of SCQM and supporting literature
Construct
Internal QM
Top management support
Strategic planning
Quality information
Process management
Workforce management
Product design process
Upstream QM
Downstream QM
Description
Studies
Involvement in and constant commitment
of the company top management in all its
functions to quality improvement
Adam et al.(1997), Ahire et al. (1996),
Ahire and O’Shaughnessy (1998), Anderson
et al. (1995), Flynn et al. (1994), Kaynak (2003),
Saraph et al. (1989), Powell (1995), Samson
and Terziovski (1999)
Choi and Eboch (1998), Samson and
Terziovski (1999)
Ahire et al. (1996), Choi and Eboch (1998),
Flynn et al. (1994), Kaynak (2003), Samson
and Terziovski (1999), Kaynak (2003), Saraph
et al. (1989),
Ahire et al. (1996), Anderson et al. (1995), Ahire
and O’Shaughnessy (1998), Choi and Eboch
(1998), Flynn et al. (1994), Forza and Filippini
(1998), Kaynak (2003), Powell (1995), Samson
and Terziovski (1999), Saraph et al. (1989)
Designing internal functions to reflect the
organization’s mission
Availability of information on quality performance
and productivity, charts posted on the shopfloor
showing defect rates, schedule compliance and
machine breakdowns
Monitoring of manufacturing process through
the techniques and tools applied to a process
to reduce process variation
Use of statistical process control to maintain
control over production processes and reduce
variance in processes (Process control);
Preventive maintenance;
clean and organization of the workplace
(Housekeeping)
Implementation of employee involvement and
quality circles (Small group problem solving);
provision of quality-related training for all
employees (Task-related training for employees);
employee suggestion regarding improvements
(Employee suggestion)
Involvement and cooperation of all affected
departments and the entire staff in
design reviews
Long-term relationships with suppliers; supplier
involvement in product development; quality
rather than price focus in selecting suppliers;
supplier certification; suppliers involvement
in quality improvement;
Frequent meetings with customers, customer
visits to the plant, encouragement of customer
feedback on quality; customers involvement
in product design; use of customer needs survey
Adam et al.(1997), Ahire et al. (1996), Ahire and
O’Shaughnessy (1998), Choi and Eboch (1998),
Flynn et al. (1994), Forza and Filippini (1998),
Kaynak (2003), Samson and Terziovski (1999),
Saraph et al. (1989)
Adam et al.(1997), Ahire et al. (1996), Ahire
and Dreyfus (2000), Flynn et al. (1994),
Kaynak (2003), Saraph et al. (1989)
Ahire et al. (1996), Flynn et al. (1994); Forza (1996),
Forza and Filippini (1998), Kaynak (2003), Lin
et al. (2005), Shin et al. (2000), Tan et al. (1999),
Tracey and Tan (2001), Salvador et al. (2001)
Flynn et al. (1994), Forza (1996), Forza and Filippini
(1998), Tan et al. (1999), Salvador et al. (2001)
Quality performance
Conformance quality
Customer satisfaction
Conformity to product specifications which
the product reaches at the end of the
production process
Global customer satisfaction as regards
products and services received.
prerequisite coordination mechanism for external cooperation.
Also, the literature on supply chain integration suggests that
companies should strengthen their internal integration before
attempting to integrate themselves with suppliers and customers (King and Teo, 1997). Koufteros et al. (2005) empirically
demonstrate that internal integration has a positive influence
on customer integration and supplier product and process
integration in new product design. Based on the reviewed
literature, we propose that internal QM should precede the
Ahire and Dreyfus (2000), Forza (1996), Forza and
Filippini (1998), Flynn et al. (1995), Juran (1992),
Anderson et al. (1995), Ahire and Dreyfus (2000),
Forza (1996), Forza and Filippini (1998), Flynn
et al. (1995), Juran (1992)
external QM with suppliers and customers and hypothesize
the following:
H1: Internal QM has a positive impact on upstream QM.
H2: Internal QM has a positive impact on downstream
QM.
In a case study by Carter and Ellram (1994), supplier involvement in product design is found to improve defect rate in
the later manufacturing stage. Shin et al. (2000) demonstrate
Supply chain quality management practices and performance: an empirical study
23
Fig. 1 Proposed model
that supplier management orientation such as a long-term
relationship with suppliers, supplier involvement in the product development process and a quality focus, improves not
only supplier performance but also buyer’s quality performance. Tracey and Tan (2001) conclude that supplier selection
criterion (quality, delivery and product performance), the supplier involvement in product development and in continuous
improvement programs have positive impact on customer
satisfaction. Flynn and Flynn (2005) empirically verify Trent
and Monczka (1999)’s hierarchical model for supplier quality
management practices and demonstrate that co-makership
practices such as supplier product and process design involvement positively influence supply chain performances. Lin et
al. (2005) suggest that supplier participation in product design
and kaizen projects/workshops improves organizational performance directly. Consequently, the following hypotheses
are proposed:
H3: Upstream QM has a positive impact on conformance
quality.
H4: Upstream QM has a positive impact on customer
satisfaction
The positive relationships between the internally focused
QM practices examined in this study (top management
leadership, strategic planning, workforce management,
quality information, process management and product design process) and quality performance has been supported
by many empirical studies, such as Adam (1997), Flynn et
al. (1995), Choi and Eboch (1998), Forza and Filippini
(1998), Ahire and Dreyfus (2000), Kaynak (2003), to name
a few. Top management’s commitment to quality could act as
a driving force for quality effort. As managerial commitment
is translated into specific strategies, employee participation in
decision making processed through training and empowerment
are fostered. This can support the implementation of designing
quality into products and services, and assuring in-process
quality through the use of quality information, leading to higher
quality performance. Tan et al. (1998) investigate three firms’
in-house QM approaches (designing quality into the product,
process control, process improvement). Their results indicate
that these approaches complement with supply base management to enhance firms’ competitive performance. This leads to
the following hypotheses:
H5: Internal QM has a positive impact on conformance
quality.
H6: Internal QM has a positive impact on customer
satisfaction.
In an effective supply chain network, members maintain
and sustain a customer-driven culture, offering the right product in the right place, at the right time and at the right price
(Kuei et al., 2001). The integration and collaboration activities
with customers permit customers’ needs to be satisfied in a
much more targeted way (Forza and Filippini, 1998).
Customer feedback facilitates fast corrective action to be made
to the product or to the process and thus leads to an increase in
outgoing conformity. Rungtusanatham et al. (2003), using the
resource-based view of the firm, argue that both upstream
linkages with suppliers and downstream linkages with customers can serve as a resource to provide operational performance benefits to a firm. Tan et al. (1999) empirically found
that customer relation practices had a positive impact on
performance. Therefore, we hypothesize:
H7: Downstream QM has a positive impact on conformance quality.
24
J. Zeng et al.
H8: Downstream QM has a positive impact on customer
satisfaction.
4 Methodology
4.1 Sample
The sample is comprised of data collected through an international joint research named High Performance Manufacturing
(HPM). The aim of this project is to study management practices and their impact on plant performance within global
competition. The sample consists of 238 manufacturing plants
which are both traditional and world-class plants, and was
stratified by industry and nation. Countries included the
United States, Japan, Italy, Sweden, Austria, Korea, Germany
and Finland, and the industries included machinery, electronics
and transportation. Since these industries were the ones in
transition, a great deal of variability in performance and practices was expected to be present (Schroeder and Flynn, 2001).
All plants in the sample represented different parent
corporations and each had at least 250 employees. A sample
of 366 plants was randomly drawn from a master list of
manufacturing plants for each country. All of these plants
were solicited for participation by calling or personal visit.
Two hundred thirty eight plants agreed to participate and
each plant received a batch of questionnaires. The question
items were assigned to multiple questionnaires and distributed to the appropriate respondents. The final response rate
accounted for 65 %. Table 2 summarizes the key characteristics
of these plants, by industry and country.
4.2 Measures
To operationalize internal QM, upstream QM and downstream
QM, we identify suitable measurement scales from the HPM
database that would be consistent with the meaning of the
dimensions. Internal QM is a multi-dimensional construct,
and its six dimensions – Top management leadership,
Strategic planning, Quality information, Process management, Workforce management, and Product design process
have been suggested by the previous literature (Table 1).
Among them, process management refers to monitoring of
manufacturing process through the techniques and tools applied to a process to reduce process variation, so that it
operates as expected, without breakdowns, missing materials,
fixtures, tools, etc. and despite work force variability (Flynn et
al., 1994). Process management includes the use of statistical
process control to track process performance for in-production
quality assurance (Deming, 1986; Ahire and Dreyfus, 2000),
heavy reliance on preventive maintenance aiming to conduct
safety activities and avoid equipment breakdowns through
scheduled maintenance (Flynn et al., 1995; Arauz et al.,
2009), and emphasis on housekeeping which keeps the cleanliness and organization of the workplace to avoid clutter that
hides defects and their causes (Flynn et al., 1994; Schonberger,
2007). Therefore, Process management is constructed as a
super-scale consisting of three individual measurement scales:
Process control, Preventive maintenance, and Housekeeping.
Workforce management should be managed in concert with
methodological manufacturing practices (Snell and Dean,
1992), and has been underlined as one of the fundamental
dimensions in quality management (e.g. Flynn et al., 1994;
Forza and Filippini, 1998). The developing and encouraging
team problem-solving approaches (Flynn et al., 1995), providing quality-oriented and job-specific training (Garvin, 1984;
Flynn et al., 1994), and taking advantage of employees’ ability
to make proposals for improvements (Forza and Filippini,
1998) all have been highlighted as important areas of workforce management by previous literature. Thus Workforce management is also constructed as a super-scale by three individual
measurement scales: Small group problem solving, Task-
Table 2 Demographic of sample plants
Country
Electrical & Electronic
Machinery
Automobile
Total
Plant characteristics
Average Market
Share (%)
Average Sale ($000)
Average of Number
of Employee
(salaried person)
Total
US
Japan
Italy
Sweden
Austria
Korea
Finland
Germany
9
11
9
29
10
12
13
35
10
10
7
27
7
10
7
24
10
7
4
21
10
10
11
31
14
6
10
30
9
13
19
41
25.50
25.05
23.38
27.14
20.03
31.54
22.48
30.21
284181
153
1118492
474
71209
296
584371
348
64474
122
2266962
2556
47705
87
173621
161
79
79
80
238
Supply chain quality management practices and performance: an empirical study
related training for employees, and Employee suggestions.
Each of other four dimensions (Top management leadership,
Strategic planning, Quality information, and Product design
process) is measured by a single measurement scale respectively with the question items shown in the Appendix. In total,
a set of ten measurement scales is identified to measure the six
dimensions of internal QM.
Upstream QM is measured by one measurement scale
which contains seven question items addressing various issues
regarding supply management for quality, such as supplier
selection, supplier relationship, supplier involvement, etc.
Downstream QM is also measured by a multi-item measurement scale constituted by six question items covering various
practices regarding the links with customers for quality. The
above twelve measurement scales are measured through perceptual questions over seven-points on the Likert scale, where
a value of 1 indicates the worst performance and a value of 7
indicates the best performance. Each of these measurement
scales has multiple respondents from the same plant. These
respondents are from nine positions: direct workers, human
resource manager, quality manager, supervisors, process engineer, plant superintendent, inventory manager, member of
product development team, and plant manager.
As noted earlier, we consider two measures of quality performances – Conformance quality and Customer satisfaction.
The measure of conformance quality was judged by the plant
manager on a five-point Likert scale, where a high score
indicates that plant management perceives that the plant has
been relatively successful pursuing quality conformance comparing to its competitors. Customer satisfaction was evaluated
by multiple informants on a seven-point Likert scale (1=strongly disagree, 4=neither agree nor disagree, 7=strongly agree).
Then, we assess the measurement quality of each multi-item
measurement scale, and with satisfactory measurement quality
Table 3 Summary of measurement analysis
25
results, we average the item scores for the measurement scale.
All scale responses are averaged into a single plant response per
scale; analysis is at the plant level. Aggregating respondents
across respondent category and collecting the same data from
different respondents can help to address the issue of common
method bias.
4.3 Testing measurement instruments
The validation process for the survey instrument includes
three steps: reliability, content validity and construct validity. The reliability and validity tests for the ten measurement
scales for internal QM from Top management leadership to
Product design process as well as Upstream QM and
Downstream QM in Table 3 are conducted on a dataset at
an individual level consisting of response from each respondent. Reliability is operationalized through the internal consistency method and Cronbach’s alpha is used as the
reliability indicator. Cronbach’s alpha value of at least 0.6
is considered acceptable, and items that do not strongly
contribute to alpha and whose content is not critical are
eliminated. Table 3 shows the alpha value for all scales
and most the scales exceed the lower limit by a substantial
margin, indicating that the scales are internally consistent.
Content validity is ensured through an extensive review
of literature and empirical studies. Construct validity measures the extent to which the items in a scale all measure the
same multivariate construct. It is established through the use
of factor analysis, demonstrating that all scales are onedimensional. Table 3 presents the summary of the eigenvalues for each of the scales and the Appendix shows the factor
loadings by item. The eigenvalue of the first factor for each
scale is more than two exceeding the minimum eigenvalue
of 1.00, and all factor loadings meet the criterion of larger
Measurement Scale
Mean
S.D.
Cronbach Alpha
Eigenvalue (% variance)
Top management leadership
Strategic planning
Quality information
Process control
5.505
5.239
4.878
4.811
0.613
0.864
0.843
0.827
0.795
0.799
0.791
0.824
3.068(51)
2.524(63)
2.759(55)
2.964(59)
Preventive maintenance
Housekeeping
Small group problem solving
Task-related training for employees
Employee suggestion
Product design process
Upstream QM
Downstream QM
Process management
Workforce management
4.858
5.516
5.046
5.187
5.171
4.825
5.050
5.324
4.987
5.153
0.666
0.687
0.640
0.625
0.624
0.711
0.507
0.519
0.577
0.551
0.675
0.817
0.824
0.792
0.834
0.700
0.770
0.682
0.696
0.820
2.202(44)
2.847(57)
3.211(54)
2.477(62)
3.025(60)
2.438(41)
2.874(48)
2.348(47)
1.878(63)
2.205(73)
26
J. Zeng et al.
than 0.4, indicating all of items contribute to their respective
scales.
After establishing satisfactory measurement performance, a
dataset at the plant level is aggregated by calculating the
average value of all the valid responses at the plant. Based on
this plant-level data, the two super-scales Process Management
consisting of Process control, Preventive maintenance, and
Housekeeping, and Workforce Management consisting of
Small group problem solving, Task-related training for employees, and Employee suggestions are subject to the same process
of testing reliability and validity as above. The two super-scales
are found to be reliable and valid as shown at the bottom of
Table 3, and then they are computed by averaging the scores of
their corresponding measurement scales respectively.
5 Hypothesis testing
Hypotheses are tested using AMOS program. A number of
indices are used to determine the fit of the data to the model
(e.g. χ2/df, CFI, RMSEA and PNFI). The overall fit statistics for the hypothesized model are χ2 =101.383, df=31, χ2/
df=3.270, p<0.01, CFI=0.922, PNFI=0.504, RMSEA=
0.091, which are acceptable in terms of model fit. While the
closeness of our χ2/df ratio to the threshold level of 3 indicates
marginal goodness-of-fit, a p value less than 0.01 does not
indicate good fit. However, this measure is particularly sensitive to sample size and assumptions of normality (Hu and
Bentler, 1995). Consequently, in large samples “almost any
model with positive degrees of freedom is likely to be rejected
as providing a statistically unacceptable fit” (Long, 1983).
Accordingly, alternative measures of fit need to be considered.
Our CFI which has the value of 0.922, is optimal, since it has
to be greater than 0.9 for the model to be considered very good
(Bentler, 1990). PNFI should be higher than 0.5 for the model
to be considered very good; on this measure, our results
(PNFI=0.504) indicates good fit. RMSEA is another fit
statistics which adjust the sample discrepancy function by
degree of freedom. An absolute RMSEA value under 0.1 is
acceptable, particularly a RMSEA value less than 0.05 suggests a good fit, and a RMSEA value between 0.05 and 0.08
indicates a reasonable fit (Browne and Cudeck, 1993). The
Table 4 Results for the measurement model
model has a RMSEA value of 0.091, and this is almost good.
From these fit statistics, it is concluded that the overall model
demonstrates an acceptable level of fit.
In addition to a good fit of the structural model, a good
structural equation model needs to have a good measurement model. Table 4 presents the estimated values of the
standardized path coefficients of all measurement constructs
to the related latent construct internal QM, and the relative
p-value. One construct does not present p-values in that the
relative path coefficient is fixed at 1 as suggested in SEM
theory. The six constructs of internal QM all have significant estimates of coefficients between 0.424 and 0.856,
demonstrating a good measurement model of internal QM.
Table 5 presents estimated values of the standardized coefficients which link with their constructs, and the relative pvalue. It can be seen that five links between constructs hypothesized are statistically significant at a level of 1 %. Among eight
hypotheses, five are supported and three are rejected. The
results show that internal QM positively affects both upstream
QM and downstream QM, supporting H1 and H2. The results
also indicate that upstream QM has no significant impact on
either type of quality performance, while internal QM has direct
and positive impact on both of conformance quality and customer satisfaction, suggesting rejection for H3 and H4 and
support for H5 and H6. Further, downstream QM only shows
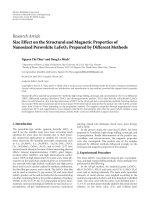
significant impact on customer satisfaction rather than conformance quality, and thus H7 is rejected while H8 is supported.
Figure 2 presents the summary of the findings above.
We tentatively delete the three non-significant paths to
check whether model fit can be significantly improved.
Accordingly, a set of overall fit statistics are obtained:
χ2 =105.911, df=34, χ2/df=3.115, p<0.01, CFI=0.920,
PNFI=0.550, and RMSEA=0.087. A chi-square difference test
is then executed by calculating χ2diff =105.911−101.383=
4.528 with 34−31=3° of freedom. This statistic is not significant (p-value=0.210), indicating that omitting these paths does
not lead to a significant better model fit. Deleting the nonsignificant paths should assume that upstream QM has no
impact on performance, which is not acceptable given that the
theory on SCQM has highlighted the importance to upstream
QM. Therefore, the originally proposed model should not be
revised.
Construct name
Measure variable
Internal QM
Top Management Leadership
Strategic Planning
Quality Information
Process Management
Workforce Management
Product Design Process
Standardized coefficient
p-value
0.608
0.537
0.776
0.856
0.836
0.424
–
0.000
0.000
0.000
0.000
0.000
Supply chain quality management practices and performance: an empirical study
27
Table 5 Results of the structural model
Causing construct
Caused construct
Hypothesis
Internal QM
Internal QM
Upstream QM
Upstreamm QM
Internal QM
Internal QM
Downstream QM
Downstream QM
Upstream QM
Downstream QM
Conformance quality
Customer satisfaction
Conformance quality
Customer satisfaction
Conformance quality
Customer satisfaction
H1
H2
H3
H4
H5
H6
H7
H8
6 Discussion and managerial implications
In this section, we discuss over the main findings and implications for management. First, our study confirms the multidimensionality of the SCQM construct (Kuei et al. 2001; Lin
et al., 2005; Kaynak and Hartley, 2008). Internal QM appears
to be a key driver for SCQM, because it has significant impact
on both upstream and downstream QM. The implication is
that a prerequisite for moving towards SCQM is an effective
implementation of QM within an organization to establish a
quality-culture base for subsequent collaboration and integration with upstream and downstream organizations for quality.
Second, our results reject H3 and H7 and suggest that
conformance quality is not directly affected either by upstream
or downstream QM. Forza (1996) also reports a similar finding: interaction with suppliers and customers with regard to
quality are not correlated to internal quality. It appears that the
Standardized coefficient
p-value
0.624
0.554
0.079
0.068
0.427
0.365
0.112
0.309
0.000
0.000
0.357
0.312
0.000
0.000
0.160
0.000
Result
Supported
Supported
Not supported
Not supported
Supported
Supported
Not supported
Supported
reduction of process defect rates above all requires an internal
activity with no particular need for interaction between customers and suppliers. He suggests the necessity to examine the
role of internal actions which were not included in its analysis.
This study verifies the dominant role of internal quality activities in achieving conformity. As SCM has become popular,
many companies have been exhorted to implement initiatives
linking to their suppliers and customers. However, our study
suggests that these initiatives can not replace the role of
internal quality activities to achieve conformance quality.
Managers are recommended not to rely on co-makership alone
as a quick-fix solution to enhance conformance quality without enough commitment to internal quality system.
Third, compared with conformance quality, the situation
is quite different for customer satisfaction. Two paths are
detected to customer satisfaction. One is a direct impact of
internal QM, and the other is an indirect impact of internal
Fig. 2 Summary of findings
Note: Dashed line: insignificant at 5% level;
Solid line: significant at 1% level
28
QM mediated by downstream QM. This supports the notion
that obtaining customer satisfaction requires not only a
sound internal quality system but also great attention to
factors which concern downstream relations with customers
such as their involvement in quality improvement, contact
during design stages etc. (Forza and Filippini, 1998).
Managers are encouraged to look beyond their own internal
organizations into the supply chain and actively integrate
with downstream quality process to achieve better customer
satisfaction.
Four, the role of quality process integration with suppliers
appears to be quite different from that with customers to
enhance quality performance. This supports the suggestion that
“from a supply chain perspective, different approaches may be
needed for integration with customers and with suppliers”
(Kaynak and Hartley, 2008). While downstream interaction
with customers for quality has a direct impact on quality
performance, the integration of quality process with suppliers
appears to be more complicated and the impact on quality
performance is less apparent, and this would explain why
customers are integrated into quality processes more often than
suppliers as found by Sila et al. (2006). It is also possible that
the upstream integration of quality process would interact with
the internal quality process or the downstream integration of
quality process to influence quality performance.
7 Limitations and future research
It is important to view this study in the context of its limitations. First, this study suffers the generic limitations for any
empirical study with survey-based subjective and qualitative
data. Although the respondents varied by scale, this study
relies on the perceptions of the respondents to operationalize
the survey instruments. This may have introduced bias into the
data, which could cause potential concerns regarding generalizability, reliability, and validity. Another limitation relates to
the measure of quality performance. It asks managers their
perception of the conformance quality of the products and
customer satisfaction. Measurement of quality in the eyes of
the customers would be valuable in future studies. Although a
large amount of objective data on quality performance, such
as ‘Percentage of scrap and rework’ and ‘Percent of items that
pass final inspection without requiring rework’, was collected
in this project, these data cannot be used in this study due to
industrial difference and a large number of missing values.
Future studies should strive to include objective data on
quality performance.
While this study has contributed to the body of knowledge in the emerging area of SCQM, we suggest that the
following areas could further enhance and extend theoretical
development. First, the lack of direct link between upstream
QM and either type of quality performance points to a need
J. Zeng et al.
for detailed investigation of the role of quality process
integration with suppliers in SCQM. Does the integration
of quality process with suppliers indirectly relate to quality
performance through some mediating factor? What is the
mediating factor? Second, an examination of the potential
effects of contingency factors on the proposed framework
could also provide a fruitful field of research endeavor. The
relationships between different dimensions of SCQM and
the ways they impact quality performance may depend on
contextual and situational conditions such as industry, country and the position in the supply chain. Third, longitudinal
research would be very valuable to observe the QM integration process into the supply chain and further test the causeeffect relationships found in this study.
8 Conclusions
This study examines the relationships among three dimensions
of SCQM – in-house QM practices (internal QM), interaction
for quality with suppliers on the upstream side of supply chain
(upstream QM), and interaction for quality with customers on
the downstream side of supply chain (downstream QM) – and
their impact on different types of quality performance. The
results suggest that a prerequisite to supply chain quality is the
effective implementation of QM internally within individual
supply chain members. Managers who look beyond their own
internal organizations into the supply chain, can find useful
benefit through the collaboration, integration and communication among supply chain members with respect to quality.
Particularly, downstream integration with customers for quality can bring a direct benefit to the improvement of quality
performance in terms of customer satisfaction. In summary, the
different ways of different dimensions of SCQM to affect
different types of quality performance can provide guidance
for the organizations to integrate quality into the supply chain.
Acknowledgments The authors appreciate the financial support for
this research from the Japan Society for the Promotion of Science by
Grant-in-Aid for Scientific Research, No. 22330112.
Appendix: Question items of measurement scales
Factor loadings are given in parentheses following each
item.
Top management leadership
1. All major department heads within the plant accept their
responsibility for quality (0.721)
2. Plant management provides personal leadership for
quality products and quality improvement (0.815)
Supply chain quality management practices and performance: an empirical study
29
3. The top priority in evaluating plant management is
quality performance (0.522)
4. Our top management strongly encourages employee
involvement in the production process (0.635)
5. Our plant management creates and communicates a
vision focused on quality improvement (0.791)
6. Our plant management is personally involved in quality
improvement projects (0.764)
2. In order to improve equipment performance, we sometimes redesign equipment (0.542)
3. We estimate the lifespan of our equipment, so that repair
or replacement can be planned (0.748)
4. We use equipment diagnostic techniques to predict
equipment lifespan (0.734)
5. We do not conduct technical analysis of major breakdowns (0.578)
Strategic Planning
Housekeeping
1. Our plant has a formal strategic planning process, which
results in a written mission, long-range goals and strategies for implementation (0.841)
2. This plant has a strategic plan, which is put in writing
(0.849)
3. Plant management routinely reviews and updates a
long-range strategic plan (0.789)
4. The plant has an informal strategy, which is not very
well defined (0.689)
1. Our plant emphasizes putting all tools and fixtures in
their place (0.698)
2. We take pride in keeping our plant neat and clean
(0.811)
3. Our plant is kept clean at all times (0.856)
4. Employees often have trouble finding the tools they
need (0.586)
5. Our plant is disorganized and dirty (0.791)
Small group problem solving
Quality Information
1. Charts showing defect rates are posted on the shop floor
(0.758)
2. Charts showing schedule compliance are posted on the
shop floor (0.754)
3. Charts plotting the frequency of machine breakdowns
are posted on the shop floor (0.692)
4. Information on quality performance is readily available
to employees (0.781)
5. Information on productivity is readily available to
employees (0.726)
1. During problem solving sessions, we make an effort to
get all team members’ opinions and ideas before making
a decision (0.643)
2. Our plant forms teams to solve problems (0.805)
3. In the past three years, many problems have been solved
through small group sessions (0.786)
4. Problem solving teams have helped improve manufacturing processes at this plant (0.775)
5. Employee teams are encouraged to try to solve their
own problems, as much as possible (0.652)
6. We don’t use problem solving teams much, in this plant
(0.710)
Process control
Task-related training for employees
1. Processes in our plant are designed to be “foolproof”
(0.581)
2. A large percent of the processes on the shop floor are
currently under statistical quality control (0.815)
3. We make extensive use of statistical techniques to reduce variance in processes (0.825)
4. We use charts to determine whether our manufacturing
processes are in control (0.734)
5. We monitor our processes using statistical process control (0.862)
1. Our plant employees receive training and development
in workplace skills, on a regular basis (0.854)
2. Management at this plant believes that continual training
and upgrading of employee skills is important (0.779)
3. Employees at this plant have skills that are above average, in this industry (removed)
4. Our employees regularly receive training to improve
their skills (0.879)
5. Our employees are highly skilled, in this plant (0.608)
Preventive maintenance
Employee suggestion
1. We upgrade inferior equipment, in order to prevent
equipment problems (0.689)
1. Management takes all product and process improvement suggestions seriously (0.809)
30
2. We are encouraged to make suggestions for improving
performance at this plant (0.780)
3. Management tells us why our suggestions are implemented or not used (0.764)
4. Many useful suggestions are implemented at this plant
(0.819)
5. My suggestions are never taken seriously around here
(0.711)
Product design process
1. Direct labor employees are involved to a great extent
before introducing new products or making product
changes (0.635)
2. Manufacturing engineers are involved to a great extent
before the introduction of new products (0.727)
3. There is little involvement of manufacturing and quality
people in the early design or products, before they reach
the plant (0.677)
4. We work in teams, with members from a variety of areas
(marketing, manufacturing, etc.) to introduce new products (0.706)
5. We are not concerned about the number of parts in an
end item (0.517)
6. Our engineers make an effort to simplify our product
designs (0.529)
Upstream QM
1. We strive to establish long-term relationships with suppliers (0.649)
2. Our suppliers are actively involved in our new product
development process (0.711)
3. Quality is our number one criterion in selecting suppliers (0.552)
4. We use mostly suppliers that we have certified (0.623)
5. We maintain close communication with suppliers about
quality considerations and design changes (0.804)
6. We actively engage suppliers in our quality improvement efforts (0.779)
7. We would select a quality supplier over one with a
lower price (removed)
Downstream QM
1. We frequently are in close contact with our customers
(0.690)
2. Our customers seldom visit our plant (removed)
3. Our customers give us feedback on our quality and
delivery performance (0.721)
4. Our customers are actively involved in our product
design process (0.582)
J. Zeng et al.
5. We strive to be highly responsive to our customers’
needs (0.727)
6. We regularly survey our customers’ needs (0.706)
Quality performance
Please circle the number which indicates your opinion about
how your plant compares to its competition in your industry
in terms of quality of product conformance, on a global
basis? 5=Superior or better than average, 4=better than
average, 3=Average or equal to the competition, 2=Below
average, 1=Poor, low end of industry.
References
Adam EE Jr, Corbett LM, Flores BE, Harrison NJ, Lee TS, Rho BH,
Ribera J, Samson D, Westbrook R (1997) An international study
of quality improvement approach and firm performance. Int J
Oper Prod Manage 17:842–873
Ahire SL, Dreyfus P (2000) The impact of design management and
process management on quality: an empirical examination. J Oper
Manage 18:549–575
Ahire SL, O’Shaughnessy KC (1998) The role of top management
commitment in quality management: an empirical analysis of the
auto parts industry. Int J Qual Sci 3:5–37
Ahire SL, Golhar DY, Waller MA (1996) Development and validation
of TQM implementation constructs. Decis Sci 27:23–56
Anderson JC, Rungtusanatham M, Schroeder RG, Devaraj S (1995) A
path analytic model of a theory of quality management underlying
the Deming management method: preliminary empirical findings.
Decis Sci 26:637–658
Arauz R, Matsuo H, Suzuki H (2009) Measuring changes in quality
management: an empirical analysis of Japanese manufacturing
companies. Total Qual Manage Bus Excell 20:1337–1374
Bentler PM (1990) Comparative fit indexes in structural models.
Psychol Bull 107:238–246
Browne M, Cudeck R (1993) Alternative ways of assessing model fit.
In: Bollen KA, Long JS (eds) Testing structural equation models.
Sage Publications, Newbury Park
Carter JR, Ellram LM (1994) The impact of inter-organizational alliances in improving supplier quality. Int J Phys Distrib Logist
Manag 24:15–23
Choi TY, Eboch K (1998) The TQM paradox: relations among TQM
practices, plant performance, and customer satisfaction. J Oper
Manage 17:59–75
Deming WE (1986) Out of the crisis. MIT Press, Cambridge
Dröge C, Jayaram J, Vickery S (2004) The effects of internal versus
external integration practices on time-based performance and
overall firm performance. J Oper Manage 22:557–573
Flynn BB, Flynn EJ (2005) Synergies between supply chain management and quality management: emerging implications. Int J Prod
Res 43:3421–3436
Flynn BB, Schroeder RG, Sakakibara S (1994) A framework for
quality management research and an associated measurement
instrument. J Oper Manage 11:339–366
Flynn BB, Schroeder RG, Sakakibara S (1995) The impact of quality
management practices on performance and competitive advantage. Decis Sci 26:659–692
Supply chain quality management practices and performance: an empirical study
Forker LB, Mendez D, Hershauer JC (1997) Total quality management
in the supply chain: what is its impact on performance. Int J Prod
Res 35:1681–701
Forza C (1996) Achieving superior operating performance from integrated pipeline management: an empirical study. Int J Phys
Distrib Logist Manag 26:36–63
Forza C, Filippini R (1998) TQM impact on quality conformance and
customer satisfaction: a causal model. Int J Prod Econ 55:1–20
Foster ST (2008) Towards an understanding of supply chain quality
management. J Oper Manage 26:461–467
Foster ST, Ogden J (2008) On differences in how operations and
supply chain managers approach quality management. Int J Prod
Res 46:6945–6961
Fynes B, Voss C, Búrca SD (2005) The impact of supply chain
relationship quality on quality performance. Int J Prod Econ
96:339–354
Garvin DA (1984) Japanese quality management. Columbia J World
Bus 19:3–12
Hillebrand B, Biemans WG (2003) The relationship between internal
and external cooperation: literature review and propositions. J Bus
Res 56:735–743
Hu L, Bentler PM (1995) Evaluating model fit. In: Hoyle RH (ed)
SEM concepts, issues and applications. Sage Publications,
Thousand Oaks, pp 76–99
Juran JM (1992) Juran on quality by design – the new steps for planning
quality into goods and services. The Free Press, New York
Kaynak H (2003) The relationship between total quality management
practices and their effects on firm performance. J Oper Manage
21:405–435
Kaynak H, Hartley JL (2008) A replication and extension of quality
management into the supply chain. J Oper Manage 26:468–489
King WR, Teo TSH (1997) Integration between business planning and
information systems planning: validating a stage hypothesis.
Decis Sci 28:279–308
Koufteros X, Vonderembse M, Jayaram J (2005) Internal and external
integration for product development: the contingency effect of uncertainty, equivocality, and platform strategy. Decis Sci 36:97–133
Kuei C, Madu CN, Lin C (2001) The relationship between supply
chain quality management practices and organizational performance. Int J Qual Reliab Manage 18:864–872
Kuei C, Madu CN, Lin C, Chow WS (2002) Developing supply
chain strategies based on the survey of supply chain quality
and technology management. Int J Qual Reliab Manage
19:889–901
Lai K, Cheng TCE, Yeung ACL (2005) Relationship stability and
supplier commitment to quality. Int J Prod Econ 96: 397–410
Levy P (1998) Total quality management in the supply chain. In:
Madu CN (ed) Handbook of TQM. Kluwer, London, pp 275–
303
Li SH, Ragu-Nathan B, Ragu-Nathan TS, Rao SS (2006) The impact
of supply chain management practices on competitive advantage
and organizational performance. Omega 34:107–124
31
Lin C, Chow WS, Madu CN, Kuei C, Yu PP (2005) A structural
equation model of supply chain quality management and organizational performance. Int J Prod Econ 96:355–365
Long JS (1983) Confirmatory factor analysis. Sage Publications,
Newbury Park, p 75
Park S, Hartley JL, Wilson D (2001) Quality management practices
and their relationship to buyer’s supplier ratings: a study in the
Korean automotive industry. J Oper Manage 19:695–712
Powell TC (1995) Total quality management as competitive advantage:
a review and empirical study. Strateg Manage J 16:15–37
Robinson C, Malhotra M (2005) Defining the concept of supply chain
quality management and its relevance to academic and industrial
practice. Int J Prod Econ 96:315–325
Romano P, Vinelli A (2001) Quality management in a supply chain
perspective: strategic and operative choices in a textile-apparel
network. Int J Oper Prod Manage 21:446–460
Ross DF (1998) Competing through Supply Chain Management.
Chapman & Hall, New York
Rungtusanatham M, Salvador F, Forza C, Choi TY (2003) Supplychain linkages and operational performance: a resource-based
perspective. Int J Oper Prod Manage 23:1084–1099
Salvador F, Forza C, Rungtusanatham M, Choi TY (2001) Supply
chain interactions and time-related performances, an operations
management perspective. Int J Oper Prod Manage 21:461–475
Samson D, Terziovski M (1999) The relationship between total quality
management practices and operational performance. J Oper
Manage 17:393–409
Saraph JV, Benson PG, Schroeder RG (1989) An instrument for
measuring the critical factors of quality management. Decis Sci
20:810–829
Schonberger RJ (2007) Japanese production management: an evolution
– with mixed success. J Oper Manage 25:403–419
Schroeder RG, Flynn BB (2001) High performance manufacturing:
global perspectives. Wiley, New York
Shin H, Collier DA, Wilson DD (2000) Supply management orientation and supplier/buyer performance. J Oper Manage 18:317–333
Sila I, Ebrahimpour M, Birkholz C (2006) Quality in supply chains: an
empirical analysis. Suppl Chain Manage Int J 11:491–502
Snell SA, Dean JW Jr (1992) Integrated manufacturing and human
resource management: a human capital perspective. Acad Manag
J 35:467–504
Tan KC, Handfield RB, Krause DR (1998) Enhancing the firm’s
performance through quality and supply base management: an
empirical study. Int J Prod Res 36:2813–2837
Tan KC, Kannan VR, Handfield RB, Ghosh S (1999) Supply chain
management: an empirical study of its impact on performance. Int
J Oper Prod Manage 19:1034–1052
Tracey M, Tan CL (2001) Empirical analysis of supplier selection and
involvement, customer satisfaction, and firm performance. Suppl
Chain Manage Int J 6:174–188
Trent RJ, Monczka RM (1999) Achieving world-class supplier quality.
Total Qual Manage 10:927–938