DSpace at VNU: A phylogeny of softshell turtles (Testudines: Trionychidae) with reference to the taxonomic status of the critically endangered, giant softshell turtle, Rafetus swinhoei
Bạn đang xem bản rút gọn của tài liệu. Xem và tải ngay bản đầy đủ của tài liệu tại đây (1.19 MB, 15 trang )
Org Divers Evol
DOI 10.1007/s13127-014-0169-3
ORIGINAL ARTICLE
A phylogeny of softshell turtles (Testudines: Trionychidae)
with reference to the taxonomic status of the critically endangered,
giant softshell turtle, Rafetus swinhoei
Minh Le & Ha T. Duong & Long D. Dinh &
Truong Q. Nguyen & Peter C. H. Pritchard &
Timothy McCormack
Received: 18 July 2013 / Accepted: 12 February 2014
# Gesellschaft für Biologische Systematik 2014
Abstract Several important aspects of the evolution of
the softshell turtle (family Trionychidae) have not been
addressed thoroughly in previous studies, including the
pattern and timing of diversification of major clades and
species boundaries of the critically endangered Shanghai
Softshell Turtle, Rafetus swinhoei. To address these
issues, we analyzed data from two mitochondrial loci
(cytochrome b and ND4) and one nuclear intron (R35)
for all species of trionychid turtles, except Pelochelys
signifera, and for all known populations of Rafetus
swinhoei in Vietnam and one from China. Phylogenetic
analyses using three methods (maximum parsimony,
maximum likelihood, and Bayesian inference) produce
a well resolved and strongly supported phylogeny. The
results of our time-calibration and biogeographic optimization analyses show that trionychid dispersals out of
Asia took place between 45 and 49 million years ago in
the Eocene. Interestingly, the accelerated rates of diversification and dispersal within the family correspond
surprisingly well to global warming periods between
the mid Paleocene and the early Oligocene and from
the end of the Oligocene to the mid Miocene. Our study
also indicates that there is no significant genetic divergence among monophyletic populations of Rafetus
swinhoei, and that previous taxonomic revision of this
species is unwarranted.
Electronic supplementary material The online version of this article
(doi:10.1007/s13127-014-0169-3) contains supplementary material,
which is available to authorized users.
M. Le (*)
Department of Environmental Ecology, Faculty of Environmental
Science, Hanoi University of Science, VNU, 334 Nguyen Trai
RoadThanh Xuan District Hanoi, Vietnam
e-mail:
M. Le
Centre for Natural Resources and Environmental Studies, VNU, 19
Le Thanh Tong Street, Hanoi, Vietnam
T. Q. Nguyen
Department of Terrestrial Ecology, Cologne Biocenter, University of
Cologne, Zülpicher Strasse 47b, 50674 Cologne, Germany
P. C. H. Pritchard
Chelonian Research Institute, 402 South Central Avenue, Oviedo,
FL 32765, USA
M. Le
Department of Herpetology, Division of Vertebrate Zoology,
American Museum of Natural History, New York, NY 10024, USA
H. T. Duong : L. D. Dinh
Department of Genetics, Faculty of Biology, Hanoi University of
Science, VNU, 334 Nguyen Trai RoadThanh Xuan District Hanoi,
Vietnam
T. Q. Nguyen
Institute of Ecology and Biological Resources, Vietnam Academy of
Science and Technology, 18 Hoang Quoc Viet, Hanoi, Vietnam
T. McCormack
Asian Turtle Program, Cleveland Metroparks Zoo, No. 1302 Thanh
Cong Building, 57 Lang Ha Street, Hanoi, Vietnam
Present Address:
L. D. Dinh
Department of Fundamental Sciences, VNU-School of Medicine and
Pharmacy, 144 Xuan Thuy RoadCau Giay District Hanoi, Vietnam
M. Le et al.
Keywords Trionychidae . Rafetus swinhoei . Systematics .
Evolution . Africa . Asia . Europe . North America . ND4 .
cytb . R35
Introduction
Softshell turtles of the family Trionychidae are characterized by
highly derived morphological characters, which have evolved
to adapt to an almost entirely aquatic environment. These
special features include smooth leathery skin covering reduced
bony shell, flattened body shape, and webbed toes (Meylan
1987; Ernst and Barbour 1989). Trionychid turtles, consisting
of 31 species and 13 genera (Van Dijk et al. 2012), are distributed widely, occurring in Africa, Asia (including New Guinea),
the Mediterranean, and North America (Iverson 1992). Fossil
records documented in Australia, Europe, and South America
(Wood and Patterson 1973; Gaffney and Bartholomai 1979;
Danilov 2005; Head et al. 2006; Scheyer et al. 2012) indicate
that, historically, the group was even more widespread.
Since the first computer-aided analysis of trionychid phylogenetic relationships using morphological data (Meylan 1987),
many subsequent works have selected molecular data, both
mitochondrial and nuclear markers, as a means to address
phylogenetic relationships among different species of the family (Weisrock and Janzen 2000; Engstrom et al. 2002, 2004;
Praschag et al. 2007; McGaugh et al. 2008). As a result, a fairly
well resolved and robust molecular phylogeny of trionychids
has been established, e.g., Engstrom et al. (2004). In addition,
species boundaries within a number of widely distributed species or species complexes have been clarified (Weisrock and
Janzen 2000; Engstrom et al. 2002; Praschag et al. 2007;
McGaugh et al. 2008; Fritz et al. 2010; Praschag et al. 2011;
Stuckas and Fritz 2011; Yang et al. 2011).
However, to date the taxonomic status of the critically
endangered Shanghai Softshell Turtle, Rafetus swinhoei, is
still a matter of debate (Le and Pritchard 2009; Le et al.
2010; Farkas et al. 2011). Ranked as one of 100 most endangered species in the world, only four live individuals of this
species are recognized globally: two in Vietnam and two in
China (Baillie and Butcher 2012). A captive breeding program has been launched in the Suzhou Zoo, China, for the two
individuals residing in China. Nonetheless, these efforts have
been unsuccessful in producing offspring, apparently due to
the age of the male (Kuchling 2012). To improve the probability of success, the captive breeding program needs to include additional individuals of this species from other populations. It is therefore critical to assess the taxonomic status of
populations within its range.
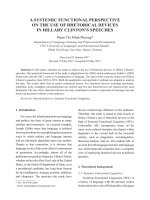
Historically, this species had a large distribution range,
including the Yellow River, Yangtze River, and their tributaries in China and the Red River system, as well as Ma River
and associated wetlands in Vietnam (Fig. 1). After a long
period of overexploitation, most populations in China and in
Vietnam appear to be extinct (Pritchard 2001; Le and
Pritchard 2009; Wang and Shi 2011). Taxonomically, although previous molecular and morphological comparisons
show that this is a single species (Le and Pritchard 2009;
Farkas et al. 2011), Le et al. (2010) produced radically different results, and described populations in Vietnam as a new
species, R. vietnamensis. Farkas et al. (2011) shed doubt on
the analyses of Le et al. (2010) by highlighting sources of
potential errors. Despite this, it is likely that populations from
Vietnam and China constitute independent evolutionary lineages given the distance and river systems separating them
(Fig. 1). To test this hypothesis, we employed a phylogenetic
approach, and used the phylogenetic species concept as an
operational definition.
Moreover, the diversification pattern of this interesting
group has not been addressed adequately in previous studies.
Because the most primitive fossils have been found in Asia,
the continent has been widely regarded as the ancestral area of
the group (Hirayama et al. 2000; Joyce and Lyson 2010;
Scheyer et al. 2012). However, the timing and pattern of
dispersal events out of Asia to other continents, including
the Americas, Europe, and Africa, have not been investigated
comprehensively. In particular, a time-calibrated phylogeny in
combination with explicit biogeographic optimizations, which
can be used to test different diversification scenarios of the
family, was lacking in earlier efforts.
To resolve these issues, we reconstructed a phylogeny for
all softshell turtle species, except Pelochelys signifera, using
two mitochondrial genes (cytochrome b and NADH dehydrogenase subunit 4 - ND4) and a nuclear intron, G proteincoupled receptor R35 (R35), and multiple outgroups, Caretta
caretta, Carettochelys insculpta, and Pelomedusa subrufa.
Samples from all known populations of Rafetus swinhoei in
Vietnam, and from living individuals in China were also
included in the analyses. We calibrated time divergence of
the phylogeny using the Bayesian relaxed clock method, and
optimized biogeographic patterns using the statistical
dispersal-vicariance (S-DIVA) and Bayesian Binary MCMC
(BBM) methods to infer the historical diversification of this
turtle group.
Materials and methods
Taxonomic sampling
For Rafetus swinhoei, we sequenced four new samples, including fresh tissue from the individual in Hoan Kiem Lake
located in downtown Hanoi and three bone samples from Ba
Vi Town near Hanoi and from Yen Bai and Phu Tho Provinces, northern Vietnam. These three bone samples are relatively young, ranging from 12 to just over 20 years old. We
A phylogeny of softshell turtles (Testudines: Trionychidae)
Fig. 1 River systems where
Rafetus swinhoei has been
recorded. Locations of the type
specimen and Vietnam’s samples
used in this study are shown in
yellow and red, respectively
also added published data from the individual inhabiting Dong
Mo Lake in the suburb of Hanoi (Le and Pritchard 2009), from
samples collected in Ba Vi Town, Hoan Kiem Lake, and
Thanh Hoa Province (Le et al. 2010), and from Chinese
samples (Table 1). Since the sequences of the Chinese samples
are virtually identical, we used sequences from one only
representative in our phylogenetic analyses. We also included
all species of the family Trionychidae, except Pelochelys
signifera, for which neither data nor sample was available.
Three species, Caretta caretta, Carettochelys insculpta, and
Pelomedusa subrufa, were used to provide outgroup polarity.
Molecular data
Both mitochondrial and nuclear DNA were utilized to resolve
relationships of the family Trionychidae. We sequenced two
mitochondrial genes, complete cytochrome b and partial ND4,
and one nuclear intron, R35, for samples of Rafetus swinhoei.
An additional ten cytochrome b and ND4 sequences of this
species were obtained from GenBank. Other sequences from
remaining softshell species, except Pelochelys signifera, and
three outgroup taxa were compiled from previous studies,
most notably from Engstrom et al. (2004). A complete list of
all sequences is provided in Table 1.
DNA extraction and PCR set-up were carried out in a clean
room using a BioHazard Safety Cabinet (Daihan Labtech,
Batam, Indonesia). Each sample was extracted independently.
Bone samples were first cleaned with 10 % chlorox and then
placed on a clean surface to dry in order to eliminate the risk of
contamination on the surface of the samples. Bone or tissue
samples were then extracted following protocols specified in
Le et al. (2007) using a DNeasy blood and tissue kit (Qiagen,
Valencia, CA). For the incubation step, the lysis usually took
up to 72 h for the bone samples to be digested completely.
During this step, the extraction was checked every 24 h to
monitor the progress. A 20 μl increment of proteinase K was
added to each extraction every 24 h. A negative control was
used in every extraction.
Extracted DNA from bones was amplified by HotStar Taq
mastermix (Qiagen). The PCR volume consisted of 21 μl
(10 μl mastermix, 5 μl water, 2 μl of each primer at 10
pmol/μl and 2 μl DNA or higher depending on the quantity
of DNA in the final extraction solution). PCR conditions
were: 95 °C for 15 min to active HotStar Taq; 40 cycles at
95 °C for 30 s, 45 °C for 45 s, 72 °C for 60 s; and a final
extension at 72 °C for 6 min. In some cases, the PCR product
was used as a template for the new PCR reactions. We
designed seven new internal cytochrome b primers to
optimize the amplification of difficult samples (Table 2).
After removing the primers, the cytochrome b fragments, which overlapped by 53–86 bps, were 217–
479 bps in length. The final sequences were 1,056 bps
in length. Negative controls were used in all amplifications to check for possible contamination.
M. Le et al.
Table 1 GenBank accession numbers of samples used in this study
Species names
GenBank no. (ND4)
GenBank no. (cytb)
GenBank no. (R35)
Reference
Amyda cartilaginea
Apalone ferox
Apalone mutica
Apalone spinifera aspera
Apalone spinifera emoryi
Caretta caretta
AY259550
AY259605
AY259606
AY259599
AY259608
NC_016923
AY259600
AY259555
AY259556
AY259549
AY259558
NC_016923
AY259575
AY259580
AY259581
AY259582
AY259583
FJ009031
Carettochelys insculpta
Chitra chitra
Chitra indica
Chitra vandijki
Cyclanorbis elegans
Cyclanorbis senegalensis
Cycloderma aubryi
Cycloderma frenatum
Dogania subplana
Lissemys ceylonensis
Lissemys punctata
Lissemys scutata
Nilssonia gangeticus
Nilssonia formosa
Nilssonia hurum
Nilssonia leithii
AY259596
AF414366
AF494492
AF414367
AY259615
AY259614
AY259611
AY259610
AY259601
FR850599
AY259613
AY259612
AY259599
AY259597
AY259598
HE801721
AY259546
AY259562
AY259561
AY259563
AY259570
AY259569
AY259566
AY259565
AY259551
FR850649
AY259568
AY259567
AY259549
AY259547
AY259548
AM495225
AY259571
AY259587
AY259586
AY259588
AY259595
AY259594
AY259591
AY259590
AY259576
–
AY259593
AY259592
AY259574
AY259572
AY259573
HE801894
Nilssonia nigricans
HE801733
AM495237
HE801901
Palea steindachneri
Pelochelys bibroni
Pelochelys cantorii
AY259602
AF414361
AF414360
AY259552
AY259559
AY259560
AY259577
AY259584
AY259585
Engstrom et al. 2004
Engstrom et al. 2004
Engstrom et al. 2004
Engstrom et al. 2004
Engstrom et al. 2004
Naro-Maciel et al. 2008;
Drosopoulou et al. 2012
Engstrom et al. 2004
Engstrom et al. 2002, 2004
Engstrom et al. 2002, 2004
Engstrom et al. 2002, 2004
Engstrom et al. 2004
Engstrom et al. 2004
Engstrom et al. 2004
Engstrom et al. 2004
Engstrom et al. 2004
Praschag et al. 2011
Engstrom et al. 2004
Engstrom et al. 2004
Engstrom et al. 2004
Engstrom et al. 2004
Engstrom et al. 2004
Praschag et al. 2007;
Liebing et al. 2012
Praschag et al. 2007;
Liebing et al. 2012
Engstrom et al. 2004
Engstrom et al. 2002, 2004
Engstrom et al. 2002, 2004
Pelodiscus axenaria
Pelodiscus maackii
HQ116587
FM999019
HQ116595
FM999011
–
HE801911
Pelodiscus parviformis
Pelodiscus sinensis
Pelomedusa subrufa
Rafetus euphraticus
R. swinhoei Dong Mo
R. swinhoei BaVi LTBa
R. swinhoei Hoan Kiem LTB
R. swinhoei Thanh Hoa LTB
R. swinhoei China
HQ116590
FM999022
FN645328
AY259604
KJ482683
AJ608766
AJ608765
AJ608764
HQ709384
HQ116598
FM999014
FN645269
AY259554
KJ482678
AJ607408
AJ608763
AJ607407
HQ709384
–
–
FN645408
AY259579
KJ482685
–
–
–
–
Yang et al. 2011
Fritz et al. 2010;
Liebing et al. 2012
Yang et al. 2011
Fritz et al. 2010
Fritz et al. 2011
Engstrom et al. 2004
Le and Prichard 2009
Le et al. 2010
Le et al. 2010
Le et al. 2010
GenBank
R. swinhoei China
R. swinhoei Ba Vi
R. swinhoei Hoan Kiem
R. swinhoei Phu Tho
R. swinhoei Yen Bai
Trionyx triunguis
NC017901
KJ482682
KJ482684
–
–
AY259609
NC017901
KJ482677
KJ482679
KJ482680
KJ482681
AY259564
–
–
KJ482686
–
–
AY259589
GenBank
This study
This study
This study
This study
Engstrom et al. 2004
aLTB indicates sample from Le et al. (2010)
A phylogeny of softshell turtles (Testudines: Trionychidae)
Table 2 Primers used in this
study
Primer
Sequence
Reference
Gludg (f)
CB3 (r)
CB534 (f)
Tcytbthr (r)
C1 (r)
5′- TGACTTGAARAACCAYCGTTG - 3′
5′- GGCAAATAGGAAATATCATTC - 3′
5′- GACAATGCAACCCTAACACG- 3′
5′- TTCTTTGGTTTACAAGACC - 3′
5′- GTGAGTAGTGTATAGCTAGGAAT - 3′
Palumbi 1996
Palumbi 1996
Engstrom et al. 2004
Engstrom et al. 2004
This study
C2 (f)
C3 (r)
C4 (f)
C5 (r)
C6 (f)
C7 (r)
ND4 672 (f)
Hist (r)
R35Ex1 (f)
R35Ex2 (r)
5′- CCATTTGATGAAACTTTGGAT - 3′
5′- CGTAATATAGGCCTCGTCCGAT - 3′
5′- CCTCACTATTCTTCATATGCA - 3′
5′- CTAGGATTATGAATGGTAATA - 3′
5′- CTACTACTATCAATCGCCATA - 3′
5′- GGTCTCCTAGTAGGTTGGGGTA - 3′
5′- TGACTACCAAAAGCTCATGTAGAAGC - 3′
5′- CCTATTTTTAGAGCCACAGTCTAATG - 3′
5′- ACGATTCTCGCTGATTCTTGC - 3′
5′- GCAGAAAACTGAATGTCTCAAAGG - 3′
This study
This study
This study
This study
This study
This study
Engstrom et al. 2002
Arévalo et al. 1994
Fujita et al. 2004
Fujita et al. 2004
Extracted DNA from the fresh tissue was amplified by
PCR mastermix (Fermentas, Burlington, ON, Canada) using
the same conditions as for HotStar Taq, except that the activation step was set to 5 min. PCR products were subjected to
electrophoresis through a 1 % agarose gel (UltraPure™,
Invitrogen, La Jolla, CA). Gels were stained for 10 min in 1
X TBE buffer with 2 pg/ml ethidium-bromide, and visualized
under UV light. Successful amplifications were purified to
eliminate PCR components using a GeneJET™ PCR Purification kit (Fermentas). Purified PCR products were sent to
Macrogen (Seoul, South Korea) for sequencing. All primers
used in this study, including seven newly designed ones, are
shown in Table 2.
Phylogenetic analyses
The sequences were aligned in BioEdit v7.1.3 (Hall 1999)
with default settings. Data were analyzed using maximum
parsimony (MP) and maximum likelihood (ML) as implemented in PAUP 4.0b10 (Swofford 2001) and Bayesian analysis as implemented in MrBayes 3.2.1 (Ronquist et al. 2012).
For MP analysis, heuristic analysis was conducted with 100
random taxon addition replicates using tree-bisection and
reconnection (TBR) branch swapping algorithm, with no upper limit set for the maximum number of trees saved. Bootstrap support (Felsenstein 1985) was calculated using 1,000
pseudo-replicates and 100 random taxon addition replicates.
All character were equally weighted and unordered.
For ML analysis, the optimal model for nucleotide evolution was determined using Modeltest 3.7 (Posada and
Crandall 1998). Analysis was conducted with stepwiseaddition starting tree, heuristic searches with simple taxon
addition and the TBR branch swapping algorithm. Support
for the likelihood hypothesis was evaluated by bootstrap
analysis with 100 pseudo-replications and simple taxon addition. We regard bootstrap values of ≥ 70 % as strong support
and values of < 70 % as weak support (Hillis and Bull 1993).
For Bayesian analyses, we used the optimal model determined by Modeltest with parameters estimated by MrBayes
3.2.1. Two simultaneous analyses with four Markov chains
(one cold and three heated) were run for 10 million generations with a random starting tree and sampled every 1,000
generations. Log-likelihood scores of sample points were
plotted against generation time to determine stationarity of
Markov chains. Trees generated before log-likelihood scores
reached stationarity were discarded from the final analyses
using the burn-in function. Two independent analyses were
run simultaneously. The posterior probability values for all
clades in the final majority rule consensus tree are provided.
We ran analyses using both combined and partitioned
datasets to examine the robustness of the tree topology
(Nylander et al. 2004; Brandley et al. 2005). In the
mixed model analysis, we partitioned the data into seven sets, including R35 and the other six based on gene
codon positions (first, second, and third) of the two
mitochondrial markers, cytb and ND4. Optimal models
of molecular evolution for the partitions were calculated
using Modeltest, and then assigned to these partitions in
MrBayes 3.2 using the command APPLYTO. Model
parameters were inferred independently for each data
partition using the UNLINK command.
We also constructed a statistical parsimony haplotype network using the program TCS 1.21 (Clement et al. 2000) for
the cytb and ND4 data of Rafetus swinhoei, based on a 95 %
connection limit. TCS computes the number of mutational steps among all haplotypes, and groups the most
closely related haplotypes into a network with the combined probability of more than 95 % (Templeton et al.
M. Le et al.
Table 3 Uncorrected (“p”) distance matrix showing percentage
pairwise genetic divergence (cytochrome b and ND4) between
individuals of Rafetus swinhoei
Species name
1
2
3
4
R.s Dong Mo
R.s Hoan Kiem
R.s Ba Vi
R.s Yen Bai
R.s Phu Tho
–
0.11
0.00
0.30
0.18
–
011
0.00
0.00
–
0.30
0.18
–
0.00
–
R.s Thanh Hoa LTB
R.s Ba Vi LTB
R.s Hoan Kiem LTB
R.s China
0.38
0.29
0.27
0.11
0.29
0.39
0.36
0.00
0.38
0.29
0.27
0.11
0.00
0.31
0.31
0.00
0.00
0.40
0.21
0.00
1992). Uncorrected pairwise divergence was calculated
in PAUP*4.0b10 (Table 3).
Biogeographic optimizations
Ancestral areas of extant trionychid turtles were recovered
using both the Statistical Dispersal-Vicariance Analysis (SDIVA) and the Bayesian Binary Method (BBM) as implemented in the program RASP (Reconstruct Ancestral State in
Phylogenies) (Yu et al. 2011). Cladograms generated from the
program BEAST were used as the input data for both S-DIVA
and BBM optimizations. As this analysis aimed to determine
the pattern of dispersal out of Asia in this group, we designated four geographic areas corresponding to four continents, i.e.,
Africa, the Americas, Asia, and Australia. The maximum
number of ancestral areas for reconstruction was set to two
in both S-DIVA and BBM.
5
6
7
8
9
–
0.60
0.65
0.29
–
0.40
0.39
–
0.36
–
Process, as the setting is recommended for a species-level
phylogeny by the program manual. We also ran the dataset
using Birth Death Process as the Tree Prior to assess the
robustness of our results. The combined and non-partitioned
dataset was used for a single run. In addition, a random tree was
employed as a starting tree. For this analysis, the chain length
was set to 10×106, and the Markov chain was sampled every
1,000 generations. After the dataset with the above settings was
analyzed in BEAST, the resulting likelihood profile was then
examined by the program Tracer v1.5 to determine the burn-in
cutoff point. The final tree with calibration estimates was computed using the program TreeAnnotator v1.7.2 as recommended in the program manual. To estimate the diversification rate of
the family, a lineage-through-time plot was generated using the
program TreeSim v.1.9 (Stadler 2011) in R. The calibrated
cladogram produced by BEAST was used as the input data
for the program TreeSim.
Divergence-time analysis
Results
We selected the relaxed-clock method (Drummond et al.
2006) to estimate divergence times. The concatenated dataset
of three genes, cytochrome b, ND4 and R35, was used as input
for the computer program BEAST v1.7.2 (Drummond and
Rambaut 2007). Priori criteria for the analysis were set by the
program BEAUti v1.7.2. One calibration point, the fossil
taxon “Trionyx” kyrgyzensis (Nessov 1995), was used to calibrate the phylogeny. This taxon, which was dated to the earlymiddle Albian, has been considered the earliest fossil record
of the family (Danilov and Vitek 2013). Other fossil records,
which can be used as calibration points for the phylogeny,
could not be identified with high confidence. We constrained
the first node of the family Trionychidae to 109 million years
ago (MYA), with a 95 % confidence interval running from 98
to 120 MYA.
A GTR model using gamma + invariant sites with four
gamma categories was used along with the assumption of a
relaxed molecular clock. As for priors, we used all default
settings, except that the Tree Prior category was set to Yule
Phylogenetic analyses
Four samples of Rafetus swinhoei in Vietnam were sequenced
successfully. We were unable to amplify the nuclear gene R35
for bone materials as well as ND4 for the samples collected in
Yen Bai and Phu Tho Provinces (Table 1). The final matrix
consisted of 30 trionychid species, including samples from six
populations of R. swinhoei in Vietnam and one in China, and
three outgroups with 2,933 aligned characters (cytochrome b:
1,140 characters, ND4: 732 characters, R35: 1,061 characters).
We ran the maximum likelihood (ML) and single-model
Bayesian analyses based on the combined matrix using the
GTR+G+I model of molecular evolution as selected by the
ModelTest. The parameters calculated by the AIC criterion
were: base frequency A=0.34420, C=0.29450, G=0.13380,
T=0.22750; proportion of invariable sites (I) = 0.21; gamma
distribution shape parameter (G) = 0.4664. For the ML analysis,
a single tree was generated with the total number of attempted
A phylogeny of softshell turtles (Testudines: Trionychidae)
rearrangements of 11,060, and the score of the best tree recovered was 26,058.37389. In the single-model Bayesian analysis,
lnL scores reached equilibrium after 13,000 generations, while
in the mixed-model Bayesian analysis lnL scores attained stationarity after 14,000 generations in both runs.
Tree topologies obtained from the Bayesian and ML analyses are identical, except for the positions of Pelodiscus
sinensis and P. parviformis. The two species were shown to
be sister taxa in the Bayesian analyses with poor support
[posterior probabilities (PP) = 58 and 76], but became unresolved in both ML and maximum parsimony (MP) analyses.
Both Bayesian and ML’s cladograms differ from that of the
MP analysis in the placement of Cyclanorbis elegans, which
was recovered as a sister taxon to C. aubryi and C. frenatum in
the latter analysis. In addition, Nilssonia formosa became
unresolved in all analyses, but was weakly supported as a
sister taxon to N. hurum and N. nigricans in the combined
Bayesian analysis (Fig. 2). Support values are generally very
high in Bayesian and ML analyses. In addition to uncertain
placements of Pelodiscus sinensis and Nilssonia formosa,
only the position of Apalone ferox received a low support
value (PP=93 %) from the combined Bayesian analysis. The
MP analysis produced seven poorly corroborated nodes with
bootstrap values<70 % (Fig. 2).
We ran separate MP and ML analyses for the genus Rafetus
as missing data from the samples of Rafetus swinhoei made it
impossible to analyze all terminals together. Terminals within
Rafetus swinhoei were poorly resolved, with one node was
weakly supported by both analyses (supplementary data).
Nonetheless, different clusters were favored by combined
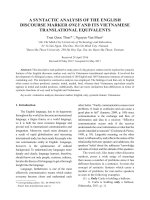
and partitioned Bayesian analyses with high PP values (supplementary data). In the parsimony haplotype network analysis, six groups were reconstructed (Fig. 3). These groups differ
from each other by at most five mutational steps, between B3
(Hoan Kiem LTB) and B2 (Ba Vi LTB). Uncorrected pairwise
distances show insignificant genetic divergence (a maximum
of 0.65 %) between the samples of R. swinhoei (Table 3).
Biogeographic optimizations
Both BBM and S-DIVA analyses supported Asia as the ancestral area of living members of the family (Fig. 4a,b). BBM
Carettochelys insculpta
Pelomedusa subrufa
Caretta caretta
Lissemys scutata
Lissemys punctata
Lissemys ceylonensis
Cyclanorbis elegans
Cyclanorbis senegalensis
Cycloderma aubryi
Cycloderma frenatum
MP/ML
BC/BP
Trionyx triunguis
Pelochelys bibroni
Pelochelys cantorii
Chitra indica
Chitra chitra
Chitra vandijki
Pelodiscus axearia
Pelodiscus maackii
Pelodiscus sinensis
Pelodiscus parviformis
Palea steindachneri
Dogania subplana
Amyda cartilaginea
Nilssonia gangeticus
Nilssonia leithii
Nilssonia formosa
Nilssonia hurum
Nilssonia nigricans
Apalone mutica
Apalone ferox
Apalone spinifera aspera
Apalone spinifera emoryi
Rafetus euphraticus
Rafetus swinhoei Ba Vi_LTB
Rafetus swinhoei Hoan Kiem LTB
Rafetus swinhoei Dong Mo
Rafetus swinhoei Ba Vi
Rafetus swinhoei Hoan Kiem
Rafetus swinhoei Yen Bai
Rafetus swinhoei Thanh Hoa_LTB
Rafetus swinhoei Phu Tho
Rafetus swinhoei China
Fig. 2 Cladogram generated from maximum parsimony (MP), maximum likelihood (ML), and Bayesian analyses of combined mitochondrial
and nuclear genes with branch length estimated by the Bayesian analyses.
Numbers above branches are MP and ML bootstrap values, respectively.
Numbers below branches are Bayesian single-model and mixed-model
posterior probability (PP) values, respectively. Asterisk indicates 100 %
value. The MP analysis produced two most parsimonious trees (TL=
5030, CI=0.43, RI=0.58). Of 2,945 aligned characters, 1,464 were
constant, and 1,079 parsimony informative. LTB Samples used in Le
et al. (2010)
M. Le et al.
reconstruction also recovered Asia as the ancestral area for
four major clades, i.e., the Trionychidae, Rafetus + Apalone,
Trionyx + Chitra + Pelochelys, and Lissemys + Cyclanorbis +
Cycloderma with very high support levels of 96.52 %,
95.84 %, 93 %, and 93.53 %, respectively (Fig. 4a and
supplementary data). Results from the S-DIVA analysis
showed that the probability of Asia being the ancestral area
of the family is 100 %. In addition, the ancestral area of
Trionyx + Chitra + Pelochelys is Asia, Rafetus + Apalone is
Asia and America, and Lissemys + Cyclanorbis + Cycloderma
is Asia and Africa with support values of 100 % (Fig. 4b and
supplementary data).
Cretaceous, speciation events of the extant clades did not
occur until around the middle Paleocene (about 60 MYA).
The African genus Cyclanorbis + Cycloderma split from the
Asian genus Lissemys about 49 MYA (CI=34.8–63.9), and
the American genus Apalone diverged from the Asian genus
Rafetus about 45 MYA (CI=28.9–58.6). Similarly, Trionyx
speciated from Pelochelys + Chitra about 45 MYA (CI=30.1–
63.2). All speciation events within each genus occurred over
the last 30 million years.
Discussion
Phylogenetic analyses
Time-divergence analysis
After 1,000 initial trees were discarded from the analysis by
the program Tracer v1.5, final divergence times were generated using the program TreeAnnotator v1.7.2. The estimates
obtained from the Tree Prior setting of Birth Death Process
(supplementary data) are very similar to those from Yule
Process. We therefore opted to use data generated from the
Yule Process setting. Age estimates and 95 % confidence
interval for all nodes marked in Fig. 5a are shown in Table 4.
Although the family fossil records first appeared in the early
A2
A3
A1
B1
B2
B3
Fig. 3 Parsimony network obtained from TCS v1.21 for Cytb and ND4
data of Rafetus swinhoei samples, based on a 95 % connection limit. Gaps
were treated as fifth state. Symbol size corresponds to haplotype frequency. Each node represents one mutational step. Haplotype frequency: A1=
3, A2=2, B1=2 and all other haplotypes n=1. A1 Hoan Kiem, Yen Bai,
Phu Tho. A2 China. A3 Thanh Hoa (LTB). B1 Dong Mo, Ba Vi. B2 Ba Vi
(LTB). B3 Hoan Kiem (LTB)
The phylogenetic relationships of the outgroup taxa are somewhat unusual, especially considering the non-monophyly of
Trionychia and Cryptodira, although both of them have been
recovered in previous studies (Krenz et al. 2005; Barley et al.
2010). The sets of relationships should be considered inconclusive since the dataset does not have enough informative
nuclear markers to resolve the deep nodes. Nonetheless, the
phylogeny of trionychids based on mitochondrial and nuclear
data and rooted using three outgroups is robust and well
resolved. Our results in general agree with those from
Engstrom et al. (2004), with significantly higher support in
some nodes, especially those within the genus Nilssonia and
the monophyly of the genera Cyclanorbis + Cycloderma.
Furthermore, the position of Apalone ferox is strongly corroborated in our ML and partitioned Bayesian analyses (BP=
73 %, PP=96 %), but is weakly supported by the ML and
Bayesian analyses in Engstrom et al. (2004) (BP=69 %, PP=
76 %). In the latter study, the positions of A. ferox and
A. mutica are interchanged with strong support (BP=70 %,
PP=100 %) in the MP and Bayesian analyses, which included
morphological data. This suggests that support for the relationships come exclusively from morphology.
The most problematic nodes are the placements of
Nilssonia formosa and Pelodiscus sinensis, which are
weakly corroborated by all four analyses. For the former, low support level likely results from the availability of informative characters for resolving this difficult
node, as a recent study (Liebing et al. 2012) was able
to recover N. formosa as a sister taxon to all other
species in the genus with strong support by using more
data. The same placement of P. sinensis is also weakly
supported by the previous analyses (Stuckas and Fritz
2011). Adding more data from both mitochondrial and
nuclear genes might help resolve this node with a
higher level of confidence. Other nodes of the phylogeny are supported strongly by at least two analyses
(Fig. 2). It is evident from our results that there is no
significant genetic divergence between any populations
A phylogeny of softshell turtles (Testudines: Trionychidae)
BBM
(A) Lissemys ceylonensis
(A) Lissemys punctata
(A) Lissemys scutata
(B) Cycloderma frenatum
(B) Cycloderma aubryi
(B) Cyclanorbis elegans
(B) Cyclanorbis senegalensis
(A) Rafetus swinhoei
(A) Rafetus euphraticus
(C) Apalone ferox
(C) Apalone spinifera emoryi
(C) Apalone spinifera aspera
(C) Apalone mutica
(A) Pelodiscus maackii
(A) Pelodiscus sinensis
(A) Pelodiscus parviformis
(A) Pelodiscus axenaria
(A) Dogania subplana
Asia
(A) Nilssonia leithii
(A) Nissonia gangeticus
(A) Nilssonia formosa
(A) Nilssonia nigricans
(A) Nilssonia hurum
Asia and Africa
Asia and America
Asia and Australia
(A) Amyda cartilaginea
(A) Palea steindachneri
(AB) Trionyx triunguis
(A) Pelochelys bibroni
(A) Pelochelys cantorii
Africa
Africa and America
America
(A) Chitra vandijki
(A) Chitra chitra
(A) Chitra indica
(AD) Carettochelys insculpta
Fig. 4 Biogeographic optimizations based on the trionychid phylogeny
using the program RASP (Reconstruct Ancestral State in Phylogenies). a Results from the Bayesian binary method (BBM). b Results from
S-DIVA analysis. Each node is labeled with a number, which can be used
to check statistical details in the supplementary data
of Rafetus swinhoei in Vietnam and China. The highest
pairwise divergence of only 0.65 % is found between sequences generated by Le et al. (2010) (Table 3). This level
of intra-specific divergence is significantly lower than that of
the widely distributed Apalone spinifera, i.e., up to more than
8 % (Weisrock and Janzen 2000; McGaugh et al. 2008), but
comparable to the divergence level of other softshell turtle
species (Engstrom et al. 2002; Praschag et al. 2007; Gidis et al.
2011). In addition, the terminals in the reconstructed haplotype network are separated by a maximum of only five mutational steps (Fig. 3). It is also important to note that the
network of haplotypes does not reveal any geographic cluster,
and that highest divergences are derived from sequences in Le
et al. (2010) study. Similarly, our phylogenetic analyses suggest that there is no clear geographic aggregation of the
sampled populations. Although there is strong support for five
samples to form a monophyletic group from two Bayesian
analyses, different grouping receives low support from both
ML and MP analyses (supplementary data). All tests therefore
reject the null hypothesis that this taxon contains independently evolved lineages.
Low genetic diversity among different populations of
Rafetus swinhoei suggests that this large softshell species
radiated very recently. Very shallow genetic divergence is also
found among populations of Trionyx triunguis, a sizable softshell turtle with a broad distribution range extending from
Mediterranean to central Africa in highly disjunct river systems, e.g., Congo + Nile Rivers and Niger River (Gidis et al.
2011). It appears that the large riverine softshell turtles were
able to make long-distance dispersals through river corridors
or marine routes as they can inhabit estuaries and marine
habitats (Kasparek 2001) in a relative short period of
time. If the former hypothesis is confirmed, the current
separate river systems, where Rafetus swinhoei has been
found (Fig. 1), must have once connected to facilitate
the dispersals. Alternatively, the current distribution of
Rafetus swinhoei could be an artifact of humanmediated dispersals because China has had a long history of using turtles as food, medicine, and pets. However, we caution against over-speculation, as these hypotheses need to be tested using historical museum
samples from all localities within its range.
M. Le et al.
S-DiVA
(A) Lissemys ceylonensis
(A) Lissemys punctata
(A) Lissemys scutata
(B) Cycloderma frenatum
(B) Cycloderma aubryi
(B) Cyclanorbis elegans
(B) Cyclanorbis senegalensis
(A) Rafetus swinhoei
(A) Rafetus euphraticus
(C) Apalone ferox
(C) Apalone spinifera emoryi
(C) Apalone spinifera aspera
(C) Apalone mutica
(A) Pelodiscus maackii
(A) Pelodiscus sinensis
(A) Pelodiscus parviformis
(A) Pelodiscus axenaria
(A) Dogania subplana
(A) Nilssonia leithii
(A) Nissonia gangeticus
(A) Nilssonia formosa
(A) Nilssonia nigricans
Asia
Asia, Africa
Asia, America
(A) Nilssonia hurum
(A) Amyda cartilaginea
Asia, Australia
(A) Palea steindachneri
(AB) Trionyx triunguis
Africa
(A) Pelochelys bibroni
(A) Pelochelys cantorii
America
(A) Chitra vandijki
(A) Chitra chitra
(A) Chitra indica
(AD) Carettochelys insculpta
Fig. 4 (continued)
Biogeographic optimizations
The discrepancy between the results of S-DIVA and BBM
analyses is a consequence of assumptions underlying different
methods. While S-DIVA maximizes vicariance, and minimizes dispersal/extinction leading to a preference for larger
ancestral areas, BBM calculates the probability of each
area based on distribution of terminal taxa (Yu et al.
2011). As a result, BBM strongly supported a single
geographic area as the ancestral area of each clade,
while S-DIVA increased the number of ancestral areas.
We therefore favor the results from the BBM analysis.
The results of biogeographic optimizations strongly support Asia as the ancestral area of living members of the family,
which is consistent with the fact that the oldest fossil records
of trionychids have been discovered in the continent. Although numerous fossils discovered in North America in the
mid-Campanian suggest that the group made multiple invasions from Asia during this period, their unclear phylogenetic
relationships with fossil taxa from Asia make it impossible to
draw any specific conclusion regarding the dispersal events
(Gardner et al. 1995; Fiorillo 1999; Brinkman 2003; Vitek and
Danilov 2010; Danilov and Vitek 2013; but see Joyce and
Lyson 2010).
The dispersal event, which involves the living genus
Apalone, perhaps took place during the global warming in the
Eocene (Fig. 5a). Several lines of evidence lend support to the
cross-Beringian migration hypothesis. The split between
Rafetus and Apalone around 43 MYA (Fig. 5a, Table 4) occurred after the Thulean Land Bridges were closed, prior to 50
MYA (McKenna 1983). The Bering Straits—the most likely
migration route for this group, formed about 100 MYA
and opened periodically until the Pleistocene—had been
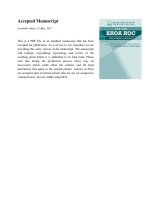
Fig. 5 Time calibration using the program BEAST. a The 95 %
confidence interval values for each numbered node are presented in
Table 4. Colored columns Correlation between the accelerated
speciation rate of trionychids and global warming episodes. Inset graph
Paleothermal fluctuation through time (redrawn from Zachos et al. 2001).
C Calibration point, PAL Paleocene, OLI Oligocene, MIO Miocene, PQ
Pliocene+Quaternary. b A lineage-through-time plot depicting the
logarithm of the number of lineages against millions years before
present generated from the results of the BEAST analysis as shown in a
(γ=–0.146). Colored columns in a show two global warming spans,
which correspond with segments of steeper slope, i.e., a higher number
of lineages, on the graph
A phylogeny of softshell turtles (Testudines: Trionychidae)
a
Carettochelys insculpta
Pelomedusa subrufa
Caretta caretta
Lissemys scutata
Lissemys punctata
Lissemys ceylonensis
Cyclanorbis senegalensis
Cyclanorbis elegans
2
4
16
7
1
24
15
Cycloderma aubryi
Cycloderma frenatum
Trionyx triunguis
Pelochelys bibroni
Pelochelys cantorii
Chitra indica
Chitra chitra
Chitra vandijki
Rafetus euphraticus
Rafetus swinhoei
Apalone mutica
Apalone ferox
Apalone spinifera aspera
Apalone spinifera emoryi
Pelodiscus axenaria
Pelodiscus maackii
Pelodiscus sinensis
Pelodiscus parviformis
Palea steindachneri
Dogania
subplana
g
p
Amyda cartilaginea
Nilssonia gangeticus
Nilssonia leithii
Nilssonia formosa
Nilssonia nigricans
Nilssonia hurum
12
18
3 C
9
28
14
27
5
29
19
21
10
25
6
30
23
32
8
33
11
13
17
26
20
HOT
22
31
20.0
150.0
Jurasic
125.0
100.0
Cre t aceous
75.0
50.0
PAL
25.0
Eocene OLI
Log Lineages
b
Millions of Years Before Present
0.0
M IO
PQ
COLD
M. Le et al.
used by different groups of organisms, including turtles, to
invade North America during periods of warmer climate
(Sanmartin et al. 2001; Beard 2002; Bowen et al. 2002;
Le and McCord 2008).
Trionychid turtles might have invaded Europe twice, in the
Campanian and in the Paleocene (de Lapparent de Broin
2001; Scheyer et al. 2012), although they all subsequently
became extinct in this continent at the end of Pliocene (de
Lapparent de Broin 2001; Danilov 2005). The ancestors of the
genera Cycloderma and Cyclanorbis possibly dispersed to
Africa during the early Eocene (Fig. 5a). It is also likely that
Trionyx constitutes a second dispersal to Africa, although
available fossil records of the genus could not confirm its
ancestral area.
Time-divergence analysis
Praschag et al. (2011) calibrated the time divergence for the
African genera Cyclanorbis + Cycloderma and the Asian genus
Lissemys using the oldest Cycloderma fossil record of 18 MYA
(de Lapparent de Broin 2000). They estimated that the split
between the Asian and African trionychids occurred approximately 22 MYA. Our estimate of 49.5 MYA (CI=34.8–63.9)
for this node (node 7 in Fig. 5a and Table 4) is significantly
older. Similarly, the age estimates for nodes within the
genus Lissemys (nodes 16 and 24) are substantially
greater than those calculated by Praschag et al. (2011),
27.8 vs 11.2 and 16.3 vs 7.8 MYA, respectively (Table 4). The discrepancy might result from the fact that
the fossil used in Praschag et al. (2011) is much younger than the age of the group.
Our results suggest that the burst of the diversification rate
among extant taxa of the family corresponds remarkably well
to two global warming periods, i.e. between the mid Paleocene and the beginning of the Oligocene and between the end
of the Oligocene and the mid Miocene (Fig. 5a,b). During the
first period of the global warming in the Cenozoic, major
extant clades of the family started to diversify in Asia and
dispersed out of Asia, including the dispersals of Apalone to
North America and Cycloderma + Cyclarnobis, and possibly
Trionyx, to Africa after the continent collided with Eurasia.
Important speciation events also occurred in Asia and Africa
during this period, including the appearance of the genera
Cyclanorbis and Cycloderma in Africa and Lissemys,
Pelochelys, Chitra, Pelodiscus, Palea, and Dogania in Asia.
During the final period of global warming, diversification rate
was accelerated in both Asia and the Americas (Fig. 5a,b). Two
species of the genus Rafetus also diverged in this temporal
period. This suggests that, during the warmer climate, members
of the genus expanded their range to cover most of Asia. Subsequent cooling and aridification in central Asia probably led to
hugely disjunct and remnant distributions of two living species in
eastern and western Palearctic. Although this intriguing pattern
of east–west disjunct distribution is unique in softshell turtles,
other groups show similar disjunct ranges, e.g., turtles (genus
Mauremys), plants, fishes, amphibians, birds, and mammals
(Duellman 1999, and references therein). It is possible that the
paleoclimate change in the Miocene and Pliocene was responsible for the distribution pattern in these groups (Duellman 1999).
Table 4 Time calibration for nodes in the phylogeny. Node numbers defined in Fig. 5a
Node
Age estimate (million years)
95 % HPD
Node (million years)
Age estimate (million years)
95 % HPD (million years)
1
2
3
4
5
6
7
8
9
10
133.46
119.64
105.4
103.55
58.84
53.79
49.52
45.99
45.38
43.3
105.8 – 187.65
75.68 – 161.41
94.37 – 117.26
59.71– 147.04
42.59 – 76.39
39.24 – 70.02
34.81 – 63.9
32.71 – 60.46
30.1 – 63.18
28.9 – 58.65
18
19
20
21
22
23
24
25
26
27
25.37
20.89
19.79
19.07
17.17
17
16.28
14.49
13.32
13.3
14.36 – 37.09
9.82 – 35.87
13.02 – 28.02
11.69 – 28.16
10.99 – 25.07
9.49 – 27.89
7.9 – 25.49
8.55 – 22.23
7.33 – 20.32
7.55 – 21.28
11
12
13
14
15
16
17
40.73
40.05
34.59
33.01
30.71
27.8
27.03
29.19 – 54.99
27.81 – 54.1
24.32 – 47.52
20.81 – 47.94
18.98 – 43.72
17.49 – 40.36
18.4 – 37.34
28
29
30
31
32
33
12.96
8.98
8.51
7.27
5.68
4.82
5.56 – 21.4
4.3 – 15.27
4.35 – 13.98
3.4 – 11.96
3.01 – 9.14
2.34 – 8.09
A phylogeny of softshell turtles (Testudines: Trionychidae)
Major global warming periods likely promoted diversification and dispersal rates of softshell turtles. Ants, mammals,
and other aquatic groups like salamanders also show similar
rapid dispersal and speciation rates, which coincide with the
global warming periods during the late Cretaceous and the
Paleocene-Eocene boundary (Moreau et al. 2006; Smith et al.
2006; Vieites et al. 2007). The late Cretaceous global warming
could have facilitated the dispersals of the extinct genus
Plastomenus and to North America (Joyce and Lyson 2010),
and possibly other taxa to Europe during the Campania (de
Lapparent de Broin 2001). Interestingly, the second period of
an increased speciation rate is associated with a high level of
diversification of the aquatic turtle family in both Asia and
North America. This phenomenon has not been well documented in other groups with mammals only showing a significant degree of turnover linked to the replacement of forests
with grasslands during this time (Blois and Hadly 2009).
Conclusion
A comprehensive taxon-sampling phylogeny coupled with biogeographic optimizations and time-divergence analysis helps
shed light on the tempo and the mode of softshell turtle evolution. The coincidence of separate periods of global warming
with the accelerated rate of diversification and dispersal within
the living clades of the aquatic turtles supports the strong
correlation between climate change and speciation and dispersal in this turtle group. This correlation could have important
implication for the ecology and evolution of softshell turtles in
the future climate change scenarios. Our results also suggest
that populations of the critically endangered Shanghai Softshell
Turtle do not show significant genetic divergence to warrant
taxonomic change for this species. Future captive breeding
programs should focus on bringing together individuals from
any populations within its range to boost conservation efforts
for one of the rarest species in the world.
Acknowledgments The Turtle Conservation Fund generously provided research funding for this project. Field work of T. Q.N. in Vietnam was
supported by the Project “The Red Data Book of Vietnam” (Grant No.
DTDL.2011-G/23). We are grateful to Nguyen Van Thanh for laboratory
assistance and helpful discussions, Ms. Le Thanh Hieu and Vu Dang
Dong for support and to Le Sy Vinh and Dang Cao Cuong for computer
assistance. Comments from four anonymous reviewers greatly improved
the paper.
References
Arévalo, E., Davis, S. K., & Sites, J. W. (1994). Mitochondrial DNA
sequence divergence and phylogenetic relationships among eight
chromosome races of the Sceloporus grammicus complex
(Phrynosomatidae) in central Mexico. Systematic Biology, 43,
387–418.
Baillie, J. E. M., & Butcher, E. R. (2012). Priceless or Worthless? The World
Most Threatened Species. London: Zoological Society of London.
Barley, A. J., Spinks, P. Q., Thomson, R. C., & Shaffer, H. B. (2010).
Fourteen nuclear genes provide phylogenetic resolution for difficult
nodes in the turtle tree of life. Molecular Phylogenetics and
Evolution, 55, 1189–1194.
Beard, C. (2002). East of Eden at the Paleocene/Eocene boundary.
Science, 295, 2028–2029.
Blois, J. L., & Hadly, E. A. (2009). Mammalian response to Cenozoic climate
change. Annual Review of Earth and Planetary Sciences, 37, 181–208.
Bowen, G. J., Clyde, W. C., Koch, P. L., Ting, S., Alroy, J., Tsubamota,
T., et al. (2002). Mammalian dispersal at the Paleocene/Eocene
boundary. Science, 295, 2062–2065.
Brandley, M. C., Schmitz, A., & Reeder, T. W. (2005). Partitioned
Bayesian analyses, partition choice, and the phylogenetic relationships of scincid lizards. Systematic Biology, 54, 373–390.
Brinkman, D. B. (2003). A review of nonmarine turtles from the Late
Cretaceous of Alberta. Canadian Journal of Earth Sciences, 40,
557–571.
Clement, M., Posada, D., & Crandall, K. A. (2000). TCS: a computer program
to estimate gene genealogies. Molecular Ecology, 9, 1657–1660.
Danilov, I. G. (2005). Die fossilen Schildkröten Europas. In U. Fritz (Ed)
Handbuch der Reptilien und Amphibien Europas. Bd. 3, 3B,
Schildkröten (Testudines) II, pp. 329–441.
Danilov, I. G., & Vitek, N. S. (2013). Cretaceous trionychids of Asia: an
expanded review of their record and biogeography. In D. B.
Brinkman, P. A. Holroyd, J. D. Gardner (Eds) Morphology and
Evolution of Turtles, pp. 419–438.
de Lapparent de Broin, F. (2000). African chelonians from the
Jurassic to the present: phases of development and preliminary catalogue of the fossil record. Palaeontologia Africana,
36(43), 82.
de Lapparent de Broin, F. (2001). The European turtle fauna from the
Triassic to the Present. Dumerilia, 4, 155–217.
Drosopoulou, E., Tsiamis, G., Mavropoulou, M., Vittas, S., Katselidis, K.
A., Schofield, G., et al. (2012). The complete mitochondrial genome
of the loggerhead turtle Caretta caretta (Testudines: Cheloniidae):
genome description and phylogenetic considerations. Mitochondrial
DNA, 23, 1–12.
Drummond, A. J., & Rambaut, A. (2007). BEAST: Bayesian evolutionary analysis by sampling trees. BMC Evolutionary Biology, 7, 214.
Drummond, A. J., Ho, S. Y. W., Phillips, M. J., & Rambaut, A. (2006).
Relaxed phylogenetics and dating with confidence. PLoS Biology, 4,
699–710.
Duellman, W. E. (1999). Patterns of Distribution of Amphibians: A
Global Perspective. Baltimore and London: John Hopkins
University Press.
Engstrom, T. N., Shaffer, H. B., & Mccord, W. P. (2002). Phylogenetic
diversity of endangered and critically endangered southeast Asian
softshell turtles (Trionychidae: Chitra). Biological Conservation,
104, 173–179.
Engstrom, T. N., Shaffer, H. B., & Mccord, W. P. (2004). Multiple data
sets, high homoplasy, and the phylogeny of softshell turtles
(Testudines: Trionychidae). Systematic Biology, 53, 693–710.
Ernst, H. C., & Barbour W. R. (1989). Turtles of the World. Smithsonian
Institution Press
Farkas, B., Le, M. D., & Nguyen, T. Q. (2011). Rafetus vietnamensis Le,
Le, Tran, Phan, Phan, Tran, Pham, Nguyen, Nong, Phan, Dinh,
Truong and Ha, 2010—another invalid name for an invalid species
of softshell turtle (Reptilia: Testudines: Trionychidae). Russian
Journal of Herpetology, 18, 65–72.
Felsenstein, J. (1985). Confidence limits on phylogenies: an approach
using the bootstrap. Evolution, 39, 783–791.
Fiorillo, A. R. (1999). Non-mammalian microvertebrate remains from the
Robison Egghell Site, Cedar Mountain Formation (Lower
Cretaceous) Emery County, Utah. In D. D. Gillette (Ed.),
M. Le et al.
Vertebrate Paleontology in Utah (pp. 259–268). Utah Geological
Survey, Salt Lake City, UT: Miscellaneous Publication.
Fritz, U., Branch, W. R., Hofmeyr, M. D., Maran, J., Prokop, H.,
Schleicher, A., Stuckas, H., Vargas-Ramírez, M., Vences, M., &
Hundsdörfer, A. K. (2011). Molecular phylogeny of African hinged
and helmeted terrapins (Testudines: Pelomedusidae: Pelusios and
Pelomedusa). Zoologica Scripta, 40, 115–125.
Fritz, U., Gong, S., Auer, M., Kuchling, G., Schneeweiss, N., & Hundsdörfer,
A. K. (2010). The world’s economically most important chelonians
represent a diverse species complex (Testudines: Trionychidae:
Pelodiscus). Organisms, Diversity & Evolution, 10, 227–242.
Fujita, M. K., Engstrom, T. N., Starkey, D. E., & Shaffer, H. B. (2004).
Turtle phylogeny: Insights from a novel nuclear intron. Molecular
Phylogenetics and Evolution, 31, 1031–1040.
Gaffney, E. S., & Bartholomai, A. (1979). Fossil trionychids of Australia.
Journal of Paleontology, 53, 1354–1360.
Gardner, J. D., Russell, A. P., & Brinkman, D. B. (1995). Systematics and
taxonomy of soft- Shelled turtles (family Trionychidae) from the
Judith River Group (mid-Campanian) of North America. Canadian
Journal of Earth Sciences, 32, 631–643.
Gidis, M., Spinks, P. Q., Çevik, E., Kaska, Y., & Shaffer, H. B. (2011).
Shallow genetic divergence indicates a Congo-Nile riverine connection for the softshell turtle Trionyx triunguis. Conservation Genetics,
12, 589–594.
Hall, T. A. (1999). BioEdit: a user-friendly biological sequence alignment
editor and analysis program for Windows 95/98/NT. Nucleic Acids
Symposium, 41, 95–98.
Head, J. J., Aguilera, O. A., & Sánchez-Villagra, M. R. (2006). Past
colonization of South America by trionychid turtles: Fossil evidence
from Neogene of Margarita Island Venezuela. Journal of
Herpetology, 40, 378–381.
Hillis, D. M., & Bull, J. J. (1993). An empirical test of bootstrapping as a
method for assessing confidence in phylogenetic analysis.
Systematic Biology, 42, 182–192.
Hirayama, R., Brinkman, D. B., & Danilov, I. G. (2000). Distribution and
biogeography of non- marine Cretaceous turtles. Russian Journal of
Herpetology, 7, 181–198.
Iverson, J. B. (1992). A revised checklist with distribution maps of the
turtles of the world. Richmond, Indiana: Privately published.
Joyce, W. G., & Lyson, T. R. (2010). A neglected lineage of North
American turtles fills a major gap in the fossil record.
Palaeontology, 53, 241–248.
Kasparek, M. (2001). Priorities for the conservation of the Nile softshelled
turtle, Trionyx triunguis in the Mediterranean. Testudo, 5, 49–59.
Krenz, J. G., Naylor, G. J. P., Shaffer, H. B., & Janzen, F. J. (2005).
Molecular phylogenetics and evolution of turtles. Molecular
Phylogenetics and Evolution, 37, 178–191.
Kuchling, G. (2012). Field surveys for wild Rafetus. Available at www.
turtlesurvival.org/blog/1-blog/167-field-surveys-for-wild-rafetus.
Accessed on July 8, 2013
Le, M., & McCord, W. P. (2008). Phylogenetic relationships and biogeographical history of the genus Rhinoclemmys Fitzinger, 1835 and the
monophyly of the turtle family Geoemydidae (Testudines:
Testudinoidea). Zoological Journal of Linnean Society, 153, 751–
767.
Le, M., & Pritchard, C. H. P. (2009). Genetic variability of the critically
endangered softshell turtle, Rafetus swinhoei: A preliminary report.
Proceedings of the First Vietnamese National Symposium on
Reptiles and Amphibians, pp. 84–92.
Le, M., McCord, W. P., & Iverson, J. B. (2007). On the paraphyly of the
genus Kachuga (Testudines: Geoemydidae). Molecular
Phylogenetics and Evolution, 45, 398–404.
Le, T. B., Le, Q. H., Tran, M. L., Phan, T. H., Phan, M. T., Tran, T. T. H.,
et al. (2010). Comparative morphological and DNA analysis of
specimens of giant freshwater soft-shelled turtle in Vietnam related
to Hoan Kiem Lake. Vietnam Journal of Biotechnology, 8, 949–954.
Liebing, N., Praschag, P., Gosh, R., Vasudevan, K., Rashid, S. M. A.,
Rao, D. Q., et al. (2012). Molecular phylogeny of the softshell turtle
genus Nilssonia revisited, with first records of N. formosa for China
and wild-living N. nigricans for Bangladesh. Vertebrate Zoology, 62,
261–272.
McGaugh, S. E., Eckerman, C. M., & Janzen, F. J. (2008). Molecular
phylogeography of Apalone spinifera (Reptilia, Trionychidae).
Zoologica Scripta, 37, 289–304.
McKenna, M. C. (1983). Cenozoic paleogeography of North Atlantic
land bridges. In M. H. P. Bott, S. Saxov, M. Talwani, & J.
Thiede (Eds.), Structure and Development of the GreenlandScotland Bridge: New Concepts and Methods (pp. 351–395).
New York: Plenum.
Meylan, A. P. (1987). The phylogenetic relationships of soft-shelled
turtles (family Trionychidae). Bulletin of the American Museum of
Natural History, 186, 1–101.
Moreau, C. S., Bell, C. D., Vila, R., Archibald, S. B., & Pierce, N. E.
(2006). Phylogeny of the ants: diversification in the age of angiosperms. Science, 312, 101–104.
Naro-Maciel, E., Le, M., Fitzsimmons, N. N., & Amato, G. (2008).
Evolutionary relationships of marine turtles: a molecular phylogeny
based on nuclear and mitochondrial genes. Molecular Phylogenetics
and Evolution, 49, 659–662.
Nessov, L. A. (1995). On some Mesozoic turtles of the Fergana
Depression (Kyrgyzstan) and Dzhugar Alatau Ridge (Kazakhstan).
Russian Journal of Herpetology, 2, 134–141.
Nylander, J. A. A., Ronquist, F., Huelsenbeck, J. P., & Nieves-Aldrey, J.
L. (2004). Bayesian phylogenetic analysis of combined data.
Systematic Biology, 53, 47–67.
Palumbi, S. R. (1996). Nucleic acids II: The polymerase chain reaction. In
D. M. Hillis, C. Moritz, & B. K. Mable (Eds.), Molecular systematic
(2nd ed., pp. 205–247). Sunderland, MA: Sinauer Associates.
Posada, D., & Crandall, K. A. (1998). MODELTEST: testing the model
of DNA substitution. Bioinformatics, 14, 817–818.
Praschag, P., Hundsdörfer, A. K., Reza, A. H. M. A., & Fritz, U. (2007).
Genetic evidence for wild- living Aspideretes nigricans and
molecular phylogeny of South Asian softshell turtles
(Reptilia: Trionychidae: Aspideretes, Nilssonia). Zoologica
Scripta, 36, 301–310.
Praschag, P., Stuckas, H., Päckert, M., Maran, J., & Fritz, U. (2011).
Mitochondrial DNA sequences suggest a revised taxonomy of
Asian flap shell turtles (Lissemys Smith, 1931) and the validity of
previously unrecognized taxa (Testudines: Trionychidae). Vertebrate
Zoology, 61, 147–160.
Pritchard, P. C. H. (2001). Observations on body size, sympatry, and
niche divergence in softshell turtles (Trionychidae). Chelonian
Conservation and Biology, 4, 5–27.
Ronquist, F., Teslenko, M., van der Mark, P., Ayres, D. L., Darling, A.,
Höhna, S., et al. (2012). MrBayes 3.2: efficient Bayesian phylogenetic inference and model choice across a large model space.
Systematic Biology, 61, 539–542.
Sanmartin, I., Enghoff, H., & Ronquist, F. (2001). Patterns of animal
dispersal, vicariance and diversification in the Holarctic. Biological
Journal of the Linnean Society, 73, 345–390.
Scheyer, M. T., Mörs, T., & Einarsson, E. (2012). First record of softshelled turtles (Cryptodira, Trionychidae) from the late Cretaceous
of Europe. Journal of Vertebrate Paleontology, 32, 1027–1032.
Smith, T., Rose, K. D., & Gingerich, P. D. (2006). Rapid Asia-EuropeNorth America geographic dispersal of earliest Eocene primate Teilhardina during the Paleocene-Eocene thermal maximum. Proceedings of the National Academy of Sciences, 103,
11223–11227.
Stadler, T. (2011). Stimulating trees on a fixed number of extant species.
Systematic Biology, 60, 676–684.
Stuckas, H., & Fritz, U. (2011). Identity of Pelodiscus sinensis revealed
by DNA sequences of an approximately 180-year-old type specimen
A phylogeny of softshell turtles (Testudines: Trionychidae)
and a taxonomic reappraisal of Pelodiscus species (Testudines:
Trionychidae). Journal of Zoological Systematics and
Evolutionary Research, 49, 335–339.
Swofford, D. L. (2001). PAUP* Phylogenetic analysis using parsimony (*and other methods), version 4. Sunderland, MA:
Sinauer Associates.
Templeton, A. R., Crandall, K. A., & Sing, C. F. (1992). A cladistic
analysis of phenotypic associations with haplotypes inferred from
restriction endonuclease mapping and DNA sequence data. III.
Cladogram estimation. Genetics, 132, 619–633.
Van Dijk, P. P., Iverson, J. B., Shaffer, H. B., Bour, R., & Rhodin, A. G. J.
(2012). Turtles of the world, 2012 update: annotated checklist of
taxonomy, synonymy, distribution, and conservation status.
Chelonian Research Monographs, 5, 243–328.
Vieites, D. R., Min, M.-S., & Wake, D. B. (2007). Rapid diversification
and dispersal during periods of global warming by plethodontid
salamanders. Proceedings of the National Academy of Sciences,
104, 19903–19907.
Vitek, N. S., & Danilov, I. G. (2010). New material and a reassessment of
soft-shelled turtles (Trionychidae) from the late Cretaceous of
middle Asia and Kazakhstan. Journal of Vertebrate Paleontology,
30, 383–393.
Wang, J., & Shi, H. T. (2011). The change of historical distribution of
Rafetus swinhoei. Acta Zootaxonomica Sinica, 36, 919–924.
Weisrock, D. W., & Janzen, F. J. (2000). Comparative molecular
phylogeography of North American softshell turtles (Apalone):
implications for regional and wide-scale historical evolutionary forces. Molecular Phylogenetics and Evolution, 14, 152–
164.
Wood, R. C., & Patterson, B. (1973). A fossil trionychid turtle from South
America. Breviora, 405(1), 10.
Yang, P., Tang, Y., Ding, L., Guo, X., & Wang, Y. (2011). Validity of
Pelodiscus parviformis (Testudines: Trionychidae) inferred from
molecular and morphological analyses. Asian Herpetological
Research, 2, 21–29.
Yu, Y., Harris, A.J., He, & X.J. (2011). RASP (reconstruct ancestral state
in phylogenies). />Zachos, J., Pagani, M., Sloan, L., Thomas, E., & Billups, K. (2001).
Trends, rhythms, and aberrations in global climate 65 Ma to present.
Science, 292, 686–693.