DSpace at VNU: Synthesis of silica-coated magnetic nanoparticles and application in the detection of pathogenic viruses
Bạn đang xem bản rút gọn của tài liệu. Xem và tải ngay bản đầy đủ của tài liệu tại đây (1.13 MB, 7 trang )
Hindawi Publishing Corporation
Journal of Nanomaterials
Volume 2013, Article ID 603940, 6 pages
/>
Research Article
Synthesis of Silica-Coated Magnetic Nanoparticles and
Application in the Detection of Pathogenic Viruses
Dao Van Quy,1 Nguyen Minh Hieu,2 Pham Thi Tra,1 Nguyen Hoang Nam,2
Nguyen Hoang Hai,2,3 Nguyen Thai Son,4 Phan Tuan Nghia,1 Nguyen Thi Van Anh,1
Tran Thi Hong,2 and Nguyen Hoang Luong2,3
1
Key Laboratory for Enzyme and Protein Technology, VNU University of Science, 334 Nguyen Trai,
Thanh Xuan, Hanoi, Vietnam
2
VNU University of Science, 334 Nguyen Trai, Thanh Xuan, Hanoi, Vietnam
3
Nano and Energy Center, Vietnam National University, 334 Nguyen Trai, Thanh Xuan, Hanoi, Vietnam
4
Hospital 103, 104 Phung Hung, Ha Dong, Hanoi, Vietnam
Correspondence should be addressed to Nguyen Hoang Luong;
Received 29 March 2013; Revised 6 June 2013; Accepted 10 June 2013
Academic Editor: Subhankar Bedanta
Copyright © 2013 Dao Van Quy et al. This is an open access article distributed under the Creative Commons Attribution License,
which permits unrestricted use, distribution, and reproduction in any medium, provided the original work is properly cited.
Magnetic Fe3 O4 nanoparticles were prepared by coprecipitation and then coated with silica. These Fe3 O4 /SiO2 nanoparticles
consisted of a 10–15 nm magnetic core and a silica shell of 2–5 nm thickness. The superparamagnetic property of the Fe3 O4 /SiO2
particles with the magnetization of 42.5 emu/g was confirmed by vibrating sample magnetometer (VSM). We further optimized
buffers with these Fe3 O4 /SiO2 nanoparticles to isolate genomic DNA of hepatitis virus type B (HBV) and of Epstein-Barr virus
(EBV) for detection of the viruses based on polymerase chain reaction (PCR) amplification of a 434 bp fragment of 𝑆 gene specific
for HBV and 250 bp fragment of nuclear antigen encoding gene specific for EBV. The purification efficiency of DNA of both HBV
and EBV using obtained Fe3 O4 /SiO2 nanoparticles was superior to that obtained with commercialized Fe3 O4 /SiO2 microparticles,
as indicated by (i) brighter PCR-amplified bands for both HBV and EBV and (ii) higher sensitivity in PCR-based detection of EBV
load (copies/mL). The time required for DNA isolation using Fe3 O4 /SiO2 nanoparticles was significantly reduced as the particles
were attracted to magnets more quickly (15–20 s) than the commercialized microparticles (2-3 min).
1. Introduction
Isolation of nucleic acids from clinical samples is an essential
step in diagnostics, such as in the detection of pathogenic
viruses and bacteria using the polymerase chain reaction
(PCR), paternity testing, DNA fingerprinting for crime
detection, and DNA sequencing. The nucleic acid isolation
method based on interaction with silica, created by Boom
et al. in 1990 [1], is currently the most commonly used.
Recently, micrometer-size silica-coated magnetic beads have
been developed by different groups [2, 3] and biotech
companies such as Roche Diagnostics, Life Technologies,
Beckman Coulter, and Promega to improve the efficiency
of purification and save working time because the purification procedures could be performed automatically. This
development is very useful for enrichment of nucleic acids
in clinical samples with a low copy number of the pathogen,
tuberculosis bacterium in sputum, for example, thereby
increasing the sensitivity of detection using PCR method [4].
In comparison to the micrometer-size silica-coated magnetic
beads, silica-coated magnetic nanoparticles have larger total
surface area, thus could be more functional in purification
of DNA from samples. However, the synthesis of silicacoated magnetite nanoparticles for specific applications in
nucleic acid purification of viruses in blood, which is a
very important step in the diagnosis of viruses in specimen,
is an emerging area. We therefore present a method for
synthesizing the SiO2 -coated Fe3 O4 magnetic nanoparticles
and use the particles in the isolation of DNA of Hepatitis virus
type B (HBV) and Epstein-Barr virus (EBV) from several real
2
serum samples. These viruses are commonly found in blood
infection and the cause of hepatitis (HBV) and particular
cancers and lymphomas (EBV) [4, 5].
2. Materials and Methods
2.1. Synthesis of Silica-Coated Magnetic Nanoparticles. Magnetic Fe3 O4 nanoparticles were synthesized by using coprecipitation from iron (III) chloride and iron (II) chloride
solutions with the assistance of aqueous ammonia solution as described elsewhere [6]. The synthesized magnetic
nanoparticles were washed several times with alcohol and
then distilled water until pH 7.0. Fe3 O4 /SiO2 nanoparticles
were prepared by coating magnetic nanoparticles with silica.
100 mL of the suspension of prepared magnetic nanoparticles
(containing 1 g magnetite) was stored in a flask. 50 mL of the
10% solution of aqueous tetraethylorthosilicate (TEOS) was
added to the flask together with 70 mL alcohol and mixed
using an overhead stirrer. The pH of the suspension was
adjusted to 9.0 with NaOH. The flask was then heated to
90∘ C and stirred at this temperature for 6 h. After cooling
to room temperature (RT), the suspension was washed twice
with alcohol and six times with distilled water. The final
suspension volume was adjusted to 100 mL with water.
Fe3 O4 /SiO2 nanoparticles were characterized using a
transmission electron microscope (TEM JEM1010, JEOL)
and Fourier-transform infrared (FTIR) spectroscopy (FT/IR6300, JASCO). Magnetic curves were measured using a DMS880 vibrating sample magnetometer (VSM) at RT.
For further experiments in nucleic acid isolation,
Fe3 O4 /SiO2 nanoparticles were stored in 100 mM Tris-HCl
buffer (pH 7.0). For each DNA isolation reaction from
200 𝜇L serum sample, 50 𝜇L of Fe3 O4 /SiO2 nanoparticles at
a concentration of 25 mg/mL was used.
2.2. Preparation of DNA Isolation Buffers. A set of nucleic acid
buffers were made based on the method described previously
by Boom et al. [1] and optimized in this work suitably for
properties of Fe3 O4 /SiO2 nanoparticles. The set contained
(i) Proteinase K 20 mg/mL (BioBasic), (ii) lysis buffer (LB:
30 mM Tris-HCl pH 7.0, 1 M NaCl, 4.5 M GuSCN, 20 mM
EDTA, 1.5% Triton X-100), (iii) two types of washing buffers
(WB1: 30 mM Tris-HCl, pH 7.0, 2.25 M GuSCN, 56% ethanol;
WB2: 10 mM Tris-HCl pH 7.0, 70% ethanol), and (iv) elution
buffer (EB: 10 mM Tris-HCl pH 8.5, 1 mM EDTA).
2.3. Primer Design and Cloning of Plasmids Harbouring Specific Genes for HBV and EBV as Standards for PCR. The primers for HBV (HBSF: 5 -CTTTCATCCTGCTGCTATGCCT;
HBSR: 5 -AGGGTTCAAATGTATACCCAAAGACA-3 )
were designed based on previous work by Abe et al. [7] and
Nghia et al. [8], for the amplification of a 434 bp specific
fragment of 𝑆 gene for HBV. Sets of primers for nested PCR
to detect EBV (EBVexF: 5 -TGGAAACCCGTCACTCTC3 ; EBVexR: 5 -AATGGCATAGGTGGAATG-3 ; EBVinF:
TGTTGGAAACCCGTCACTCTC-3 ; EBVinR: 5 -GGGTAATGGCATAGGTGGAATG-3 ) were designed based
on the modification of previous primer design studies by
Journal of Nanomaterials
van Baarle et al. [5], which was based on the conserved
sequence of genes encoding the nuclear antigens EBNA-2
that generated a DNA product of 250 bp (named as EBV250). The PCR primers (EBVF3: 5 -GGAACCTGGTCATCCTTGC-3 ; EBFR3: 5 -ACGTGCATGGACCGGTTAAT-3 ; EBV Taqman probe: 5 -(FAM)-CGCAGGCACTCGTACTGCTCGCT-(TAMRA)-3 ) for real-time PCR using
TaqMan probe (Roche Diagnostics) to measure EBV virus
load were designed previously [9] based on the sequence
encoding nonglycosylated membrane protein BNRF1 p143
and generating a PCR product of 74 bp named as EBV-74.
The 434 bp for HBV and 250 bp and 74 bp for EBV were
cloned into pGEM-T/A plasmid (Promega). The plasmids
harbouring the specific 434 bp bands for HBV were named as
pGEM-HBV. The ones harbouring the specific 250 bp and 74
bands for EBV were named as pGEM-EBV-250 and pGEMEBV-74, respectively. The cloned plasmids were then purified
and used as a template for sequencing their specific inserted
genes for HBV (HBV-434) and EBV (EBV-250, EBV-74).
The sequences were compared for homology to the abovementioned standard genes for HBV and EBV (as posted on
the international gene bank). The plasmids were diluted into
10-fold serial concentrations ranging from 4 × 10⁹ to 4 × 10²
copies/mL.
2.4. Recovery of Standard DNA Plasmid and Isolation of
Genomic DNA of Viruses from Serum. HBV and EBV negative and positive serum samples were collected at the National
Hospital of Tropical Diseases, Hospital 103, and Bach Mai
Hospital, Vietnam. Either standard DNA plasmids pGEMHBV, pGEM-EBV-250, and pGEM-EBV-74 or serum samples
containing HBV and EBV were recovered or purified using
obtained Fe3 O4 /SiO2 nanoparticles and the optimized buffers
in this work. Silica-coated Fe3 O4 /SiO2 microparticles named
Dynabeads Myone Silane (Life Technologies) were used as
controls for our Fe3 O4 /SiO2 nanoparticles. The protocol for
isolating DNA of the virus from multi-serum samples was set
up using special 96-well ELISA plastic plates (Thermo Scientific, code 5530100) and MagnaBot 96 Magnetic Separation
(Promega), which included four steps. (i) Lysis to release virus
genomic DNA: 20 𝜇L proteinase K (10 mg/mL) and 300 𝜇L
LB were added into 200 𝜇L of serum sample. The solution
was mixed well by pipetting 3–5 times before incubating
at RT for 10 min. (ii) Binding of the released DNA onto
Fe3 O4 /SiO2 nanoparticles in LB. Next, 50 𝜇L of Fe3 O4 /SiO2
nanoparticles and 150 𝜇L isopropanol were added to the LBtreated serum. The mixture was incubated for 3 min at RT
for binding of DNA onto the Fe3 O4 /SiO2 nanoparticles. Then
MagnaBot 96 Magnetic Separation (Promega) was applied for
30 s to attract Fe3 O4 /SiO2 nanoparticles bound with DNA
and for 3 min to attract Dynabeads Myone Silane bound
with DNA or until the solution was clear/white. Next, the
clear solution was removed. (iii) Washing off contaminated
non-DNA biomolecules using WB1 and WB2: MagnaBot
96 was switched off and WB1 was added into the wells
containing Fe3 O4 /SiO2 nanoparticles, followed by mixing
well the suspension pipetting 5 times. Then MagnaBot 96
was applied again for attracting Fe3 O4 /SiO2 nanoparticles,
Journal of Nanomaterials
3
80
60
M (emu/g)
40
20
0
−20
−40
20 nm
−60
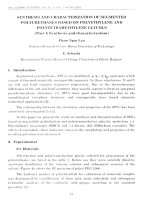
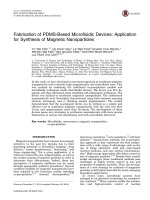
Figure 1: TEM image of Fe3 O4 /SiO2 nanoparticles.
−80
100
Transmittance (% )
80
10000
15000
Fe-O
50
Fe3 O4
load through amplification of 74 bp specific for EBV was
performed following Niesters et al. [9] using 45 cycles of the
following conditions: 95∘ C for 15 s and 60∘ C for 1 min.
40
SiO2
Fe-O-Si
Si-O-Si
20
4000
5000
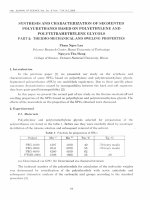
Figure 3: Magnetization curves of Fe3 O4 and Fe3 O4 /SiO2 at room
temperature.
Fe3 O4 /SiO2
O-H
60
30
0
H (Oe)
Fe3 O4 /SiO2
Fe3 O4
90
70
−15000 −10000 -5000
3500
3000
2500
2000
1500
Wavenumber (cm−1 )
1000
500
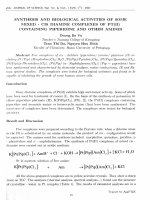
Figure 2: FTIR spectra of SiO2 , Fe3 O4 , and Fe3 O4 /SiO2 nanoparticles.
allowing removal of the washing solution. This step was
repeated with WB2. In this case, WB2 must be completely
removed and residual ethanol evaporated by air drying. (iv)
Elution using EB: MagnaBot 96 was switched off and 100 𝜇L
EB was added in to each well for mixing by pipetting 5
times. The suspension was incubated at 65∘ C for 3 min. The
solution containing DNA was eluted after applying MagnaBot
96 to attract the nanoparticles. For recovery of standard
DNA plasmids, the same protocol was intentionally applied.
Isolated DNA concentration was measured and calculated by
absorbance at 260 nm using a NanoDrop spectrophotometer
(Thermo Scientific). The samples were used immediately or
stored at −80∘ C for PCR detection of specific DNA bands for
EBV and HBV.
2.5. Polymerase Chain Reaction to Detect HBV and EBV.
Purified DNA of HBV from serum samples were used as a
template for PCR detection of HBV, as described by Nghia
et al. [8]. Amplification of 250 bp specific fragments for
EBV was optimized in this work under 35 cycles of the
following conditions: 94∘ C for 30 s, 52∘ C (initial 5 cycles)
and 56∘ C (following 25 cycles) for 45 s, and 72∘ C for 60 s.
Real-time PCR to quantitatively measure the EBV virus
3. Results and Discussion
3.1. Properties of Silica-Coated Magnetic Nanoparticles.
Figure 1 shows the TEM image of Fe3 O4 /SiO2 nanoparticles.
From this image it can be seen that Fe3 O4 /SiO2 nanoparticles
were formed by 10–15 nm diameter of seed and the
surrounding layer has a thickness of about 2–5 nm. Figure 2
shows the FTIR spectra of prepared Fe3 O4 , Fe3 O4 /SiO2
nanoparticles and SiO2 for comparison. In all spectra, the
absorption bands at 3650 ÷ 3200 cm−1 correspond to O–H
stretching mode. The spectra of Fe3 O4 and Fe3 O4 /SiO2 show
the absorption bands near 500 cm−1 which are assigned
to Fe–O stretching mode. The spectrum of SiO2 shows
the Si–O–Si stretching vibration at 1070 ÷ 1080 cm−1 . The
spectrum of Fe3 O4 shows an absorption at around 1390 cm−1
which is assigned to Fe–O stretching mode. This absorption
also appears in the spectrum of Fe3 O4 /SiO2 but with smaller
intensity. This can be explained by the covering of SiO2
layers. The existence of SiO2 layers in the spectrum of
Fe3 O4 /SiO2 can be seen by the Si–O–Si stretching vibration
at 1070 ÷ 1080 cm−1 as well as the Fe–O–Si stretching
vibration at 1050 ÷ 1250 cm−1 . The data strongly suggest that
the Fe3 O4 nanoparticles were successfully coated with SiO2
layers. The FTIR results can be used for confirming the silica
coating on nanoparticles as recently discussed by Luong et
al. [10] on SiO2 -coated FePt nanoparticles.
Figure 3 shows the magnetic curves of Fe3 O4 and
Fe3 O4 /SiO2 nanoparticles measured at room temperature.
Both of them show superparamagnetic property (i.e., no
remanence effect) with high saturation magnetization of
4
Journal of Nanomaterials
Table 1: Quantitation of EBV load in serum using DNA templates purified by Fe3 O4 /SiO2 nanoparticles and Dynabeads.
Sample number
7
10
(−) 100 bp (+)
500
400
300
200
100
𝐶𝑡 (threshold cycle)
36.2
40.62
26.78
27.73
Material for DNA isolation
Fe3 O4 /SiO2 nanoparticles
Dynabeads
Fe3 O4 /SiO2 nanoparticles
Dynabeads
1
2
3
4
5
6
7
8
100 bp (+) (−) 1 2
434 bp
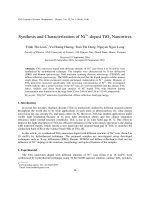
Figure 4: Electrophoresis result of PCR products of HBV specific
gene using recovered DNA plasmids pGEM-HBV as templates. (−)
negative control, 100 bp DNA ladder, (+) positive control: PCR
product of purified pGEM-HBV, lane 1–8: PCR products using DNA
plasmids after recovering by Fe3 O4 /SiO2 nanoparticles at tenfold
diluted initial DNA concentrations, ranging from 4 × 10⁹ copies/mL
(lane 1) to 4 × 10² copies/mL (lane 8).
42.5 emu/g and 65.1 emu/g for Fe3 O4 /SiO2 and Fe3 O4 samples, respectively. The Fe3 O4 /SiO2 sample had a smaller magnetization because the magnetic nanoparticles were coated
with nonmagnetic layers of SiO2 . From the above values of
magnetization, the average thickness of the SiO2 layers can
be estimated to be 1–1.5 nm, in good agreement with that
obtained from TEM measurements.
3.2. Purification of DNA of Hepatitis Virus Type B (HBV)
Using Silica-Coated Magnetic Nanoparticles and Optimized
Buffers. Before testing the DNA purification procedure with
real serum samples, we measured the efficiency of DNA
recovery of the Fe3 O4 /SiO2 nanoparticles and the optimized
buffers using standard pure pGEM-HBV plasmid at 10fold diluted concentrations ranging from 4 × 10⁹ copies/mL
to 4 × 10² copies/mL. The enriched DNA solutions were
used as templates for amplification of 434 bp fragment of 𝑆
gene specific for HBV. As shown in Figure 4, from left to
right, we could detect bands of about 434 bp with reducing
intensities proportional to reducing concentrations from 4
× 109 copies/mL to 4 × 10² copies/mL (Figure 4, lane 1–
8). This result indicates that Fe3 O4 /SiO2 nanoparticles and
the optimized buffer could successfully enrich DNA from
solution and that the purified DNA was qualified for further
PCR-based detection of HBV at a sensitivity of 4 × 10²
copies/mL.
We then used Fe3 O4 /SiO2 nanoparticles and the buffers to
isolate DNA of HBV in six real serum samples (one negative
Figure 5 lane 5 and five positives Figure 5 lane 1–4, 6). As
a result, we could observe faint specific bands of 434 bp for
HBV in samples in lanes 1 and 3, and very bright bands of
500
300
100
3
Virus load (copies/mL)
7.17 × 10³
6.53 × 10²
1.18 × 10⁶
7.04 × 10⁵
4
5
6
1 2 3 4 5 6
434 bp
Figure 5: Electrophoresis result of PCR products of HBV specific
gene using DNA purified by Fe3 O4 /SiO2 nanoparticles: 100 bp DNA
ladder, (+) positive control: PCR product of purified pGEM-HBV,
(−) negative control, lanes 1 to 6: PCR products using purified DNA
from samples from number 1 to 6 by Fe3 O4 /SiO2 nanoparticles,
lane 1 to 6 : PCR products using purified DNA from samples from
number 1 to 6 by Dynabeads.
434 bp for HBV in samples in lanes 2, 4, and 6. Meanwhile, no
band was observed in the sample in lane 5. The data indicates
that six real serum samples had different concentrations of
virus copies, of which the sample in lane 6 had the highest
virus load. Our data were in good agreement with those
confirmed by the hospital where the samples were collected.
In parallel, we performed similar experiments with these
six serum samples using the commercialized silica-coated
magnetic microparticles Dynabeads Myone Silane (short
name: Dynabeads, Life Technologies). As shown in Figure 5,
clear bands of 434 bp for HBV were observed in the samples
in lane 2 , 4 , and 6 . However, intensities of those bands were
weaker compared to those in the same samples in lanes 2, 4,
and 6 obtained in the case of Fe3 O4 /SiO2 nanoparticles. We
could not observe the specific PCR-amplified bands in the
samples in lanes 1 and 3 , possibly due to the low levels of
purified template DNA obtained when using Dynabeads. We
conclude then that Fe3 O4 /SiO2 nanoparticles may be more
efficient than Dynabeads in DNA isolation of HBV from
serum.
3.3. Purification of DNA of Epstein-Barr Viruses (EBV) Using
Silica-Coated Magnetic Nanoparticles and Optimized Buffers.
Fe3 O4 /SiO2 nanoparticles and the buffers were then used to
isolate DNA of EBV in real serum samples, in comparison
to Dynabeads. Among 10 suspected EBV infected serum
samples, we could detect clearly 250 bp specific bands for EBV
in the samples 7 and 10 using both Fe3 O4 /SiO2 nanoparticles
(Figure 6(a), lanes 7 and 10) and Dynabeads (Figure 6(b),
lanes 7 and 10 ). However, the brighter signals were observed
when using Fe3 O4 /SiO2 nanoparticles, indicating that the
DNA isolation efficiency of EBV by Fe3 O4 /SiO2 nanoparticles
was higher than that using Dynabeads. Further, real-time
Journal of Nanomaterials
(+) 1 kb (−) 1
2
3
5
4
5
6
7
8
9
(+) 1 kb (−) 1
10
2
3
4
5
6
7
8
9 10
250 bp
250 bp
(a)
(b)
Figure 6: Electrophoresis result of PCR products of EBV specific gene using DNA purified by Fe3 O4 /SiO2 nanoparticles (a) and Dynabeads
(b). (a) (+): PCR product of positive control pGEM-EBV, 1 Kb DNA ladder, (−): negative control, lane 1–10: PCR products using purified DNA
of EBV from serum samples from number 1 to 10 by Fe3 O4 /SiO2 nanoparticles. (b) Lane 1 –10 : PCR products using purified DNA of EBV
from serum samples from number 1 to 10 by Dynabeads.
45
Number 7 by dynabeads
40
Threshold cycle
PCR base line subtracted curve fit RFU
Amplification chart
5000
4500
4000
3500
3000
2500
2000
1500
1000
500
0
(+)
108
107
10
6
4
10
3
1
2
105
103 4 (−)
Number 7 by nanoparticles
35
30
Number 10 by dynabeads
Number 10 by nanoparticles
25
20
15
0
5
10
15
20
25
Cycle
30
35
40
45
2
4
6
8
Log starting quantity, copy number
10
Unknown
Standard
(a)
(b)
Figure 7: Real-time PCR for qualitative measurement EBV virus load using DNA templates purified by Fe3 O4 /SiO2 nanoparticles and
Dynabeads. (a) Amplification chart of EBV-74 fragments specific for EBV from sample 7, sample 10, standards, and positive and negative
controls. (+): PCR product of positive control pGEM-EBV-74 at 5 × 10⁸ copies/mL, (−) negative controls, 103 to 108 copies/mL were labeled
next to each respective amplification curves of standards. (b) Linear regression line based on standards and featured with samples 7 and 10
purified by Fe3 O4 /SiO2 nanoparticles and Dynabeads (𝑅2 = 0.996). 1, 2, 3, and 4 were labeled next to amplification curves of samples number
7 by Nanoparticles, number 7 by Dynabeads, number 10 by Nanoparticles, and number 10 by Dynabeads, respectively.
PCR based on highly specific Taqman probe dually labeled
with FAM at 5 -end and TAMRA at 3 -end was performed
with samples 7 and 10 to quantify the EBV virus load. As
shown in the amplification chart of Figure 7, the negative
control had no amplification curve while the positive control
had an amplification curve occurring earlier (𝐶𝑡 = 15.65).
All standards together with samples 7 and 10 purified by
both particles had amplification curves. The linear regression
line of standards had 𝑅2 = 0.996 value, indicating that
the reliability of the qualitative measurement for EBV virus
load was high. The concentration of EBV in sample 7
using DNA purified by Fe3 O4 /SiO2 nanoparticles (= 7.17 ×
103 copies/mL), although this was much lower than that in
sample 10 (= 1.18 × 10⁶ copies/mL), but was not too low
because it fell in the range of standards. Nanoparticles
are therefore suitable for isolating DNA at such low virus
concentration. The result in Table 1 indicates that higher
concentrations of EBV (copies/mL) in both samples were
measured with using Fe3 O4 /SiO2 nanoparticles to purify
DNA compared to those with using Dynabeads. The increase
in DNA isolation efficiency by Fe3 O4 /SiO2 nanoparticles is
likely due to a larger total surface of silica-coated magnetic
nanoparticles. During the process of DNA isolation, we have
found that the time required for magnets to attract completely
the Dynabeads from solution was much longer, about 23 min, compared to 15–20 s for Fe3 O4 /SiO2 nanoparticles.
This phenomenon is probably also due to the fact that
Fe3 O4 /SiO2 nanoparticles have a larger total surface area
compared to that of the Dynabeads.
4. Conclusion
Our study demonstrates that Fe3 O4 /SiO2 nanoparticles and
the optimized buffers can isolate genomic DNA of two types
6
of viruses, HBV and EBV, for further PCR-based detection
of the viruses in serum samples. The obtained primary
data indicates that Fe3 O4 /SiO2 nanoparticles provided better
sensitivity and were time saving in detection of HBV and
EBV, compared to that of the commercialized silica-coated
magnetic microparticles. Further experiments on nucleic
acid isolation of other pathogenic viruses infected in blood
using the Fe3 O4 /SiO2 nanoparticles are in progress.
Conflict of Interests
The authors declare no conflict of interests.
Acknowledgments
The authors would like to thank the Vietnam Ministry of
Science and Technology (Project 2/2010/HD-NCCBUD) for
financial support. They also thank Luu Manh Quynh of VNU
University of Science, Vietnam, for technical assistance and
Professor Simon Cutting of Royal Holloway University of
London, UK, for critical reading of the paper.
References
[1] R. Boom, C. J. A. Sol, M. M. M. Salimans, C. L. Jansen, P.
M. E. Wertheim-van Dillen, and J. van der Noordaa, “Rapid
and simple method for purification of nucleic acids,” Journal of
Clinical Microbiology, vol. 28, no. 3, pp. 495–503, 1990.
[2] J.-I. Akutsu, Y. Tojo, O. Segawa et al., “Development of an
integrated automation system with a magnetic bead-mediated
nucleic acid purification device for genetic analysis and gene
manipulation,” Biotechnology and Bioengineering, vol. 86, no. 6,
pp. 667–671, 2004.
[3] P. Ashtari, X. He, K. Wang, and P. Gong, “An efficient method
for recovery of target ssDNA based on amino-modified silicacoated magnetic nanoparticles,” Talanta, vol. 67, no. 3, pp. 548–
554, 2005.
[4] R. Caldarelli-Stefano, L. Vago, S. Bonetto, M. Nebuloni, and G.
Costanzi, “Use of magnetic beads for tissue DNA extraction and
IS6110 Mycobacterium tuberculosis PCR,” Molecular Pathology,
vol. 52, no. 3, pp. 158–160, 1999.
[5] D. van Baarle, E. Hovenkamp, M. J. Kersten, M. R. Klein,
F. Miedema, and M. H. J. van Oers, “Direct Epstein-Barr
virus (EBV) typing on peripheral blood mononuclear cells: no
association between EBV type 2 infection or superinfection
and the development of acquired immunodeficiency syndromerelated non-Hodgkin’s lymphoma,” Blood, vol. 93, no. 11, pp.
3949–3955, 1999.
[6] N. H. Hai, N. D. Phu, N. H. Luong et al., “Mechanism for
sustainable magnetic nanoparticles under ambient conditions,”
Journal of the Korean Physical Society, vol. 52, no. 5, pp. 1327–
1331, 2008.
[7] A. Abe, K. Inoue, T. Tanaka et al., “Quantitation of hepatitis
B virus genomic DNA by real-time detection PCR,” Journal of
Clinical Microbiology, vol. 37, no. 9, pp. 2899–2903, 1999.
[8] P. T. Nghia, K. T. Nga, N. T. H. Loan et al., “Multiplex (RT)-PCR
assay for detection of co-infection of HBV, HCV and HIV in
blood samples,” VNU Journal of Science, Natural Sciences and
Technology, vol. 24, no. 2, supplement, pp. 377–383, 2008.
Journal of Nanomaterials
[9] H. G. M. Niesters, J. van Esser, E. Fries, K. C. Wolthers, J.
Cornelissen, and A. D. M. E. Osterhaus, “Development of a
real-time quantitative assay for detection of Epstein-Barr virus,”
Journal of Clinical Microbiology, vol. 38, no. 2, pp. 712–715, 2000.
[10] N. H. Luong, N. D. Phu, N. H. Hai, and N. T. D. Thuy, “Surface
modification of SiO2 -coated FePt nanoparticles with Amino
Groups,” e-Journal of Surface Science and Nanotechnology, vol.
9, pp. 536–538, 2011.
Copyright of Journal of Nanomaterials is the property of Hindawi Publishing Corporation and
its content may not be copied or emailed to multiple sites or posted to a listserv without the
copyright holder's express written permission. However, users may print, download, or email
articles for individual use.