The Determinants of Customer Satisfaction When Purchasing In store Cosmetics in Vietnam
Bạn đang xem bản rút gọn của tài liệu. Xem và tải ngay bản đầy đủ của tài liệu tại đây (367.8 KB, 14 trang )
VNU Journal of Science: Education Research, Vol. 32, No. 5E (2016) 76-89
The Determinants of Customer Satisfaction
When Purchasing In-store Cosmetics in Vietnam
Pham Thi Lien*, Do Ngoc Bich
VNU International School,
144 Xuan Thuy Str., Cau Giay Dist., Hanoi, Vietnam
Received 22 November 2016
Revised 02 December 2016, Accepted 22 December 2016
Abstract: This study attempts to explore the determinants of customer satisfaction when customers
purchase cosmetics in-store in Vietnam market. Additionally, this paper also explores the
relationship of constructed variables with the main variable - customer satisfaction. This research
adopts the quantitative research method. The data was collected from 300 clients who directly
purchased the cosmetics in-store in the big cities of Hanoi, Ho Chi Minh City and Da Nang. Half of
questionnaires were handed out at stores by the researchers and the rest was distributed on a beauty
forum (social media) to maintain the validity and reliability of the collected data. The results of this
study explored and confirmed the influences of visual appearance, marketing mix and service
quality in forming customer satisfaction. Also, this paper highlights the combination of
marketing and branding activities in generating customer satisfaction in cosmetic purchase.
Keywords: Customer satisfaction, cosmetics, marketing mix, service quality.
1. Introduction *
of using unbranded products [2]. Many scandals
of cosmetic containing toxic ingredients, being
fake products and cheap beauty care have been
revealed in authority channels; the customers, as
a consequence, pay more attention to reliable
sources of the products and also have followed the
trend of using international brands. Moreover,
customers now might access the products on a
huge number of information sources [3] regarding
benefits of using suitable cosmetics [4]. Hence,
these factors have led to the growth in the sale
revenue of the cosmetic industry in Vietnam in
particular.
Secondly, the change in distribution method
is also a determinant of the growing demand for
cosmetics in Vietnam. In the period 2015-2016,
there was a dominance in E-commerce
penetration [4], especially social media trading
[2]. Regarding store purchases, people can
The cosmetic industry in Vietnam, before
1997, received little attention from both
international and domestic brands due to the
low standard of living and economic strain.
However, after 20 years, this industry has
become an active and healthy market with the
growth rate nearly 115% compared to 2007 [1].
There are three reasons for this explosive
growth: economic development, marketing
activities and the shift in distribution.
Firstly, dynamic marketing activities
generate multi-faceted information leading
manufacturers, media agents and the customers
to be more aware of the negative consequences
_______
*
Corresponding author. Tel.: 84-983820460
Email:
76
P.T. Lien, D.N. Bich / VNU Journal of Science: Education Research, Vol. 32, No. 5E (2016) 76-89
easily find any labeled or branded cosmetic in
any department store in cities such as Hanoi
and Ho Chi Minh City. Economic development
plays a key role in enabling the buying power
of Vietnamese consumers. With a population of
91.7 million people, Vietnam has reached a
GDP growth rate of over 6.7% in 2016 [5]. The
indexes shows that the Vietnamese standard of
living has been improved significantly
compared to the late 1970s. This has led to the
increasing demands for beauty products
particularly and other products generally.
Since the high demand in the market,
cosmetic firms are now striving to continuously
innovate to maintain the success of their
companies. Kotler (2001) has mentioned that
there are many factors leading to the success of
an organization such as: strategy, information
system, and dedicated employees [6]. However,
the key element is generating customer
satisfaction. In addition, there will be huge
opportunities for firms to expand their
businesses after the TPP (Trans-Pacific
Partnership) agreement. This paper studies the
determinants of customer satisfaction when
purchasing in-store cosmetics in Vietnam in
order to partly help the beauty firms to improve
their quality of services and generate business
sustainability.
77
expectations, first estimations of future results
[11], and real-time experiences.
Building and retaining customer satisfaction
is considered as one element in strategic
planning. According to the research of Fornell
(2007), the cost of attracting new customers is
five times greater regarding money and a firm’s
resources than maintaining the current ones
with satisfaction [8]. Yet, focusing deeply on
satisfying customer expectations can result in
some negative consequences such as neglect of
the fiscal result [12] or paying little attention to
expanding the market share [8]. Therefore,
managers need to be aware of the pros and cons
in balancing activities within firms.
Brand value consists of tangible and
intangible value; and customer satisfaction is
categorized as an intangible value of the firm
and brand [8, 13]. There are four explanations
for how customer satisfaction might influence
the overall profitability of an organization:
protection from rivals, long-term profit from
frequent purchases [14], customer avoidance
shifts and gaining a lost market [15]. Since
there are advantages in retaining customer
satisfaction, firms are required to research
consumer
behavior
using
“up-to-date
perceptions” to persuade them to spend money
on the products and services [16].
2.2. Introduction of marketing mix
2. Literature review
2.1. Customer satisfaction
Satisfaction has been defined and measured
in various ways over time [7]. Previous
research defined satisfaction as the experience
of consumers [8, 9] between customer
expectations (or standards for the expression)
and after-use experiences [10]. Kotler (2001)
mentioned in his book that satisfaction is the
“joy or frustration that results from a
comparison with the current perception of food
in relation to their expectations” [6]. The levels
of satisfaction response are varied among
individuals [10] as the discrepancies in
Marketing mix consists of four P(s):
product, place, promotion and price. The
earliest marketing mix theory was researched
by Professor Jerome McCarthyin (1960) and
has been continuously studied by various
authors to explore the relationship and the
additional factors [17, 18, 19]. Going back to
the original 4Ps, products are regarded as a
bundle of benefits, which firms offer to the end
user [20]. Price means the price strategy which
the organization has decided as the offered
value for the customer. Place refers to the
distribution strategy while promotion refers to
the communication plan to help firms approach
current and future customers [3]. The
mentioned 4Ps are commonly emphasized in
the marketing mix in the marketing process.
78
P.T. Lien, D.N. Bich / VNU Journal of Science: Education Research, Vol. 32, No. 5E (2016) 76-89
2.3. Previous models of customer satisfaction
The European Customer Satisfaction
Framework Model
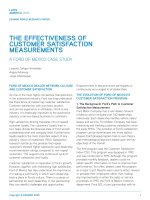
The model of customer satisfaction is a
model that can be described in a path diagram
to analyze a set of relationships between
variables. It differs from a simple path analysis
for all variables are latent variables measured
by many indicators, the model Index U.S.
customer satisfaction (Figure 1) is a measure of
the industry between customer satisfaction with
the quality of U.S. goods and services they
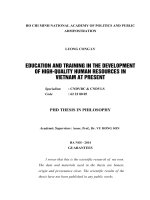
purchase and use [21] and customer satisfaction
in Europe is an economic indicator, represented
in the index (Figure 2).
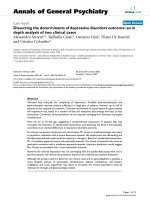
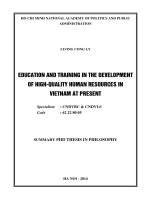
FACS Model
In the paper of Hokanson (1995), the author
has developed a comprehensive model
illustrating the factors influencing customer
satisfaction [23]. There are eleven factors,
including friendly staff, courteous staff,
knowledgeable staff, helpful staff, the accuracy
of payments, prompt payment, competitive
prices, service quality, better value and payment
of a clear and quick service. These eleven
factors have been listed and researched in the
study and Figure 3 below presents the findings
of Hokanson. Compared to the previous model,
European Customer Satisfaction, the former
emphasizes how pre-purchase factors influence
customer satisfaction; while the latter focuses
on the experience in-store. The research was
conducted in the banking sector; hence, the
model does not have generalization to other
contexts [24], and so it is worth examining the
customer satisfaction determinants in other
situations and sectors.
2.4. The determinants of customer satisfaction
Figure 1. The American
Customer Satisfaction Framework.
Source: Anderson et al. (2000) [22]
Figure 2. The European Customer
Satisfaction Framework.
Source: Bryant (1995) [21]
Brand name and design
The recent research of Neilsen (2014)
confirmed the crucial role of brand name and
reputation [25]. The research accounts for 80%
of Vietnamese consumers preferring to
consume and be satisfied with familiar brand
names compared to wholly-new brands. In the
same line, the research of Keller and Lehmann
(2006) agreed that products from famous
brands are likely to be beneficial and have a
high sales return [26]. These well-known
brands are more likely to attract the attention
and interest of consumers [27]. In addition, the
value of the brands is not in their product
portfolio, it is in the emotional connections of
the brand to its customers as regards
satisfaction feeling [28]. Therefore, the
researcher constructs the first hypothesis below:
H1: There is a significant and positive
relationship between the brand name of
cosmetics and satisfaction.
When it comes to the design, according to
research by Duff (2007) who investigated the
P.T. Lien, D.N. Bich / VNU Journal of Science: Education Research, Vol. 32, No. 5E (2016) 76-89
niche market in cosmetics, results show that
cosmetic buyers have become more fashion
conscious and require the design of products to
be more attractive [29]. More consumers tend to
use different makeup designs for different
occasions. The sense of ‘trendy’ is usually
defined as an awareness of new designs, fashion
changes, and sleekness, as well as being eager
to buy something interesting and trendy. The
second hypothesis is developed as follows:
H2: There is a significant and positive
relationship between cosmetics’ design and
satisfaction.
Figure 3. Hokanso’s model of customer satisfaction.
Service quality
Service quality is one important factor in
determining customer satisfaction. Parasuraman
et al. (2005) [30] confirmed that service quality
is an important factor determining customer
satisfaction.
The
relationship
between
salespeople and customers affects the long-term
habit of customers shopping in the store with
their favorite services. In the same vein with
Parasuraman, in the model of Wilson et al.
(2008), five factors affecting customer
satisfaction were explored such as: service
quality, product quality, price and personal and
situational factors [31]. If the expectation is
higher than the performance of services, and
lower quality of service is the response,
customers will be dissatisfied [32]. Service
quality is the determinant of customer
satisfaction in the American Customer
Satisfaction Framework and The European
79
Customer Satisfaction Framework which are
mentioned in section 2.3 of this paper. Thus the
third hypothesis is developed as follows:
H3: There is a significant and positive
relationship between service quality and
satisfaction.
4Ps in marketing strategy
Product quality is the core value of the
benefit bundle delivered by an organization to
customers. Depending on the needs and
requirements of users, each product/service will
meet expectations in a different way (Russell
and Taylor, 2011) [33]. In the model of Wilson
et al. (2008) [31], they explored the notion that
product quality is one of the main antecedents
in determining the level of satisfaction after use.
Also, the product/service is considered as the
solution for the problems of users (Levitt, 1960
cited by Grant, 1999) [20]. If buyers can solve
their problem, as a consequence they will be
satisfied. Hokanson (1995) [23] in his customer
satisfaction model also mentioned price and
part of the product policy as satisfaction’s
determinants. Hence, the fourth hypothesis will
be constructed as follows:
H4: There is a significant and positive
relationship between product quality and
satisfaction.
Regarding the price in the 4Ps, price is an
important factor for customers when choosing
products [27]. Customers are likely to be
willing to spend more money on branded
products and favourite brands [26]. However, in
general, customers perceive price as a tool to
measure the received value when buying a
particular product/service [34]. Therefore, the
fifth hypothesis was developed:
H5: There is a significant and positive
relationship between cosmetics’ price and
customer satisfaction.
Promotion refers to the communication
strategy used in the marketing mix. In fact,
marketers need to conduct a range of activities
from advertising, public relation, direct
marketing, personal selling to promotion [35] as
IMC (integrated marketing communication).
The communication campaign affects customer
images, beliefs and attitudes to the products and
80
P.T. Lien, D.N. Bich / VNU Journal of Science: Education Research, Vol. 32, No. 5E (2016) 76-89
brands, which leads to the purchase behavior of
customers [36]. Each day, one person is
approached by more than 3,000 marketing
messages [37] and this has an influence on the
personal perceptions and purchase decision [38]
of the customer. Therefore, it is worthwhile to
conduct this hypothesis to test in this study:
H6: There is a significant and positive
relationship
between
promotion
and
satisfaction.
Lastly, the place in the 4Ps indicates the
distribution channels and strategies of brands or
firms. It also includes the store locations and
operations, in this research context, for the
cosmetic products available. As Chung and Lee
(2003) stated, the location is a crucial element in
the marketing mix that influences customer
satisfaction [39]. In the same line with Chung et
al, the main aim of distribution channels generates
convenience in buying [2]. As a result, the level of
satisfaction will increase. This study will test the
hypothesis below to confirm the role of place in
enhancing customer satisfaction.
H8: There is a significant and positive
relationship between place and customer
satisfaction.
Store environment
The term “store environment” was
introduced by Kotler (1973), as a marketing
tool, in order to influence the five basic human
senses when purchasing in-store products [40].
There are number of scholars who have studied
and discovered the variables in store
environment such as window display [41],
entrance design [42] or staff appearance [43]
that influence the shopping behavior of
customers. Previously, the studies of Chang
(2000) and Heung and Gu (2012) determined
the relationship of store environment with
customer satisfaction in a leisure setting and
restaurant context [44, 45]. Two studies have
found that there was a significant relationship
between those two variables. Yet, the paper of
Andaleeb and Conway (2006) found contrary
results compared with the two mentioned [46].
Hence, in this research, the author would like to
construct the seventh hypothesis as below:
H7: There is a significant and positive
relationship between store environment and
customer satisfaction.
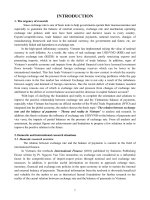
With these 8 above hypotheses, we draw a
model to illustrate the relationships of proposed
determinants towards the customer satisfaction
as Table 4.
Figure 4. Hypothesis framework.
Source: Authors’ proposal
3. Methodology
3.1. Research design
This paper adopted the quantitative research
method to examine the variables influencing
customer satisfaction. The research aims to explore
the relationships between variables, hence, the
quantitative method is suitable to test the model
[47]. Table 1 below presents the measured items in
this research.
All items used to measure the variables adopt
the 5 point Likert-Scale: completely disagree,
disagree, not identified, agree, totally agree.
3.2. Data collection
The purpose of this study is to assess these
factors influencing the customer’s satisfaction
when buying cosmetics in-store, in Vietnam.
Hence, the survey designed a questionnaire
targeting specifically customers at cosmetics
stores. After the questionnaire was carefully
designed, it was sent directly to customers
shopping at the cosmetics stores.
P.T. Lien, D.N. Bich / VNU Journal of Science: Education Research, Vol. 32, No. 5E (2016) 76-89
81
Table 1. Variables in the research
Variable
Brand name
Product
quality
Price
Promotion
Service
quality
Design
Store
environment
Place
Customer
satisfaction
Items
BR
BR2
BR3
PQ1
PQ2
PQ3
P1
P2
P3
PP1
PP2
PP3
SQ1
SQ2
SQ3
D1
D2
D3
SE1
SE2
SE3
SE1
SE2
SE3
CSA1
CSA2
CSA3
The brand is reputable
Brand name and image attract me to purchase
Brand name is selected regardless of price
The brand last longer than other brands
The materials used by the brand are natural
The brand has sufficient color
Increases of price do not hinder me purchasing
The brand provides goods value for money
The price associated with the brand
Ads of the brand are attractive
Ads of the brand attract me to purchase
Window displays are attractive
Salesperson of the store is well-trained
Salesperson of the store willing to help
Salesperson of the store friendly and courteous
The brand provides wide variety of designs
Designs of the brand are suitable for me
Designs of the brand have distinctive features
The brand has a good store location
The brand has sufficient outlets
The interior display is attractive
The brand has a good store location
The brand has sufficient outlets
The interior display is attractive
Overall how satisfied are you with products and services?
How close is the cosmetic to your ideal postal service provider?
Considering your expectations, to what extent has the cosmetic
fallen short of or exceeded your expectations
Source
Keller, 2003
[48]
Russell and
Taylor, 2006
[33]
Russell and
Taylor, 2006
[33]
Frings, 2005
[49]
Lovelock, 2010
[36]
Frings, 2005
[49]
Frings, 2005
[49]
Frings, 2005
[49]
Christina
O’Loughlin,
2002 [50]
o
Some 300 clients were randomly selected
from a list of customers in the cosmetics stores.
150 questionnaires were sent directly and
handed to customers, 150 questionnaires were
sent via email and respondents were asked to
answer all the questions in the questionnaire.
Only those questionnaires that were answered
fully have been used to conduct the analysis.
After gathering information, the correctly
completed questionnaires that were retained and
inappropriate surveys were discarded.
3.3. Data analysis method
Descriptive statistics
After the data was collected, it was
analyzed using the first method, descriptive
analysis, including personal information such as
gender, age and experience. The data was then
analyzed with percentile distribution to assess
the distribution of age, gender and experience
related to how the clause in their research.
Factor analysis
Factor analysis is used in data analysis;
there are different methods of analysis for
factor analysis. Kim and Mueller (1978)
suggested that the number of elements found as
a result of the analysis process, determined
based on the value of the Eigen value, must be
greater than one [51]. However, Tucker et al.
(1969) offer a different perspective, which is
that a number of factors can be identified
earlier, based on the purpose of the research
study [52]. In this study, the researchers will
conduct the factor analysis method predetermined by several factors.
82
P.T. Lien, D.N. Bich / VNU Journal of Science: Education Research, Vol. 32, No. 5E (2016) 76-89
Reliability analysis
In order to ensure reliability, the authors
conducted an analysis of the data reliability
based on Cronbach’s α values. If the
Cronbach’s α value greater than 0.7, the
variables can be accepted. The Cronbach’s α
smaller than 0.35 means that the reliability of
the variable is very low and should be
removed [53].
Regression analysis
After analyzing the accuracy and reliability,
the researcher used the regression analysis
method to test and evaluate the assumptions.
Regression analysis is a statistical method, used
to analyze the correlation between two factors.
4. Data analysis
4.1. Descriptive data
The demographics of organizations and
customers include four major demographics: (1)
Marital, (2) Age, (3) Education, (4) Income.
The results of the collected data is illustrated in
Table 2.
Table 2. Characteristics of sample demographics
Measure
Item
Marital
Age
Education
Income
Frequency
Percentage (%)
Married
102
59.6
Unmarried
Below 20
69
34
40.4
12.3
20-30
37
20.5
30-40
18
6.4
40 - 50
52
19.3
Above 50
30
17.5
Never
21
12.3
High school
35
20.5
College
Bachelor
11
33
6.4
19.3
Other
71
41.5
2 million
52
30.4
2-3 million
39
22.8
3-4 million
9
5.3
4-5 million
38
22.2
over 5 million
33
19.3
Source: Authors’ calculation from SPSS results
P.T. Lien, D.N. Bich / VNU Journal of Science: Education Research, Vol. 32, No. 5E (2016) 76-89
83
Table 3. Reliability test
Factors
Customer satisfaction
Services quality
Design
Product
Price
Promotion
Brand name
Place
Store environment
Itemstest
Table 3: Reliability
Cronbach’s α
0.911
0.841
0.869
0.813
0.882
0.882
0.849
0.829
0.851
3
3
3
3
3
3
3
3
3
Source: Authors’ calculation from SPSS resuls
Table 4. VARIMAX rotated component analysis (Factor-loading matrix)
csa1
csa2
csa3
sq1
sq2
sq3
dn1
dn2
dn3
prd1
Prd2
prd3
prt1
Prt2
prt3
pri1
pri2
pri3
bran1
bran2
bran3
Pl1
Pl2
pl3
str1
Str2
str3
Customer
satisfaction
.567
.700
.720
Service
quality
Design
Products
Promotion
Price
Brand
name
Place
Store
environment
.790
.826
.763
.808
.826
.829
.780
.822
.823
.704
.814
.813
.791
.836
.853
.811
.808
.768
.862
.750
.678
.838
.750
.757
Source: Authors’ calculation from SPSS results
P.T. Lien, D.N. Bich / VNU Journal of Science: Education Research, Vol. 32, No. 5E (2016) 76-89
84
4.2. Reliability analysis
4.4. Regression analysis
The purpose of reliability analysis is to test
the reliability of the elements and scale
consistent with the questions provided. The
reliability of a factor can be determined based
on the value of AVE or Cronbach's α value. The
accepted value should be in the range of 0.7 to
0.9 to confirm the reliability of all results [53].
From Table 3, the results show that all
factors achieved good reliability. Therefore, the
authors will conduct further analysis to test the
relationship between variables.
Regression analysis is a statistical analysis,
to determine the independent variables
(explanatory variables) are defined as the
dependent variable. To test these hypotheses,
this study adopted a significance level of 5%,
which means that if the p-value is less than
0.05, then the independent variables have a
significant effect on the variable side. If not,
they do not have a significant relationship.
The results of linear regression analysis
factors: Design, Product, Promotion, Price,
Brand name, Place, Store environment with
customer satisfaction are shown in Table 5.
The final model shown in Table 5 had a
good overall fit (F = 35.375, p = 0.000). At a
significance level of 0.05, Design, Product,
promotion, price, brand name, place (H1, H2,
H3, H4, H5, H6, H8) have a significant positive
relationship with Customer satisfaction.
Therefore, H1, H2, H3, H4, H5, H6, H8
hypotheses are supported. Store Environment
(H7) has a significant level of > 0.05, so H7
hypotheses was not supported.
The research framework with beta
coefficients can be shown as in Figure 5.
4.3. Factor analysis
The purpose of factor analysis can be used
to determine the structure of relationships
between elements in the model. According to
Pallant (2016), the load of each variable value
greater than 0.5 are acceptable values and the
load of each variable lower than 0.5 should be
removed from the structure [54]. In this study,
seven elements and the 26 items were tested to
examine the relationship of structure and
measurement of the item. The results are shown
in Table 4.
From Table 4, all items achieved factor
loadings greater than 0.5, and so all can be
accepted.
Table 5. Linear regression analysis
Design
St.
coefficients β
.145*
Product
.182*
2.600
promotion
.236**
2.817
Price
.212**
3.012
Band name
.227**
2.961
Place
.230**
2.967
STO
.045+
.630
Service
.203**
2.728
Constructs
t value
R2
Adj-R2
F value
.636
.618
35.375***
2.065
Source: Authors’ calculation from SPSS results
Dependent variable: perceived ease of use
*** p < 0.001, ** p < 0.01, * p < 0.05, 0.05 < +p < 0.1
P.T. Lien, D.N. Bich / VNU Journal of Science: Education Research, Vol. 32, No. 5E (2016) 76-89
Brand name
Design
Services quality
.227**
.145*
.182*
Customer
satisfaction
.236**
Product
Promotion
.212**
.230**
.203**
85
Price
Place
Figure 5. Path coefficients for research model.
(Path significance ***p < 0.001, * p< 0.05)
Source: Authors’ calculation from SPSS results
j
4.5. ANOVA test
ANOVA test is used to analyze whether
different segment of the samples will have
different reactions on the variables. The
samples vary regarding income and the
purchase experience in-store. To be specific,
based on the samples’ frequency of visiting the
site, we separated them into five segments, 2
million/month,
2-3
million/month,
3-5
million/month, over 5million/month. The
authors used ANOVA test for investigating the
effect of samples’ income as well as purchase
experience on Customer satisfaction, Service
quality, Design, Product, Promotion, Price,
Place, Brand name, and Store environment. The
results are summarized in Table 6.
From the result shown above, at a
significance level of 0.05, it can be seen that if
samples have different incomes, then they tend
to have a different reaction to the variables,
including customer satisfaction, service quality,
design, product, promotion, price, brand name,
store environment, place.
5. Conclusion
5.1. Research result
From the result shown above, at
significance level of 0.05, we can see that when
samples show differences income, then they
tend to have different reaction to the variables,
including customer satisfaction, service quality,
design, product, promotion, price, brand name,
store environment, place.
It can be seen that H7 was not supported;
hence, the author can conclude that the store
environment does not have a positive influence
on overall customer satisfaction. Regarding the
rest of the hypotheses, from H1 to H6 and H8
were supported, therefore, they have a positive
effect on customer satisfaction.
When it comes to visual appearance, brand
name and design of product were found to have
a crucial influence on customer satisfaction.
This result is in the same vein with Ang and
Lim (2006) [55] - study of brand recognition,
Lau and Phau (2010) [56] - study of effect of
brand image, Rompay and Veltkamp (2014)
[57] - study of the importance of packaging in
purchase decision. The results enrich the
knowledge with regard to the role of design in
customer fulfillment.
From the study, it showed that the 4Ps have
a positive influence on customer satisfaction
overall. Theoretically, marketing activities aim
to satisfy customer needs, wants and to retain
the relationship with the customer and
consumers [2].
86
P.T. Lien, D.N. Bich / VNU Journal of Science: Education Research, Vol. 32, No. 5E (2016) 76-89
Table 7. Summary of tested results
Hypotheses
Results
H1:
There is a significant and positive relationship between the brand name of cosmetics and
satisfaction
Supported
H2:
There is a significant and positive relationship between cosmetics design and satisfaction
Supported
H3:
There is a significant and positive relationship between service quality and satisfaction
Supported
H4:
There is a significant and positive relationship between product quality and satisfaction
Supported
H5:
There is a significant and positive relationship between cosmetics’ price and customer
satisfaction
Supported
H6:
There is a significant and positive relationship between cosmetics’ promotion and
customer satisfaction
Supported
H7:
There is a significant and positive relationship between Store Environment and customer
satisfaction
Not
Supported
H8:
There is a significant and positive relationship between cosmetics’ place and customer
satisfaction
Supported
j
The results of this study are compatible
with previous papers [2, 38, 58]) regarding the
role of the 4PS in generating customer
satisfaction.
Regarding the store environment, the study
was conducted in a cosmetic in-store selling
context. It was found that the store environment
does not have an influence on customer
satisfaction, which is in the same vein with the
study of Andaleeb and Conway (2006) [46].
Yet, this result contradicts the previous studies
in a restaurant context by Chang (2000) [44]
and leisure setting by Heung and Gu (2012)
[45]. The difference can be explained by the
unique experiences of the different contexts in
which the studies were conducted.
5.2. Research implications
This paper combined factors influencing
customer satisfaction researched in previous
studies to create a research framework in order
to explore the determinants of customer
satisfaction when customers purchase cosmetics
in-store in the Vietnam market. The result will
be beneficial for the cosmetic retailer in general
regarding the influencing elements of brand and
marketing on customer satisfaction. As Aaker
(1996) mentioned in his articles, customer
loyalty, the consequence of customer
satisfaction, is an intangible value of a brand
[59]. Hence, the retailer and brand might
determine the factors in services and physical
attributes to improve what the customer
experiences when buying cosmetics at stores
especially in the Vietnam market.
The study explored the significant effect of
visual appearance and marketing activities on
customer satisfaction. Firstly, regarding visual
appearance, brand name and design play a
crucial role for the first impression in store
purchasing. From the results of this study, the
design of product and packaging need to be
considered as one factor influencing the
purchase decision and customer satisfaction. As
is shown in Rompay and Veltkamp’s research
(2014) [57], in an ambiguous metaphoric
packaging, supplementary explanation will
enhance the consumer’s appreciation and raise
their positive attitudes toward the brand
personality, while a metaphoric packaging cue
can draw more attention and increase the brand
excitement. In addition, the design is required
to be consistent with the brand image/name,
which is built from a range of branding and
marketing communication activities. This will
be very useful for the elaboration of a
marketing
plan,
advertising
and
the
construction of a development strategy for
selling cosmetic products in Vietnam.
P.T. Lien, D.N. Bich / VNU Journal of Science: Education Research, Vol. 32, No. 5E (2016) 76-89
Last but not least, each factor in the
hypotheses model was under analysis and
measurement to evaluate the influences and
the importance level of each factor. Based on
the results, a business can monitor and
control the effects of customer’s satisfaction
through these elements.
5.3. Limitations of this study and further research
As other papers, this research cannot avoid
limitations during the research progress. Firstly,
this study focused on collecting data from big
cities in Vietnam such as Hanoi, Ho Chi Minh
City and Da Nang; hence, other smaller
provinces and cities were neglected. Future
research is expected to collect information from
all provinces in Vietnam to generate a
comprehensive picture and confirm the
generalization of the findings.
Secondly, the data analysis only evaluated
the Cronbach Alpha, factor analysis and the
multiple linear regression method. Future
research might adopt other techniques to test
the collected data.
Finally, the authors found that the factors
that impact customer satisfaction alter day by
day as a result of the customers’ need,
expectation and personal emotions - especially
the fashion factor. Therefore, it is worth
examining the other possible factors affecting
customer satisfaction which are not yet stated in
this study in other contexts.
References
[1] Euromonitor International, “Sample Report for
Illustration
only”,
Available
at:
/>ples/sample_report_beauty_personal_care.pdf
(Accessed: 22 December 2016).
[2] Passport, “Beauty and personal care in Vietnam”,
Available
at:
/>tab (Accessed: 22 December 2016).
[3] Kotler, P. & Armstrong, G., Principles of
marketing, Sixteenth; Global ed., Pearson, Harlow,
Essex, England, 2016.
87
[4] World
Bank
Vietnam,
Available
at:
/>(Accessed: 21 December 2016).
[5] Kotler, P., Marketing Management, 10th ed., New
Jersey, Prentice-Hall, 2001.
[6] Oliver, R.L., Satisfaction: A Behavioral
Perspective on the Consumer, New York: Printce
Hill, 1997.
[7] Fornell, C., The satisfied customer: Winners and
losers in the battle for buyer preference, Palgrave
Macmillan, 2007.
[8] Tse D. K. & Wilton P. C., “Models of Consumer
satisfaction Formation: An Extension”, Journal of
Marketing Research, 25 (1998), 204-212.
[9] Olsen, S.O, “Comparative Evaluation and the
Relationship Between Quality, Satisfaction and
Loyalty”, Psychology & Marketing, 22 (2002),
247-268.
[10] Ekini, Y., Dawes, P. and Massey, G., “An extended
model of the antecedents and consequences of
consumer satisfaction for hospitality and services”,
European Journal of Marketing, 42 (2008) 1/2, 35-38.
[11] Luk Chung-Leung, Yau OHM, Chow RPM, Tse
ACB, Sin LYM, “Stakeholder orientation and
business performance: The case of service companies
in China”, J Int Mark 13 (2005) 1, 89-110.
[12] Fornell, Claes, “A National Customer Satisfaction
Barometer: The Swedish Experience”, Journal of
Marketing, 56 (January 1992), 1-21.
[13] Fombrun, C., Reputation - Realizing value from the
corporate image, Boston, Mass: Harvard Business
School Press, 1996.
[14] Lele, M.M. and Sheth, J.N., The customer is key:
Gaining an unbeatable advantage through customer
satisfaction, New York: John Wiley & Sons, Inc.,
1991, 23-45.
[15] Bolton, Ruth N., “A Dynamic Model of the
Duration of the Customer’s Relationship with a
Continuous Service Provider: The Role of
Satisfaction”, Marketing Science, 17 (Winter
1998), 45-65.
[16] ISO 9000 Quality Systems Handbook (5th ed.).
Measuring Business Excellence. 2008, 12:78-78.
[17] Li Fei, Wang Gao, “4Ps Research on Improvement
of the Marketing Mix Model”, Management
World, 2006, 9-16.
[18] Liu Fang, Yan Jian-ren, “Product Value and
Marketing Strategies”, Market Modernization,
2007: 188.
[19] Stanley F. Slater, G. Tomas, M. Hult, Eric M.
Olson, “Factors Influencing the Relative
Importance of Marketing Strategy Creativity and
88
[20]
[21]
[22]
[23]
[24]
[25]
[26]
[27]
[28]
[29]
[30]
[31]
[32]
[33]
P.T. Lien, D.N. Bich / VNU Journal of Science: Education Research, Vol. 32, No. 5E (2016) 76-89
Marketing Strategy Implementation Effectiveness”,
Industrial Marketing Management, 2009 (3).
Grant C., “Theodore Levitt’s marketing myopia”,
Journal of Business Ethics, 1999, 18-397.
Bryant, E. Barbara, “American Customer
Satisfaction Index: Methodology Report”, National
Quality Research Center. University of Michigan
Business School. An Arbor, MI 48109-1234, 1995.
Anderson, E. W., Fornell, C., Foundations of
the American Customer Satisfaction Index”,
Journal of Total Quality Management, Vol.
11, 7, 869-882, 2000.
Hokanson, S., “The Deeper You Analyse, The
More You Satisfy Customers”, Marketing News,
January 2, 1995, p. 16.
Mohsan, F., Nawaz, M.M., Khan, S.M., Shaukat,
Z. and Aslam, N., “Impact of customer satisfaction
on customer loyalty and intentions to switch:
Evidence
from
banking
sector
of
Pakistan”, International Journal of Business and
Social Science, 2 (2011) 16.
Nielsen, “Consumers’ knowledge towards
Vietnamese private brands of retailers system”,
Available
at:
(Accessed: 6 October 2016).
Keller, K.L. and Lehmann, D.R., “Brands and
Branding: Research findings and future
priorities”, Marketing Science, 25 (2006) 6, 740–
759. doi: 10.1287/mksc.1050.0153.
Cadogan, J.W., Foster, B. D., “Relationship selling
and
customer
loyalty:
An
empirical
investigation”, Marketing Intelligence & Planning,
18 (2000) 4, 185-199.
Gobé, M., Emotional branding, New York:
Allworth Press, 2001.
Duff, M., “Niche Marketing of cosmetics”, DSN
Retailing Today, 38 (2007), 29-35.
Parasuraman, A., Zeithaml, V. A., & Malhotra, A.,
“E-S-Qual: A multiple item scale for assessing
electronic service quality”, Journal of Service
Research, 7 (2005), 214-223.
Wilson A., Zeithaml V.A., Bitner M.J., Gremler
D.D.,
Services
Marketing,
McGraw-Hill
Education, 2008.
Kim, D. & Sun, K., “Does customer satisfaction
increase firm performance? An application of
American Customer Satisfaction Index (ACSI)”,
International Journal of Hospitality Management,
35 (2013), 68-77.
Russell RS, Taylor BW., Operations Management,
7th, International student version. ed. Hoboken,
N.J: John Wiley, 2011.
[34] Sproles, G.B. and Kendall, E.L., “A methodology
for profiling consumers’ decision-making styles”,
Journal of Consumer Affairs, 20 (1986) 2, 267-279.
[35] Egan, J. (2015), Marketing communications,
Second ed, SAGE, London, 1986.
[36] Lovelock, C. H., Services Marketing (4th ed), New
Jersey: Prentice Hall, 2010.
[37] Insight, SJ, New research sheds light on daily ad
exposures.
Available
at:
(Accessed: 22
December 2016).
[38] Peter, J.P. & Olson, J.C., Consumer behavior
and marketing strategy, McGraw-Hill, New
York, 2010.
[39] Chung, I. K., & Lee, M. M., “A Study of
Influencing Factors for Repurchase Intention in
Internet Shopping Malls”, Parallel and Distributed
Processing Symposium Proceedings International,
22 (2003) 26, 7.
[40] Kotler, P., “Atmospherics as a marketing tool”,
Journal of Retailing, 1973, 48-49.
[41] Yildirim, K., Akalin-Baskaya, A., & Hidayetoglu,
M. L., “The effects of the store window type on
consumers’ perception and shopping attitudes
through the use of digital pictures”, Gazi University
Journal of Science, 20 (2010) 2, 33-40.
[42] Berman, B., & Evans, J. R., Retail management: A
Strategic Approach, Prentice Hall, 1995.
[43] Turley, L. W., & Milliman, R. E., “Atmospheric
effects on shopping behavior: A review of the
experimental evidence”, Journal of Business
Research, 49 (2000) 2, 193-211.
[44] Chang, K., “The impact of perceived physical
environments on customers’ satisfaction and return
intentions”, Journal of Professional Services
Marketing, 21 (2000) 2, 75.
[45] Heung, V., & Gu, T., “Influence of restaurant
atmospherics on patron satisfaction and behavioral
intentions”, International Journal of Hospitality
Management, 31 (2012), 1167-1177.
[46] Andaleeb, S. S., & Conway, C., “Customer
satisfaction in the restaurant industry: An
examination of the transaction-specific model”,
Journal of Services Marketing, 20 (2006) 1, 3-11.
[47] Bryman, A., Bell, E., Business Research Methods,
Oxford University Press, Oxford, 2011.
[48] Keller, K. L., Strategic Brand Management:
Building, Measuring, and Managing Brand Equity,
2nd ed, Prentice Hall, NJ, 2003.
[49] Frings, G. S., Fashion: From Concept to Consumer
(8th Ed.), New Jersey: Pearson/Prentice Hall, 2005.
P.T. Lien, D.N. Bich / VNU Journal of Science: Education Research, Vol. 32, No. 5E (2016) 76-89
[50] Christina O'Loughlin, “Application of the
European Customer Satisfaction Index to Postal
Services. Structural Equation Models versus Partial
Least
Squares”,
Department
d'Economia,
Universitat de Girona, September, 2002.
[51] Kim J, Mueller CW, Factor Analysis: Statistical
Methods and Practical Issues. Vol 14. Beverly
Hills, London: Sage Publications, 1978.
[52] Tucker, L. R., Koopman, R. F., Linn, R. L.,
“Evaluation of factor analytic research procedures
by means of simulated correlation matrices”,
Psychometrika, 34 (1969), 421-459.
[53] Tavakol M, Dennick R. “Post-examination analysis
of objective tests”, International Journal of Medical
Education, 2 (2011), 53-55.
[54] Pallant J. SPSS Survival Manual: A Step by Step
Guide to Data Analysis using IBM SPSS. 6th ed.
Maidenhead, Berkshire, England: McGraw-Hill
Education, 2016.
89
[55] Ang, S.H., and Lim, E.A.C, “The influences of
metaphors and product types on brand personality
perception and attitude”, Journal of Advertising,
Vol.35, 760-772, 2006.
[56] Lau, K.C. & Phau, I., “Impact of gender on
perceptual fit evaluation for prestige
brands”, The
Journal
of
Brand
Management, 17 (2010) 5, 354-367.
[57] Rompay, T.J.L. & Veltkamp, M., “Product
packaging metaphors: Effects of ambiguity and
explanatory information on consumer appreciation
and
brand
perception”, Psychology
&
Marketing, 31 (2014) 6, 404-415.
[58] Fill, C., Marketing communications: Engagements,
strategies and practice, 4th ed, Financial Times
Prentice Hall, Harlow, 2005.
[59] Aaker, D.A., Building strong brands, Free Press,
New York, 1996.