DSpace at VNU: Free surface effects on thermodynamics and glass formation in simple monatomic supercooled liquids
Bạn đang xem bản rút gọn của tài liệu. Xem và tải ngay bản đầy đủ của tài liệu tại đây (953.99 KB, 11 trang )
PHYSICAL REVIEW B 84, 174204 (2011)
Free surface effects on thermodynamics and glass formation in simple monatomic
supercooled liquids
V. V. Hoang1,2,* and T. Q. Dong2
1
Department of Physics, Institute of Technology, National University of Ho Chi Minh City, 268 Ly Thuong Kiet Street,
District 10, Ho Chi Minh City, Vietnam
2
Universit´e de Marne-la-Vall´ee, Cit´e Descartes, Bˆat. Lavoisier, Champs-sur-Marne, 77454 Marne-la-Vall´ee, Cedex 2, France
(Received 5 August 2011; published 9 November 2011)
Free surface effects on the thermodynamics and glass formation in simple monatomic supercooled liquids
with the Lennard-Jones–Gauss interaction potential were studied by the molecular dynamics simulations. Glass
with two free surfaces was obtained by cooling from the melt. We found the following important new results:
Free surfaces significantly enhance atomic mobility in the system compared to that of the bulk and induce the
formation of so-called layer structure of the interior of both liquid and glassy states. A mobile surface layer in
the system exists for a wide temperature range; i.e., the thickness of the mobile surface layer and the discrepancy
between atomic mobility in the surface and that in the interior have a tendency to increase with temperature.
The atomic mechanism of glass formation in supercooled liquids with free surfaces exhibits “heterogeneouslike”
behavior, unlike the “homogeneous” behavior observed in the bulk; i.e., the solidlike “domain” initiates/enhances
in the interior and simultaneously grows outward to the surface to form a glassy solid phase. The interior of glass
with free surfaces exhibits a stronger local icosahedral order compared to that of the bulk, and it may lead to
higher stability of the glassy state compared to that of the latter. In contrast, the surface shell has a more porous
structure and contains a large number of undercoordinated sites.
DOI: 10.1103/PhysRevB.84.174204
PACS number(s): 64.70.Q−, 61.43.Fs, 64.70.P−
I. INTRODUCTION
Glass with free surfaces (with or without interface with the
substrate, i.e., thin film–like glass) has been under intensive investigation by both experiments1–45 and computer simulations
or theoretical models46–64 for decades due to its scientific and
technological importance. While experiments have focused
on the fabrication and the interfacial and confinement-induced
properties of glassy thin films, theoretical models or computer
simulations have tried to get more detailed information at
the atomistic level of the surface structure, mechanism of
glass formation, and dynamics or thermodynamics of the
systems. Study of glassy thin films, including the effects of
free surfaces or interfaces on their structure and properties,
remains an active research area. Recently, it was found that
glassy thin films obtained by vapor deposition can be highly
stable (henceforth referred to as “stable glass”) compared to
ordinary glass obtained by quenching from the melt.18 This
discovery provided the impetus for further research in this
direction.21–23,29,30,33,36,39,40,42–45 Stable glass exhibits lower
enthalpy and higher density compared to ordinary glass. It
was suggested that high-mobility molecules within a few
nanometers of the surface have time to find low-energy packing
configurations before they are buried by further deposition and
that this leads to the formation of an ultrastable glassy state.18,22
Optical photobleaching experiments revealed the existence
of two subsets of probe molecules with different dynamics
in stable glass, which can be explained by the existence
of a high-mobility layer at the surface of glassy films.43
Similarly, the existence of glass with a liquidlike layer was
previously suggested, although it has been under debate.6 An
enhanced mobility surface is an important problem, relevant
for adhesion, friction, coatings, and nanoscaled fabrication
such as etching and lithography.56 Stable glassy thin film
1098-0121/2011/84(17)/174204(11)
of toluene and ethylbenzene were also obtained by vapor
deposition.65–67
Although some theoretical models or simulations were
done to clarify various aspects of thin glassy films in the
past, they mainly focused on confined polymeric thin film
models.46–64 Recently, a schematic-facilitated kinetic Ising
model was proposed that is capable of reproducing the key
experimentally observed characteristics of vapor-deposited
stable glass.61 Furthermore, an atomistic molecular model of
trehalose was used for examination of properties of vapordeposited stable glass.62 These simulations supported the
Ediger group’s argument that surface-induced high mobility
during the deposition process is the mechanism of formation of
stable glass.18 Properties of the atomic freestanding thin films
of a binary Lennard-Jones (LJ) mixture have been studied by
molecular dynamics (MD) simulations, and it was suggested
that surface atoms are able to sample the underlying energy
landscape more effectively than those in the interior, which
may be related to the mechanism of formation of stable
glass.63 We are carrying out a research project of various
substances in models with free surfaces via MD simulations to
highlight the situation. In the present work, we show the results
for Lennard-Jones–Gauss (LJG) glass with free surfaces.
Details about the calculations can be seen in Sec. II. Results
and discussions about the thermodynamics, evolution of the
structure, and atomic mechanism of glass formation in a system
with free surfaces can be found in Sec. III. Conclusions are
given in the last section of the paper. Using simple monatomic
models, we can easily monitor the atomic mechanism of phase
transitions or related phenomena, since we can focus on the
topological order of the atomic arrangements only, rather than
on both topological and chemical orders, as is necessary if we
use binary systems.
174204-1
©2011 American Physical Society
V. V. HOANG AND T. Q. DONG
PHYSICAL REVIEW B 84, 174204 (2011)
form is
II. CALCULATIONS
Glass formation and related thermodynamics have been
studied in models containing 5832 identical atoms interacting
via the LJG potential:68–72
V (r) = ε
σ
r
12
σ
−2
r
6
(r − 1.47σ )2
− 1.5ε exp −
.
0.04σ 2
(1)
The LJG potential is a sum of the Lennard-Jones potential and
a Gaussian contribution. The three-dimensional (3D) glassy
state with an LJG potential remains unchanged after long
annealing for 1093 ns (see Ref. 73), making it a very long-lived
simple monatomic glassy model compared to those with LJ or
Dzugutov potentials.74,75 The following LJ-reduced units were
used in the present work: length in units of σ , temperature
T
√
in units of ε/kB , and time in units of τ0 = σ m/ε. Here,
kB is the Boltzmann constant, σ is an atomic diameter, and
m is an atomic mass (for Ar, we have m = 0.66√
× 10−25
˚ therefore, τ0 = σ m/ε =
kg, ε/kB = 118 K, σ = 3.84 A;
2.44 ps). The Verlet algorithm is employed, and the MD
time step is dt = 0.001τ0 , or 2.44 fs if we are taking Ar for
testing. A cutoff is applied to the LJG potential at r = 2.5σ
like that used in Refs. 69–73. The initial configuration of a
simple cubic structure at the density ρ0 = 0.8 is melted in
a cube of the length L = 19.39σ under periodic boundary
conditions (PBCs) at a temperature as high as T0 = 2.0 via
MD relaxation for 2 × 10⁵ MD steps. After that, PBCs are
applied only in the x and y Cartesian directions, while in the
z Cartesian direction, nonperiodic boundaries with an elastic
reflection behavior are employed after adding the empty space
of a length of z = 3σ at z = L = 19.39σ . Due to using the
elastic reflection boundaries, an additional free surface first
occurs at z = 0.0 during further MD simulation. The system
is left to equilibrate further for 5 × 10⁴ MD steps at T0 = 2.0
at a constant volume corresponding to the new boundaries
(i.e., NVT ensemble simulation). Then the system is cooled
at the constant volume and temperature is decreased linearly
with time as T = T0 − γ × n by simple atomic velocity
rescaling. The cooling rate γ = 10−6 per 1 MD step (or
4.836 × 10¹⁰ K/s if we are taking Ar for testing) is used;
n is the number of MD steps. To calculate the coordination
number, Honeycutt-Andersen bond pair analysis, or clustering
of atoms, we assume that two atoms located within the cutoff
radius Ro = 1.25 are neighbors. Here, the cutoff distance is
the position of the minimum after the first peak in radial
distribution function (RDF) for the glassy state obtained at
T = 0.1. To improve the statistics, we average the results over
two independent runs.
FS (Q,t) =
1
N
N
exp(iQ.[rj (t) − rj (0)] ,
where rj (t) is the location of the j th atom at time t and Q
is a wave vector. We can see in Fig. 1(a) that FS (Q,t) is
typical for supercooled glass-forming systems.76,77 At high
temperature, FS (Q,t) has the ballistic regime of motion of
atoms at the short beginning time, followed by a relaxation
behavior regime that is basically exponential and function
decays to 0 within 1 τ0 . However, with further decreasing
temperature, it has a tendency to form a plateau regime
after the ballistic one and longer time portion of the curves
exhibits nonexponential behavior like that found for various
glass-forming supercooled liquids.73,76,77 The plateau regime
is related to the caging effects, i.e., the temporary trapping of
atoms by their neighbors. We also found that details of slowing,
as well as the shape of FS (Q,t), in the system with free surfaces
are very different from the behavior of the bulk [see the curves
for T = 1.5 in Fig. 1(a)] yet like those found for thin polymer
film.50 Furthermore, we can see in Fig. 1(b) that the MSD has
three regimes: the ballistic regime at the beginning of motion;
followed by the plateau regime, which is related to the caging
effects; and finally the diffusive regime over a longer time.
These three regimes are seen clearly at low temperatures.
It seems that the MSD of atoms in our system also has an
additional regime: the saturation regime of a diffusion length
of the calculation shell in the z direction. This fourth regime
can be seen more clearly at high temperatures [Fig. 1(b)], like
those found in nanoparticles.72 The potential energy in the
models with free surfaces is significantly higher than that of
the bulk due to the surface contribution, and the starting point
of deviation from the linearity of the low temperature region is
a glass transition temperature [Tg = 0.61, Fig. 1(c)]. Indeed,
at T
0.60, atomic motion exhibits solidlike behavior; i.e.,
after the ballistic regime at the beginning, the motion of atoms
enters the plateau regime for a long time, indicating a strong
caging effect of a relatively rigid glassy state [Figs. 1(a) and
1(b)]. Due to the free surfaces, a significant number of atoms
remain liquidlike in the glassy matrix, especially in the surface
shell, leading to enhancement of MSD for a long time for a
temperature just below Tg = 0.61 [Fig. 1(b)].
A free surface or interface can greatly enhance the
dynamics of atoms in the systems, according to evidence
from experiments4,6,7,17,19,26,30,33,35,38,41,43,45 or from computer
simulations and theoretical models.49,50,56,61–64 The diffusion
constant (D) is found via the following Einstein relation:
lim
t→∞
III. RESULTS AND DISCUSSIONS
A. Thermodynamics
Temperature dependence of the inherent intermediate scattering function FS (Q,t), mean-squared displacement (MSD)
of atoms, potential energy per atom, and diffusion constant
are presented in Fig. 1. In the present work, FS (Q,t) is
calculated for Q = 8.665σ −1 , which is the location of the first
peak in the structure factor S(Q) of the bulk.73 The function
(2)
j =1
∂
r 2 (t)
= D.
6∂t
(3)
Here, r 2 (t) is the MSD of the atom. We show the inverse
temperature dependence of the logarithm of the diffusion
constant in Fig. 1(d). We can see that the diffusion constant
in the system with free surfaces is always larger than that in
the bulk for the whole temperature range studied. In particular,
the discrepancy is of some orders of magnitude at the lowest
temperature calculated [Fig. 1(d)]. At a high temperature,
diffusion in both the bulk and the system with free surfaces
follows an Arrhenius law, while at a low temperature, deviation
174204-2
FREE SURFACE EFFECTS ON THERMODYNAMICS AND . . .
PHYSICAL REVIEW B 84, 174204 (2011)
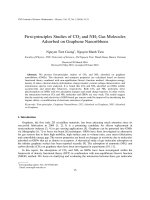
FIG. 1. (Color online) (a) Time–temperature dependence of the self-intermediate scattering function. From left to right, for temperatures
ranging from T = 2.0 to T = 0.1, the yellow line is for the system with free surfaces at T = 1.5 compared to that of the bulk obtained at the
same temperature (the bold line) (Ref. 73) and the thick blue line is for T = 0.6. (b) Time–temperature dependence of the MSD of atoms. The
bold line is for T = 0.6. (c) Temperature dependence of the potential energy per atom in the system compared to that of the bulk (Ref. 71).
The straight line is a visual guide. (d) Inverse temperature dependence of the logarithm of the diffusion constant in the system compared to that
of the bulk (Ref. 71). The straight lines are visual guides.
from this law is found. However, deviation from an Arrhenius
law is more pronounced for the bulk than for the system
with free surfaces. This indicates free surface effects on the
mechanism of diffusion in the system. It was found and
discussed in Ref. 71 that the change in slope of the curve
presented in Fig. 1(d) is related to the change in mechanism
of diffusion from liquidlike to solidlike. Other researchers
found that the lateral diffusion coefficient at the surface of
the freestanding LJ thin film is roughly three times greater
than at the center of the film.63 In addition, they found that the
diffusion constant and the velocity autocorrelation function
in the center of the film match exactly the corresponding
quantities of the bulk.
To get more detailed information about the local structure
and dynamics in the system, we present the density profile and
atomic displacement distribution (ADD) in the z direction in
the models (Fig. 2). The density profile at a given temperature
is calculated by partitioning the system in the z direction into
slices of the thickness 0.2σ . Then we divide the number of
atoms in each slice by the volume of a given slice. Similarly,
ADD is found by dividing the total displacement of all atoms
in the slice by the number of atoms in a given slice, and ADD
corresponds to the displacement of atoms in the slice after a
specific amount of time at a given temperature (τC ), which was
chosen appropriately. After intensive checking, we found that
τC = 5τ0 is a good choice (i.e., 12.2 ps or 5000 MD steps).
We can see in Fig. 1(b) that this time is located at the end of
a plateau regime for the MSD at T around a glass transition
temperature (i.e., it is large enough for atoms to overcome
a plateau regime to diffuse if it is a liquidlike one), and we
use this time for calculating the Lindemann ratio (given later).
To clarify the enhanced mobility of particles at the surface
of the model of trehalose by measuring the Debye-Waller
factor, it was argued that the characteristic time τC can be
chosen appropriately depending on the physical phenomenon
of interest.62 Finally, a short period near the beginning of the
caging regime equal to 10 ps was adopted since it provides a
reasonable measure of the free volume in the system,78,79 and
is close to our τC = 12.2 ps.
Some points can be drawn for the density profiles presented
in Fig. 2. Density profile shows clearly that the system with free
surfaces can be divided into two distinct parts: the surface shell
and the interior. In the latter, the density profile shows a layer
structure of orderly high and low values, and the layer structure
is enhanced with decreasing temperature. However, density in
the interior fluctuates around an average value for a given
temperature, which increases with decreasing temperature,
like that found for the binary LJ system.63 In contrast, density
in the surface shell decreases with distance from the interior,
indicating a more porous structure in this part of the system
174204-3
V. V. HOANG AND T. Q. DONG
PHYSICAL REVIEW B 84, 174204 (2011)
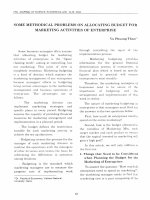
FIG. 2. Density profile and ADD the models obtained at different temperatures. For ADD, we employ the same scale as that for the density
profile.
compared to that of the interior. We found a layer structure
of the system for the whole temperature range studied (i.e.,
even at the highest temperature T = 2.0). Layering at the free
liquid surfaces was also found for various systems.80,81 It was
argued that occurrence of the layer structure depends on the
ratio Tm /TC (TC is a critical temperature for the system) and
monatomic LJ liquid does not exhibit a layer structure.80 A
strong layer structure in the density profile was found for the
molecular model of trehalose, and it was suggested to be the
origin of the ultrahigh stability of vapor-deposited glass.62
In the z direction in the models, we can see that ADD also
exhibits interior and surface behavior. In the interior ADD is
rather constant at a low value, while in the surface shell it
increases with distance from the interior (Fig. 2). Evidence
of the existence of a high-mobility surface in glass with a
free surface was found by both experiments and computer
simulations. However, the phenomenon was only studied
indirectly or partially, i.e., just via the Debye-Waller factor as a
function of distance from the substrate layer62 or via the lateral
diffusion constant at two different temperatures.63 There is a
surface shell of enhanced mobility in our system (Fig. 2). The
thickness of this layer d and the discrepancy between atomic
mobility in the surface and that in the interior of the system
h are determined as described in Fig. 3(a). The following
important points can be listed: First, the thickness of the region
of reduced density is almost the same as that for the region
of enhanced mobility. However, it was suggested in the past
that the latter should be an order of magnitude larger than the
former.6 Second, as shown in Fig. 3(b), the thickness of the mobile surface layer has a tendency to increase with temperature
for the whole temperature range studied (i.e., from the glassy
state to the normal liquid one) and shares some trends found
for the liquid surface width of an isotropic dielectric liquid—
i.e., tetrakis(2-ethoxyhexoxy)silane.81 For the glassy region
of polystyrene, d increases with temperature.43 We found
that a mobile surface layer exists for the whole temperature
range studied and that it is new, since it was suggested that
convergence of the surface and bulk dynamics should be
complete at high temperatures (i.e., at T > Tg + 5 K for the
freestanding polystyrene thin film43 ). Third, the discrepancy
between atomic mobility in the interior and that in the surface
shell also has a tendency to grow with temperature up to
the normal liquid region [Fig. 3(c)]. Therefore, it does not
support the suggestions that dynamics near surface has a
weaker temperature dependence compared to dynamics in the
interior and that the difference in the dynamics between the
surface and the interior gets smaller as temperature approaches
Tg from below.43 Finally, the thickness of our models with
free surfaces (in the z direction) decreases with decreasing
temperature, leading to the formation of a glassy state with
enhanced density in the interior (Fig. 2). This may lead to
enhancement of stability of the obtained glassy state. It is
also in accordance with stability observed for the freestanding
thin film of the binary LJ mixture63 or for the monatomic LJ
system.82 The quantity d is found by averaging of the results of
two opposite sides. In addition, the mean density of the system
increases with decreasing temperature, and the glass transition
temperature (Tg ) of the system can be found as the point of
deviation from the linearity of the low temperature region
[Fig. 3(d)]. A similar temperature dependence of density was
174204-4
FREE SURFACE EFFECTS ON THERMODYNAMICS AND . . .
PHYSICAL REVIEW B 84, 174204 (2011)
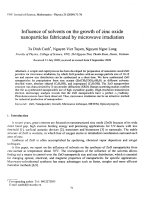
FIG. 3. (a) ADD in the model obtained at T = 2.0. The dotted lines and arrows are visual guides. We also show how to determine the
discrepancy between atomic mobility in the surface and that in the interior of the system (denoted as h), as well as showing the thickness of the
mobile surface layer (denoted as d). (b) Temperature dependence of the thickness of a mobile surface layer. The solid line is the averaged curve.
(c) Temperature dependence of the discrepancy between mobility in the surface and that in the interior. Again, the solid line is the averaged
curve. (d) Temperature dependence of the mean density of the system. The straight line is a visual guide.
found for the bulk, and the mean density of the system with
free surfaces is slightly smaller than that of the bulk.73
B. Evolution of the structure upon cooling from the melt
It is of great interest to see the evolution of the structure
of the system upon cooling from the melt. We can see in
Fig. 4 that evolution of the RDF of the system is typical for
glass-forming systems like those found and discussed.69–75
FIG. 4. RDF in the models obtained upon cooling from the melt.
We also show the coordination number distributions in the
glassy model (at T = 0.10) compared to those of the bulk
after the same relaxation for 2 × 10⁵ MD steps (Fig. 5).
The structure of interior of the system with free surfaces is
close to that of the bulk, although the former has a more
close-packed atomic arrangement compared to the latter (Fig. 5
and Table I). However, the surface shell of the models exhibits a
FIG. 5. Coordination number distributions in the well-relaxed
model with free surfaces obtained at T = 0.1 compared to those
of the bulk (Ref. 73).
174204-5
V. V. HOANG AND T. Q. DONG
PHYSICAL REVIEW B 84, 174204 (2011)
TABLE I. Mean coordination number (Z), mean interatomic
distance (R), glass transition temperature (Tg ), and density (ρ) of the
well-relaxed glassy system with free surfaces obtained at T = 0.1
compared to those of the bulk (Ref. 73). For glass with free surfaces,
we show the averaged density.
Materials
Z
System with free surfaces Surface
Interior
Whole
Bulk
R
Tg
9.096
13.096
12.241 0.910 0.61
13.030 0.900 1.00
ρ
1.156
1.765
1.551
1.759
non–close-packed atomic arrangement and contains a large
number of undercoordinated sites (Table I). A high concentration of undercoordinated sites (or “structural defects” of
glass) may be the origin of various surface phenomena of thin
films.13,83 For example, it was found that the well-relaxed silica
surface contains a large number of structural defects, which
can serve as reaction sites for the formation of silanols.83
Still, Table I shows that the mean interatomic distance in
LJG glass with free surfaces is somewhat larger than that
of the bulk due to surface interatomic enhancement like that
found for nanoparticles.72 Free surfaces greatly reduce a glass
transition temperature in the system from that of the bulk
due to surface atomic–mobility enhancement (Table I). This
tendency is consistent with that observed experimentally for
thin films of various substances (e.g., Refs. 1 and 2). Glassy
thin film models of trehalose obtained by “vapor deposition”
also have a higher density, lower enthalpy, and higher onset
temperature than corresponding “ordinary” glass formed by
quenching the bulk liquid.62 These glassy models of trehalose
also contain a strong layer structure interior like that found
in the present work. Moreover, it was found that the Fourier
transformation of the local density profile of the trehalose
models exhibits a pronounced peak.62 This is reminiscent of
the additional scattering peak reported by Dawson et al. for
stable glass of indomethacin.84 It was suggested that unusual
properties of stable glass of indomethacin are the results of the
layer structure interior of the samples induced by the formation
process.62
The fraction of various bond pairs of the HoneycuttAndersen analysis70,73,85 in glass with free surfaces can be seen
in Table II. According to the Honeycutt-Andersen analysis,
structure is analyzed by the pairs of atoms on which four
indices are assigned. The first index indicates whether or not
they are near neighbors; thus, the first index is 1 if the pair
is bonded and is 2 otherwise, where we used the fixed cutoff
radius Ro = 1.25 for determining the nearest-neighbor pairs.
The second index is equal to the number of near neighbors
they have in common. The third index is equal to the number
of bonds among common near neighbors. Finally, the fourth
index denotes the existence of a structure with the same first
three indices but with different arrangements.
Therefore, while the interior has a strong local icosahedral
order and its relative fraction of bond pairs is close to that
of the bulk, the surface shell contains a large number of bond
pairs characteristic for non–close-packed atomic arrangements
like those discussed previously by analyzing the coordination
number distributions (Table II). We found that fraction of the
1551 bond pair in the interior is rather high like that found
in metallic glass.70,73,86,87 The 1551 pair is direct evidence of
the existence of a local icosahedral order in the system.85 This
means that the energy-favored local structure of LJG glass
is an icosahedral order, which is incompatible with global
crystallographic symmetry. This is the origin of long-lived
stability of LJG glass, since fivefold symmetry frustrates
crystallization. However, the differences between bond-pair
distributions in the interior and those in the bulk can be seen
in Table II. That is, the fraction of the 1551 bond pair in
the interior is higher than that in the bulk, and it may lead
to higher stability against crystallization of glass with free
surfaces. Experimental studies of stable glass have focused on
macroscopic observables, and there is no detailed structural
analysis in recent simulations of stable glassy models.62,63
Therefore, it is difficult to determine the origin of their high
stability.
The LJG interatomic potential used in the present simulations is a double well one.68–70 For a two-dimensional system,
it was found that the Gaussian part of the potential stabilizes
the pentagonal configuration and packing of the pentagons
produces frustration in crystallization of the obtained glass.69
Moreover, competition of the two nearest-neighbor distances
of a double-well interaction leads to the formation of 3D
glass with a very high fraction of a local icosahedral order
in the systems, in turn leading to high stability against
crystallization.70,73 The same situation is found in the present
work for LJG glass with free surfaces.
C. Atomic mechanism of glass formation
To clarify the atomic mechanism of glass formation in supercooled liquids with free surfaces, the Lindemann-freezing–
like criterion is used for detecting solidlike atoms occurring
in the system upon cooling from the melt. Then we analyze
their spatiotemporal arrangements. This procedure has been
successfully used for determination of the atomic mechanism
of glass formation in the bulk and nanoparticles.71–73 The
Lindemann ratio for the ith atom is88
δi =
ri2
1/2
(4)
/R.
TABLE II. Relative fraction of bond pairs in the well-relaxed glassy models with free surfaces compared to those of the bulk (Ref. 73)
obtained at T = 0.1.
Models
System with free surfaces
Bulk
Surface
Interior
1301
1311
1321
1421
1422
1441
1551
1541
1661
0.009
0.002
0.001
0.106
0.013
0.015
0.124
0.022
0.022
0.016
0.017
0.020
0.080
0.030
0.032
0.011
0.030
0.035
0.446
0.598
0.577
0.168
0.198
0.205
0.040
0.089
0.093
174204-6
FREE SURFACE EFFECTS ON THERMODYNAMICS AND . . .
FIG. 6. Temperature dependence of the fraction of solidlike atoms
(NS /N ) and size of the largest solidlike clusters (Smax /N ) to the total
number of atoms in the system (N ). The inset shows the temperature
dependence of the Lindemann ratio.
Here,
ri2 is the MSD of the ith atom and R = 0.91 is
an interatomic distance. For supercooled and glassy states,
R does not change much with temperature, and we fix
this value for the calculations. We define
ri2 after a
characteristic time τC as described previously, i.e., τC = 5τ0
(5000 MD steps or 12.2 ps), and it is close to that found
for the bulk and nanoparticles.71–73 It was proposed that τC
is not larger than some atomic vibrations in picoseconds.89
We define the Lindemann ratio δL of the system by the
average of δi over all atoms, δL = i δi /N. Temperature
dependence of the Lindemann ratio can be seen in the
inset of Fig. 6. We can see that the Lindemann ratio and
potential energy show similar temperature dependence (Figs. 1
and 6), indicating a strong correlation between them in the
vitrification process. That is, the starting point of deviation
from the linearity of the low temperature region in Fig. 6 is
a glass transition temperature. This means that Tg = 0.61 is
determined exactly by the temperature dependence of three
thermodynamic quantities: potential energy, density, and the
Lindemann ratio. Moreover, Tg = 0.61 is a bound between
liquidlike and solidlike dynamics in the system (see FS (Q,t)
and the MSD in Fig. 1). We can see in Fig. 6 that at T = Tg , the
Lindemann ratio has a critical value δC = 0.167 and it is close
to that found for the bulk and nanoparticles.71–73 Therefore,
atoms with δi δC are classified as solidlike, and atoms
with δi > δC are classified as liquidlike. A purely Lindemann
criterion established that melting occurs when a root of MSD is
at least 10% (usually ∼15%, which is close to our δC = 0.167)
of the atomic spacing.88,90 Moreover, there is experimental
evidence that this criterion is also applicable for glass.91–93
The validity of the Lindemann criterion for melting and the
glass transition was checked and confirmed recently.90,94
We found that the atomic mechanism of glass formation in
the system with free surfaces shares some trends observed in
the bulk.71,73 That is, a significant number of solidlike atoms
first occur around T = 1.4, at a point located somewhat lower
than that of the bulk.71,73 It may be due to free surfaces–
induced mobility enhancement in the system. Furthermore,
PHYSICAL REVIEW B 84, 174204 (2011)
the number of solidlike atoms grows quickly with further
cooling, and they have a tendency to form clusters [Fig. 6].
At the glass transition temperature (Tg = 0.61) ∼84% atoms
in the system are solidlike to form a relatively rigid glassy
phase. This fraction of solidlike atoms is close to that observed
in the bulk and nanoparticles.71–73 Further cooling leads to
full solidification around Tf = 0.10, where the percentage of
solidlike atoms is ∼100% (Fig. 6). We found that characteristic
temperatures of glass formation in the system with free
surfaces, i.e., Tg and Tf , are much smaller than those found
in the bulk.71,73 The tendency of solidlike atoms to form
clusters can be seen via the curve of Smax /N in Fig. 6.
That is, the size of the largest cluster Smax increases with
decreasing temperature. Subsequently, around T = 1.1, the
largest cluster contains almost 98% solidlike atoms in the
system to form a thin film–like configuration (described later).
Such a cluster can be considered percolated, like the one
found in the bulk.73 A single percolation cluster is formed
by merging the small-size coarse clusters and single solidlike
atoms when a fraction of solidlike atoms reaches a critical
value pC . We found here that pC = 0.33 located within
the range 0.15 pC 0.45, as suggested in Ref. 95. This
means that glass formation in the system with free surfaces is
also related to the percolation of solidlike clusters. However,
percolation occurs at a temperature located well above the
glass transition temperature, like the one found in the bulk and
in nanoparticles.71–73
We also found some differences in glass formation in
the system with free surfaces compared to that observed in
the bulk. More details about the occurrence and clustering
of solidlike atoms in supercooled liquids with free surfaces
can be seen in the 3D visualization presented in Fig. 7.
At the first stage of glass formation, solidlike atoms occur
in the interior of the system, and their spatial distribution
exhibits diversity behavior even though they have a tendency
to form clusters [Fig. 7(a)]. The atomic configuration of
solidlike clusters becomes more closely packed [Fig. 7(b)],
and the configuration of a thin film shape is formed at a
lower temperature [Fig. 7(c)]. This configuration of the thin
film shape grows outward upon further cooling and forms a
glassylike thin film at the temperature close to glass transition
[Fig. 7(d)]. This means that glass formation in supercooled liquids with free surfaces exhibits “heterogeneouslike” behavior;
i.e., the solidlike “domain” occurs/enhances in the interior and
simultaneously grows outward to the surfaces. This is unlike
the “homogeneous” glass formation observed in the bulk.71,73
In addition, the lifetime of solidlike clusters in supercooled
liquids with the LJG potential is rather long compared to the
typical lifetime of ∼1 ps of the icosahedral cluster in the
liquid Fe model obtained at 1900 K (see Ref. 96). It was found
that the lower the temperature, the larger the solidlike clusters
and the longer their lifetime.71,73 A similar situation for the
lifetime of solidlike clusters in models with free surfaces can
be suggested.
The distributions of solidlike and liquidlike atoms in the
z direction in the system during a vitrification process offer
a more detailed picture of glass formation in the system
(Fig. 8). Solidification of the system initiates/enhances in the
interior and simultaneously grows outward [Figs. 8(a) and
8(b)]. Although liquidlike atoms distribute throughout the
174204-7
V. V. HOANG AND T. Q. DONG
PHYSICAL REVIEW B 84, 174204 (2011)
FIG. 7. (Color online) 3D visualization of the appearance of
solidlike atoms in the system upon cooling from the melt.
system, they have a tendency to concentrate in the surface
shell to form a liquidlike layer in the outermost part of the
free surfaces [Figs. 8(b) and 8(c)]. However, at the glass
transition temperature, the liquidlike surface layer disappears,
and although liquidlike atoms still concentrate in the surface
shell, their density is equal to that of solidlike atoms [Fig. 8(d)].
This means that we have a mixed phase of solidlike and
liquidlike atoms with equal concentrations. The results of
the present work highlight the debate about the existence
of so-called glass with liquidlike surfaces6 and give deeper
understanding of glass formation in supercooled liquids with
free surfaces. Moreover, this problem is reminiscent of the
well-known phenomenon of surface premelting in solids,6,97
and it is of great interest to check the nature of the so-called
liquidlike surface layer of solids related to the premelting
phenomenon.
Clarifying the nature of solidlike atoms occurring in
the system upon cooling from the melt is helpful, since
many things related to the nature of solidlike atoms (or
solidlike domains) occurring in the supercooled region are
still unclear.98–101 To highlight the situation, we show in Fig. 9
the temperature dependence of the mean coordination number
for solidlike and liquidlike atoms compared to that of the mean
coordination number for all atoms in the system. We can see
that the mean coordination number of solidlike atoms is always
larger than that of all atoms; i.e., solidlike atoms often occur in
the close-packed atomic arrangement regions. It is difficult
for atoms located in the close-packed atomic arrangement
regions to escape from their position; they are often trapped by
their neighbors, and if the trapping time is long enough, they
become solidlike. The number of solidlike atoms increases
with decreasing temperature, and at a low temperature they
dominate in the system. Therefore, the mean coordination
number of solidlike atoms has a tendency to become closer
to that of all atoms with decreasing temperature (Fig. 9). In
FIG. 8. Distributions of solidlike and liquidlike atoms in the z direction in models obtained at different temperatures.
174204-8
FREE SURFACE EFFECTS ON THERMODYNAMICS AND . . .
FIG. 9. Temperature dependence of the mean coordination number of solidlike and liquidlike atoms compared to that of the mean
coordination number for all atoms in the system.
contrast, the mean coordination number of liquidlike atoms
is close to that of all atoms at a high temperature, and it
is always less than that for all atoms. This shows clearly
that liquidlike atoms are often located in the non–closepacked atomic arrangement regions, which can be considered
structural defects in glass. Indeed, atoms of non–close-packed
atomic arrangement regions in a glassy matrix are less stable,
so it is easy for them to escape from non–close-packed atomic
arrangement regions to diffuse. Thus, they become liquidlike
atoms via thermal vibrations. Strong fluctuations of the mean
coordination number for liquidlike atoms in glassy models
obtained at a temperature below Tg = 0.61 can be seen (Fig. 9).
Due to their small population in the glassy state at a low
temperature, the statistics may not be good.
IV. CONCLUSIONS
We have carried out MD simulations of glass formation
in simple monatomic supercooled liquids with free surfaces.
Some conclusions can be drawn:
(1) The atomic mechanism of glass formation in supercooled liquids with free surfaces shares some trends observed
previously in the bulk. However, it exhibits heterogeneous
behavior, unlike the homogeneous behavior observed in the
bulk;71,73 i.e., the solidlike domain initiates/enhances in the
interior and simultaneously grows outward to the surfaces.
(2) Glass with free surfaces has two distinct parts: the
interior and the surface shell. The former has a layer structure; layering and density of the interior are enhanced with
decreasing temperature. A layer structure exists for the whole
*
1
J. L. Keddie, R. A. L. Jones, and R. A. Cory, Europhys. Lett. 27,
59 (1994).
2
J. A. Forrest, K. Dalnoki-Veress, J. R. Stevens, and J. R. Dutcher,
Phys. Rev. Lett. 77, 2002 (1996).
3
Y. Liu, T. P. Russell, M. G. Samant, J. Stohr, H. R. Brown,
A. Cossy-Favre, and J. Diaz, Macromolecules 30, 7768 (1997).
PHYSICAL REVIEW B 84, 174204 (2011)
temperature range studied, from the normal liquid region into
the deep glassy region. It is new since the layer structure of the
density profile often disappears at high temperatures.80,81 The
interior exhibits slightly a higher density and stronger local
icosahedral order compared to those in the bulk. In contrast,
the surface shell has a porous structure and contains a large
number of undercoordinated sites, which can play an important
role in various surface phenomena of freestanding films like
those found in practice.
(3) Free surfaces greatly enhance dynamics in the system,
leading to a strong reduction of the glass transition temperature
compared to that of the bulk. The existence of a highmobility surface layer of the system (i.e., its thickness and the
discrepancy between atomic mobility in the surface and that
in the interior) has a tendency to increase with temperature.
(4) Liquidlike atoms in the glassy state, although they distribute throughout the system, have a tendency to concentrate
in the surface shell. However, at a temperature just below Tg ,
liquidlike atoms do not form a purely liquidlike surface layer
but rather form a mixed phase with equal concentrations of
liquidlike and solidlike atoms. This finding clears the debate
about the existence of glass with a liquidlike surface layer.6
(5) Although our simulation procedure does not fully
emulate the main features of the laboratory vapor-deposited
glass formation processes, we can infer some features of the
origins of high stability of stable glass first obtained by the
Ediger group. It was proposed that the formation of stable
glass is enabled by surface-enhanced molecular mobility of
a growing-vapor–deposited glass film. Indeed, the existence
of a high-mobility surface of the system with free surfaces is
found. During glass formation, free surfaces can reorganize
the whole system since every atom in the system, at some
time, can be part of a mobile surface layer. Due to the free
surfaces, almost all atoms in the system have more freedom,
and their mobility is greatly enhanced compared to that in the
bulk. Therefore, they have time to find the low-energy packing
configurations of high stability during a relatively slow cooling
process, leading to the formation of a “practical stable” glassy
state.
ACKNOWLEDGMENTS
V.V.H. thanks the Vietnam National Foundation for Science
and Technology Development for the financial support under
Grant No. 103.02.12.09 and G. Lauriat for the invited professorship at the Paris-Est University and for providing helpful
comments to improve the work. We used visual molecular
dynamics software (Illinois University) for 3D visualization
of atomic configuration in the paper.
4
R. Jones, Curr. Opin. Colloid Interface Sci. 4, 153 (1999).
Y.-K. See, J. Cha, T. Chang, and M. Ree, Langmuir 16, 2351
(2000).
6
R. A. L. Jones, Nat. Mater. 2, 645 (2003).
7
C. J. Ellison and J. M. Torkelson, Nat. Mater. 2, 695 (2003).
8
C. Y. Kwong, A. B. Djurisic, V. A. L. Roy, P. T. Lai, and W. K.
Chan, Thin Solid Films 458, 281 (2004).
5
174204-9
V. V. HOANG AND T. Q. DONG
9
PHYSICAL REVIEW B 84, 174204 (2011)
Y. Huang and D. R. Paul, Polymer 45, 8377 (2004).
N. Tomczak, R. A. L. Vallee, E. M. H. P. van Dijk, L. Kuipers,
N. F. van Hulst, and G. L. Vancso, J. Am. Chem. Soc. 126, 4748
(2004).
11
R. D. Priestley, C. J. Ellison, L. J. Broadbelt, and J. M. Torkelson,
Science 309, 456 (2005).
12
Z. Fakhraai and J. A. Forrest, Phys. Rev. Lett. 95, 025701
(2005).
13
M. Alcoutlabi and G. B. McKenna, J. Phys. Condens. Matter 17,
R461 (2005).
14
M. K. Mapes, S. F. Swallen, and M. D. Ediger, J. Phys. Chem. B
110, 507 (2006).
15
B. M. Besancon, C. L. Soles, and P. F. Green, Phys. Rev. Lett. 97,
057801 (2006).
16
R. A. Riggleman, K. Yoshimoto, J. F. Douglas, and J. J. de Pablo,
Phys. Rev. Lett. 97, 045502 (2006).
17
H. Bodiguel and C. Fretigny, Phys. Rev. Lett. 97, 266105 (2006).
18
S. F. Swallen, K. L. Kearns, M. K. Mapes, Y. S. Kim, R. J.
McMahon, M. D. Ediger, T. Wu, and S. Satija, Science 315, 353
(2007).
19
C. B. Roth, K. L. McNerny, W. F. Jager, and J. M. Torkelson,
Macromolecules 40, 2568 (2007).
20
Z. Jiang, H. Kim, X. Jiao, H. Lee, Y. Byun, S. Song, D. Eom, C. Li,
M. H. Rafailovich, L. B. Lurio, and S. K. Sinha, Phys. Rev. Lett.
98, 227801 (2007).
21
K. L. Kearns, S. F. Swallen, and M. D. Ediger, J. Chem. Phys. 127,
154702 (2007).
22
S. F. Swallen, K. L. Kearns, S. Satija, K. Traynor, R. J. McMahon,
and M. D. Ediger, J. Chem. Phys. 128, 214514 (2008).
23
K. L. Kearns, S. F. Swallen, M. D. Ediger, T. Wu, Y. Sun, and
L. Yu, J. Phys. Chem. B 112, 4934 (2008).
24
D. Qi, Z. Fakhraai, and J. A. Forrest, Phys. Rev. Lett. 101, 096101
(2008).
25
S. Streit-Nierobisch, C. Gutt, M. Paulus, and M. Tolan, Phys. Rev.
B 77, 041410(R) (2008).
26
Z. Fakhraai and J. A. Forrest, Science 319, 600 (2008).
27
J. R. Dutcher and M. D. Ediger, Science 319, 577 (2008).
28
M. K. Mukhopadhyay, X. Jiao, L. B. Lurio, Z. Jiang, J. Stark,
M. Sprung, S. Narayanan, A. R. Sandy, and S. K. Sinha, Phys.
Rev. Lett. 101, 115501 (2008).
29
S. F. Swallen, K. Traynor, R. J. McMahon, and M. D. Ediger, Phys.
Rev. Lett. 102, 065503 (2009).
30
K. L. Kearns, S. F. Swallen, M. D. Ediger, Y. Sun, and L. Yu,
J. Phys. Chem. B 113, 1579 (2009).
31
J. Matthiesen, R. S. Smith, and B. D. Kay, Phys. Rev. Lett. 103,
245902 (2009).
32
A. Serghei, M. Tress, and F. Kremer, J. Chem. Phys. 131, 154904
(2009).
33
S. F. Swallen, K. Windsor, R. J. McMahon, M. D. Ediger, and T. E.
Mates, J. Phys. Chem. B 114, 2635 (2010).
34
S. Xu, P. A. O’Connell, and G. B. McKenna, J. Chem. Phys. 132,
184902 (2010).
35
T. Koga, C. Li, M. K. Endoh, J. Koo, M. Rafailovich, S. Narayanan,
D. R. Lee, L. B. Lurio, and S. K. Sinha, Phys. Rev. Lett. 104,
066101 (2010).
36
K. L. Kearns, K. R. Whitaker, M. D. Ediger, H. Huth, and C. Schick,
J. Chem. Phys. 133, 014702 (2010).
37
A. K. Kandar, R. Bhattacharya, and J. K. Basu, J. Chem. Phys.
133, 071102 (2010).
10
38
M. Sikorski, C. Gutt, Y. Chushkin, M. Lippmann, and H. Franz,
Phys. Rev. Lett. 105, 215701 (2010).
39
K. L. Kearns, M. D. Ediger, H. Huth, and C. Schick, J. Phys. Chem.
Lett. 1, 388 (2010).
40
K. L. Kearns, T. still, G. Fytas, and M. Ediger, Adv. Mater. 22, 39
(2010).
41
Z. Yang, Y. Fujii, F. K. Lee, C.-H. Lam, and O. K. C. Tsui, Science
328, 1676 (2010).
42
K. J. Dawson, L. Zhu, L. Yu, and M. D. Ediger, J. Phys. Chem. B
115, 455 (2011).
43
K. Paeng, S. F. Swallen, and M. D. Ediger, J. Am. Chem. Soc. 133,
8444 (2011).
44
Y. Sun, L. Zhu, K. L. Kearns, M. D. Ediger, and L. Yu, Proc. Natl.
Acad. Sci. USA 108, 5990 (2011).
45
L. Zhu, C. W. Brian, S. K. Swallen, P. T. Straus, M. D. Ediger, and
L. Yu, Phys. Rev. Lett. 106, 256103 (2011).
46
M. R. Mruzik, S. H. Garofalini, and G. M. Pound, Surf. Sci. 103,
353 (1981).
47
J. A. Torres, P. F. Nealey, and J. J. de Pablo, Phys. Rev. Lett. 85,
3221 (2000).
48
Q. Wang, Q. Yan, P. F. Nealey, and J. J. de Pablo, J. Chem. Phys.
112, 450 (2000).
49
F. Vanik, J. Baschnagel, and K. Binder, Phys. Rev. E 65, 021507
(2002).
50
F. Vanik, J. Baschnagel, and K. Binder, J. Non-Cryst. Solid. 307310, 524 (2002).
51
T. M. Truskett and V. Ganesan, J. Chem. Phys. 119, 1897 (2003).
52
T. S. Jain and J. J. de Pablo, Phys. Rev. Lett. 92, 155505 (2004).
53
K. Yoshimoto, T. S. Jain, P. F. Nealey, and J. J. de Pablo, J. Chem.
Phys. 122, 144712 (2005).
54
J. Ghosh and R. Faller, J. Chem. Phys. 125, 044506 (2006).
55
J. Mittal, J. R. Errington, and T. M. Truskett, Phys. Rev. Lett. 96,
177804 (2006).
56
J. D. Stevenson and P. G. Wolynes, J. Chem. Phys. 129, 234514
(2008).
57
J. M. Kropka, V. Pryamitsyn, and V. Ganesan, Phys. Rev. Lett. 101,
075702 (2008).
58
J. Ghosh and R. Faller, J. Chem. Phys. 128, 124509 (2008).
59
F. Calvo and D. J. Wales, J. Chem. Phys. 131, 134504 (2009).
60
S. Peter, H. Meyer, and J. Baschnagel, J. Chem. Phys. 131, 014902
(2009).
61
S. Leonard and P. Harrowell, J. Chem. Phys. 133, 244502 (2010).
62
S. Singh and J. J. de Pablo, J. Chem. Phys. 134, 194903 (2011).
63
Z. Shi, P. G. Debenedetti, and F. H. Stillinger, J. Chem. Phys. 134,
114524 (2011).
64
R. Malshe, M. D. Ediger, L. Yu, and J. J. de Pablo, J. Chem. Phys.
134, 194704 (2011).
65
E. Le´on-Gutierrez, G. Garcia, M. Clavaguera-Mora, and
J. Rodr´ıguez-Viejo, Thermochim. Acta 492, 51 (2009).
66
E. Le´on-Gutierrez, G. Garcia, A. F. Lopeandia, M. T. ClavagueraMora, and J. Rodr´ıguez-Viejo, J. Phys. Chem. Lett. 1, 341 (2010).
67
E. Le´on-Gutierrez, A. Sep´ulveda, G. Garcia, M. Clavaguera-Mora,
and J. Rodr´ıguez-Viejo, PhysChemChemPhys 12, 14693 (2010).
68
M. Engel and H.-R. Trebin, Phys. Rev. Lett. 98, 225505 (2007).
69
T. Mizuguchi and T. Odagaki, Phys. Rev. E 79, 051501 (2009).
70
V. V. Hoang and T. Odagaki, Physica B 403, 3910 (2008).
71
V. V. Hoang and T. Odagaki, Solid State Comm. 150, 1971 (2010).
72
V. V. Hoang, Eur. Phys. J. D 61, 627 (2011).
73
V. V. Hoang and T. Odagaki, J. Phys. Chem. B 115, 6946 (2011).
174204-10
FREE SURFACE EFFECTS ON THERMODYNAMICS AND . . .
74
K. Nishio, J. Koga, T. Yamaguchi, and F. Yonezawa, J. Phys. Soc.
Jpn 73, 627 (2004).
75
M. Dzugutov, Phys. Rev. Lett. 70, 2924 (1993).
76
P. G. Debenedetti and F. H. Stillinger, Nature (London) 410, 259
(2001).
77
W. Kob, J. Phys. Condens. Matter 11, R85 (1999).
78
R. A. Rigglement and J. J. Pablo, J. Chem. Phys. 128, 224504
(2008).
79
F. W. Starr, S. Sastry, J. F. Douglas, and S. C. Glotzer, Phys. Rev.
Lett. 89, 125501 (2002).
80
E. Chacon, M. Reinaldo-Falagan, E. Velasco, and P. Tarazona,
Phys. Rev. Lett. 87, 166101 (2001).
81
H. Mo, G. Evmenenko, S. Kewalramani, K. Kim, S. N. Ehrlich,
and P. Dutta, Phys. Rev. Lett. 96, 096107 (2006).
82
J. S. Rowlinson and B. Widom, Molecular Theory of Capillary
(Dover, New York, 2002).
83
J. Du and A. N. Cormack, J. Am. Ceram. Soc. 88, 2532 (2005).
84
K. J. Dawson, K. L. Kearns, L. Yu, W. Steffen, and M. D. Ediger,
Proc. Natl. Acad. Sci. USA 106, 15165 (2009).
85
J. D. Honeycutt and H. C. Andersen, J. Phys. Chem. 91, 4950
(1987).
86
M. Miller and P. Liaw (eds.), Bulk Metallic Glasses (Springer, New
York, USA, 2007).
PHYSICAL REVIEW B 84, 174204 (2011)
87
V. V. Hoang and N. H. Cuong, Physica B 404, 340 (2009).
F. A. Lindemann, Z. Phys. 11, 609 (1910).
89
V. N. Novikov, E. Rossler, V. K. Malinovsky, and N. V. Surovtsev,
Europhys. Lett. 35, 289 (1996).
90
H. M. Flores-Ruiz, and G. G. Naumis, J. Chem. Phys. 131, 154501
(2009).
91
U. Buchenau and R. Zorn, Europhys. Lett. 18, 523
(1992).
92
B. Frick and D. Richter, Phys. Rev. B 47, 14795 (1993).
93
K. L. Ngai, J. Non-Cryst. Solid. 275, 7 (2000).
94
H. M. Flores-Ruiz, G. G. Naumis, and J. C. Phillips, Phys. Rev. B
82, 214201 (2010).
95
M. H. Cohen and G. S. Grest, Phys. Rev. B 20, 1077
(1979).
96
T. Tomida and T. Egami, Phys. Rev. B 52, 3290 (1995).
97
J. G. Dash, Contemp. Phys. 30, 89 (1989).
98
T. Egami, T. Tomida, D. Kulp, and V. Vitek, J. Non-Cryst. Solid.
156-158, 63 (1993).
99
M. D. Ediger, C. A. Angell, and S. R. Nagel, J. Phys. Chem. 100,
13200 (1996).
100
C. Donati, S. Glotzer, P. Poole, W. Kob, and S. Plimpton, Phys.
Rev. E 60, 3107 (1999).
101
M. D. Ediger, Annu. Rev. Phys. Chem. 51, 99 (2000).
88
174204-11