DSpace at VNU: Synthesis of indium phosphide nanocrystals by sonochemical method and survey of optical properties
Bạn đang xem bản rút gọn của tài liệu. Xem và tải ngay bản đầy đủ của tài liệu tại đây (900.82 KB, 5 trang )
Eur. Phys. J. Appl. Phys. (2013) 64: 10402
DOI: 10.1051/epjap/2013130011
THE EUROPEAN
PHYSICAL JOURNAL
APPLIED PHYSICS
Regular Article
Synthesis of indium phosphide nanocrystals by sonochemical
method and survey of optical properties
Ho Minh Trung1,2,a , Nguyen Duy Thien1 , Le Van Vu1 , Nguyen Ngoc Long1 , and Truong Kim Hieu2
1
2
Center for Materials Science, Faculty of Physics, VNU University of Science, 334 Nguyen Trai, Thanh Xuan, Hanoi, Vietnam
Faculty of Physics, Ho Chi Minh City University of Science, 227 Nguyen Van Cu, HCM City, Vietnam
Received: 3 January 2013 / Accepted: 8 March 2013
Published online: 4 October 2013 – c EDP Sciences 2013
Abstract. Indium phosphide semiconductor materials (InP) have various applications in the field of semiconductor optoelectronics because of its advantages. But the making of this material is difficult due to the
very weak chemical activity of In element. In this report we present a simple method to synthesize InP
nanocrystals from inorganic precursors such as indium chloride (InCl3 ), yellow phosphorus (P4 ), reduction
agent NaBH4 at low temperature with the aid of ultrasound. Structural, morphological and optical properties of the formed InP nanocrystals were examined by transmission electron microscopy (TEM), X-ray
diffraction (XRD), energy dispersed X-ray analysis (EDS), Raman scattering, absorption and photoluminscence (PL) spectroscopy. After the surface treatment of InP nanocrystals with liquid hydrofluoric (HF)
acid, the luminescence spectra have an enhanced intensity and consist of the peaks in the region from
500 nm to 700 nm. The intensity of these peaks strongly depends on the concentration and etching time
of HF.
1 Introduction
Nanostructured materials are an important research object of science and technology. Compared with the bulk
materials, the nanomaterials exhibit some new unique properties due to the quantum confinement effect, which can
bring various promising applications in science and technology and in the life as well. While most studies in the
area of nanomaterials focus on II–VI semiconductor
nanocrystals (NCs) [1], the studies and applications of
III–V compound NCs are rather sparse as compared to
II–VI NCs. This is because the synthesis of colloidal
III–V nanoparticles is more difficult than for II–VI NCs.
The reason for this is that III–V semiconductor
compounds are more covalent, and high temperatures are
required for their synthesis. However, because III–V NCs,
for example indium phosphide (InP) and gallium phosphide (GaP), have emission wavelengths ranging from the
blue region to the near infrared one, they are promising
alternatives to the CdSe-based nanoparticles for applications such as light-emitting diodes (LEDs), photovoltaic
cells, bio-labeling, etc. On the other hand, among the
III–V compounds, bulk InP has a narrow band
gap (1.35 eV) and, in particular, an exciton Bohr radius
of 11.3 nm [2], which is larger than that of CdSe (3.5 nm).
Hence, it can be expected to easily prepare InP NCs exhibiting a strong quantum confinement effect.
Until now, many routes have been employed for
synthesis of InP NCs, including thermolysis reactions of
indium chloride (InCl3 ) and P(Si(Me3 )3 ) in trioctylphosphine oxide (TOPO) and trioctylphosphine (TOP) at
elevated temperatures [3], reactions of indium acetate
(In(Ac)3 ) with in situ generated gaseous PH3 from
Ca3 P2 [4], reactions of InCl3 , yellow phosphorus (P4 ) and
reducing agent (NaBH4 ) at low temperatures [5], and reactions of precursor chemicals (InCl3 , P4 , KBH4 ) with
assistance of ultrasound [6].
It has been well established that the ultrasonic irradiation introduces a variety of physical and chemical effects
deriving from acoustic cavitation [7]. Such cavitation behavior, i.e., the formation, growth and implosive collapse
of bubbles, has been used extensively to generate novel
materials with unusual properties.
In the present paper we prepared InP NCs by using
the reaction of indium chloride and yellow phosphorus as
the In and P precursors, respectively, and a reducing agent
(sodium borohydride) with the aid of ultrasound irradiation. Structural and optical properties of the synthesized
InP NCs were examined.
2 Experimental
International Workshop on Advanced Materials and
Nanotechnology 2012 (IWAMN 2012).
a
e-mail:
All the chemicals used in our experiment, including indium chloride, yellow phosphorus and sodium borohydride,
10402-p1
The European Physical Journal Applied Physics
by a Shimadzu UV 2450 PC spectrometer. PL measurements were performed on a spectrometer Fluorolog FL
3-22 Jobin-Yvon-Spex, USA used 450 W xenon lamp as
an excitation source.
3 Results and discussion
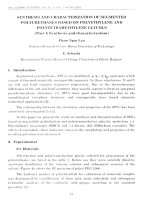
Fig. 1. Flowchart for preparing InP NCs by sonochemical
method.
are of analytic grade without further purification. The typical procedure of InP nanocrystal preparation used in our
experiment was as follows (Fig. 1): 0.74 g (2.5 mmol) of
InCl3 ·4H2 O was dissolved in 25 mL of ethanol and 0.62 g
(5 mmol) of P4 was dissolved in 25 mL of toluene. In order to completely dissolve the precursors, the above two
solutions were ultrasonically stirred for 15–60 min, using
a commercial ultrasonic cleaner. Then 0.57 g (15 mmol) of
NaBH4 was totally dissolved in 75 mL of ethanol and was
gradually dropped (1 mL/min) into the flask containing
the mixture of the above In and P precursor solutions. At
the same time, the mixture was exposed to ultrasound irradiation under ambient air for 4 h at the temperatures of
37, 47 and 57 ◦ C. Ultrasound irradiation was accomplished
with a high intensity ultrasound probe (Sonics VCX 750;
1.3 cm in diameter; Ti horn, 20 kHz, ultrasound power
density was 100 W/cm2 ) immersed 1 cm in depth directly in the reaction solution. The mixture changed its
color gradually from yellow to black-brown. The resulting
precipitates were separated by centrifugation (6000 rpm,
10–20 min), washed repeatedly with toluene, ethanol, dilute hydrochloric acid (HCl) solution and distilled water,
and finally dried at 60 ◦ C in argon atmosphere for 2 h.
The as-prepared InP NCs did not emit light or exhibited a
very weak PL. Therefore, the InP NCs underwent surface
treatment with HF. The HF-etching solution was prepared
by mixing appropriate amounts of aqueous HF (48%) solution, n-butanol, TOPO and H2 O. The InP NCs were
added into the HF stock solution with different HF:InP
molar ratios under room light.
Crystal structure of the synthesized products was analyzed by X-ray diffraction (XRD) using an X-ray diffractometer Siemens D5005, Bruker, Germany, with
Cu-Ka1 (λ = 0.154056 nm) radiation. The surface morphology of the samples was observed by using a JEOL
JEM 1010 transmission electron microscope. The composition of the samples was determined by an energydispersive X-ray spectrometer (EDS) Oxford ISIS 300
attached to the JEOL-JSM5410 LV scanning electron microscope. Raman measurements were carried out by using
LabRAM HR 800, Horiba spectrometer with 632.8 nm
excitation. The UV-vis absorption spectra were obtained
In our experiment the InP was formed from the mixtures of InCl3 ·4H2 O, P4 and NaBH4 in the mixed solvents
of ethanol and toluene under the high intensity ultrasonic irradiation. In this reaction solution, first NaBH4 reduces In3+ in the dissolved InCl3 ·4H2 O to indium element,
then the indium reacts with yellow phosphorus to form
InP. This process can be described by the following
equation [5,6]:
4InCl3 +12NaBH4 +P4 → 4InP + 12NaCl + 6B2 H6 + 6H2
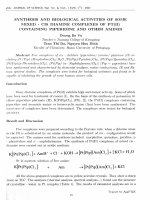
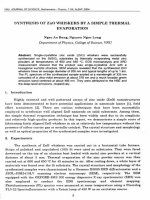
The XRD patterns of as-prepared NCs synthesized at different temperatures are shown in Figure 2. It can be seen
that the synthesis temperature is an important fact to
affect the crystallization process of the nanocrystal. At
temperature of 37 ◦ C no InP NCs could be formed, in
addition, in the pattern one can clearly observe a strong
diffraction peak at 32.9◦ and a weak peak at 39.2◦ , which
correspond to the (1 0 1) and (1 1 0) diffraction planes
of the indium metal with the tetragonal phase structure,
respectively. Thus, at the temperature as low as 37 ◦ C,
only indium metal particles were created. With increasing the temperature up to 47 ◦ C, the reflective peaks
related to In metal became weaker and the InP-related
peaks began to appear. When the synthesis temperature
rose up to 57 ◦ C, InP NCs could be favorably formed. The
peaks in the XRD patterns located at 2θ values of 26.2◦ ,
43.6◦ and 52.0◦ correspond to the (1 1 1), (2 2 0) and
(3 1 1) diffraction planes, respectively, in cubic sphalerite
InP crystal. The lattice constant determined from
Fig. 2. XRD patterns of InP nanocrystalline powders prepared
at different temperatures.
10402-p2
H.M. Trung et al.: Synthesis and optical properties of InP nanocrystals
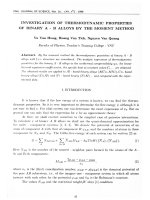
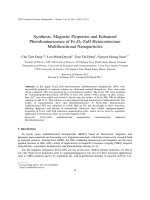
Fig. 3. EDS patterns of InP nanocrystalline powders.
Fig. 5. Typical Raman scattering spectrum of the InP
nanocrystals.
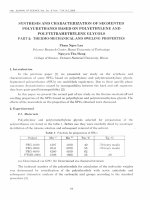
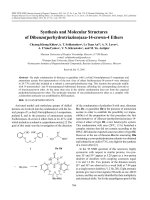
Fig. 4. TEM images of InP nanocrystalline powders.
the XRD patterns is a = 0.588 ± 0.002 nm, which is
in agreement with the standard values (a = 0.5869 nm,
JCPDS card No. 32-0452).
Typical EDS spectra of the InP nanocrystalline powders are shown in Figure 3. The EDS spectra of all the InP
samples exhibit the peaks related to elements In and P. It
is noted that the oxygen (O) observed in the EDS spectra
is the residual not totally removed during washing. It is
found that for the InP NCs prepared with the In:P molar
ratio of 1:2, the In:P atomic ratio was 1.42.
The TEM image of InP powders depicted in Figure 4
indicates that the InP NCs agglomerated into the bigger
spherical nanoparticles which have a broad size distribution.
Figure 5 shows typical Raman scattering spectrum of
the InP NCs. The sharp scattering peaks around 306 and
339 cm−1 , which are close to that of the bulk InP (TO:
304 cm−1 , LO: 345 cm−1 [8]), are assigned to the InP
transverse-optical (TO) mode and longitudinal-optical
(LO) lattice vibration modes, respectively. The observation of the TO and LO lattice vibration modes once again
indicates that the InP NCs were really formed.
The room temperature UV-vis absorption spectrum of
the InP NCs dispersed in ethanol is presented in Figure 6. It can be seen that the ethanol (line (a)) almost
does not absorb the electromagnetic waves in the range of
250–900 nm. When InP NCs are dispersed in ethanol,
Fig. 6. Typical UV-vis spectrum of the InP NCs dispersed
in ethanol. The ethanol absorption spectrum is depicted for
comparison. The inset shows the plot of (αhν)2 versus hν.
the absorption becomes stronger (lines (b)). No excitonic
structure is observed in Figure 6. For InP NCs the absorption spectra without excitonic structure were observed in
the NCs with diameter larger than 4 nm [9]. The reason
for this mainly is a sufficiently wide size distribution which
could easily mask excitonic peaks in quantum dots [9].
It is well known that cubic InP is a direct-gap semiconductor. The relation between the absorption coefficients
(α) and the incident photon energy (hν) for the case of
allowed direct transition is written as follows [9,10]:
αhν = A(Eg − hν)1/2 ,
where A is a constant and Eg is the band gap of the material. The plot of (αhν)2 versus hν for the InP NCs dispersed
in ethanol is represented in the inset of Figure 6. By using
this plot we found the band gap of the InP NCs dispersed
in ethanol to be 2.74 eV. Compared with the bulk InP
10402-p3
The European Physical Journal Applied Physics
Fig. 7. PL spectra of the InP NCs prepared at 47 and 57 ◦ C,
and that had undergone a surface treatment with HF (HF:InP
molar ratio = 22:1) for 9 days. (The line at 540 nm is an
emission of HF containing solution.)
Fig. 9. PL spectra of InP NCs at different etching times with
HF:InP molar ratio = 44:1.
We have found that the PL intensity increases with HF
concentration and etching time. Figure 8 shows the PL
spectra of the InP NCs that had undergone a treatment
with various amounts of HF at etching time of 3 days.
Figure 9 depicts the PL spectra of the InP NCs that
had undergone a treatment with HF (HF:InP = 44:1) at
different etching times. The reason for the observed increase in PL intensity, according to Micic et al. [12], is due
to the HF-etching treatment of InP NCs, which removes
or passivates surface states (phosphorus vacancies, dangling bounds, etc.) acting as non-radiative recombination
centers.
4 Conclusion
Fig. 8. PL spectra of the InP NCs that had undergone a surface treatment at etching time of 3 days with various HF:InP
molar ratios.
band gap of 1.35 eV, the blue shift of 1.39 eV exhibits the
quantum confinement effect.
The as-prepared InP NCs did not emit light or exhibited a very weak PL. After the surface treatment with
liquid HF, the InP NCs show an enhanced PL, which consists of the peaks in the wavelength region from 500 nm to
700 nm (Fig. 7). As seen from the figure, each PL spectrum
is the overlap of two emission bands: the short wavelength
one and the long wavelength one. The similar PL spectra
were observed by other authors [2,11], in which the short
wavelength band was attributed to the exciton emission
and the long wavelength band was associated with a defect
state-to-band recombination.
InP NCs have been synthesized by sonochemical method
using the precursors such as indium chloride, yellow phosphorus and reduction agent. XRD analysis indicated that
the InP NCs possess face-centered-cubic crystal structure
with a lattice constant a = 0.588 ± 0.002 nm. The InP NCs
have spherical form with a broad size distribution. The
Raman scattering spectra exhibiting the InP TO
(306 cm−1 ) and LO (339 cm−1 ) lattice vibration modes
have indicated the formation of InP NCs as well. The band
gap of the InP NCs estimated from UV-vis absorption is
about 2.74 eV. The InP NCs after HF-etching treatment
exhibit an enhanced PL with the intensity depending on
the HF concentration and etching time.
This work is financially supported by Ministry of Science and
Technology of Vietnam (Project No. 103.02.51.09 from
NAFOSTED).
References
1. Nanocrystal Quantum Dots, V.I. Klimov (Ed.), 2nd edn.
(CRC Press, Taylor & Francis Group, Boca Raton,
London, New York, 2010)
10402-p4
H.M. Trung et al.: Synthesis and optical properties of InP nanocrystals
2. L. Langof, L. Fradkin, E. Ehrenfreund, E. Lifshitz, O.I.
Micic, A.J. Nozik, Chem. Phys. 297, 93 (2004)
3. A.A. Guzelian, J.E.B. Katari, A.V. Kadavanich, U. Banin,
K. Hamad, E. Juban, A.P. Alivisatos, R.H. Wolters, C.C.
Arnold, J.R. Heath, J. Phys. Chem. 100, 7212 (1996)
4. L. Li, M. Protiere, P. Reiss, Chem. Mater. 20, 2621 (2008)
5. U.T.D. Thuy, T.T.T. Huyen, N.Q. Liem, P. Reiss, Mater.
Chem. Phys. 112, 1120 (2008)
6. B. Li, Y. Xie, J. Huang, Y. Liu, Y. Qian, Ultrason.
Sonochem. 8, 331 (2001)
7. Y. Mastai, A. Gedanken, in The Chemistry of
Nanomaterials: Synthesis, Properties and Applications,
Vol. 1, C.N.R. Rao, A. Muller, A.K. Cheetham (Eds.),
(Wiley-VCH Verlag GmbH & Co. KGaA, Weinheim,
2004), p. 113
8. H. Yang, W. Yin, H. Yang, Y. Song, J. Phys. Chem. Solids
69, 1017 (2008)
9. O.I. Micic, J.R. Sprague, C.J. Curtis, K.M. Jones, J.L.
Machol, A.J. Nozik, H. Giessen, B. Fluegel, G. Mohs, N.
Peyghambarian, J. Phys. Chem. 99, 7754 (1995)
10. E.J. Johnson, in Semiconductors and Semimetals, R.K.
Willardson, Albert C. Beer (Eds.), Vol. 3, Optical
Properties of III-V Compounds (Academic Press, New
York, London, 1967), p. 153
11. S. Xu, J. Ziegler, T. Nann, J. Mater. Chem. 18, 2653
(2008)
12. O.I. Micic, J. Sprague, Z. Lu, A.J. Nozik, Appl. Phys. Lett.
68, 3150 (1996)
10402-p5