Seasonal forecasting of tropical cyclone activity in the coastal region of Vietnam using RegCM4.2
Bạn đang xem bản rút gọn của tài liệu. Xem và tải ngay bản đầy đủ của tài liệu tại đây (1.91 MB, 15 trang )
CLIMATE RESEARCH
Clim Res
Vol. 62: 115–129, 2015
doi: 10.3354/cr01267
Published online January 14
FREE
ACCESS
Seasonal forecasting of tropical cyclone activity in
the coastal region of Vietnam using RegCM4.2
Tan Phan-Van*, Long Trinh-Tuan, Hai Bui-Hoang, Chanh Kieu
Department of Meteorology, VNU Hanoi University of Science, 334 Nguyen Trai, Thanh Xuan, Hanoi, Vietnam
ABSTRACT: This study presents an experimental seasonal forecast of tropical cyclone (TC) activity for Vietnam’s coastal region during the 2012−2013 typhoon seasons, using the Regional Climate Model (RegCM, version 4.2) to downscale the global Climate Forecasting System (CFS) forecast. Using an improved vortex tracking algorithm that detects vortex centers efficiently, RegCM
reasonably forecasts the general distribution of TC counts in time as well as the TC track pattern
during the entire experimental period from February to July 2012 and 2013, despite significant
underestimation of the TC counts in the global CFS forecasts that are used as initial and lateral
boundary conditions for the RegCM model. Further examination of the storm activity in the Vietnam East Sea that directly influences Vietnam’s coastal region shows, however, that RegCM tends
to overestimate the TC frequency in this sub-region compared to observation. This suggests that
direct applications of the RegCM model for seasonal forecasts of TC activity in Vietnam’s coastal
region has a significant bias that will need to be corrected before the model can provide useful
information.
KEY WORDS: Seasonal forecasting · Tropical cyclone · TC detection · Vietnam · Dynamical
downscaling
Resale or republication not permitted without written consent of the publisher
1. INTRODUCTION
Seasonal forecasts of tropical cyclone (TC) activity
play a critical role for risk management and economic assessments. This is particularly the case for
regions with high population densities along coastlines that are under threat of landfalling TCs. With a
coastline of > 3000 km, Vietnam is vulnerable to the
impact of TCs in the Northwestern Pacific (WPAC)
basin. Of about 28 typhoons originating in the WPAC
basin each year, about 10 move over the Vietnam
East Sea (VES; also called the South China Sea). Of
these, 4 to 6 storms have a direct influence on Vietnam’s coastline, causing a significant impact on society and economic activity. Seasonal real-time forecasts of TCs in the WPAC basin, especially those
confined within the VES to the east of Vietnam, are
still challenging because of the difficulties in quantifying TC behavior in such a limited region (Chan et
al. 1998, Chan, 2008).
Roughly speaking, there are 3 main approaches to
seasonal TC forecasting: (1) a dynamical approach in
which numerical climate models are used to predict
TC formation and development, (2) a statistical approach with some assumed empirical relationship
between TC activity and a set of selected predictors;
and (3) a combination of the statistical and dynamical
approach, the so-called statistical-dynamical method
(see e.g. Chan et al. 2001, Camargo & Barnston 2009,
Klotzbach & Gray 2009, Vecchi et al. 2011, Kim et al.
2012, Lu et al. 2013). Of the 3, statistical methods appear to be dominant in most seasonal forecasts, due
to their relatively higher skill and inexpensive computation compared to the coarse resolution climate
models (Klotzbach 2007, Vitart et al. 2010, Yeung &
Chan 2012).
Recent advances in climate modeling have resulted
in a new generation of climate models that could provide skillful seasonal forecasts of TC activity, comparable in skill to the statistical forecasts, especially
*Corresponding author:
© Inter-Research 2015 · www.int-res.com
116
Clim Res 62: 115–129, 2015
when used as input for statistical-dynamical models.
In particular, regional climate models play an important role in climate projections under different climate change scenarios, which statistical models
could not achieve alone (Vitart et al. 2010, Vecchi et
al. 2011, Kim et al. 2012). Nonetheless, inherent uncertainties in the model dynamics and representations of physical and thermodynamic feedbacks, as
well as inaccurate boundaries, render climate models
in general less accurate than the statistical approach
at long forecast lead times. In fact, the most reliable
seasonal forecasts of TC activity still rely on a statistical approach rather than on the pure dynamical climate models (Klotzbach & Gray 2009, Vitart et al.
2010).
Given current model uncertainties, seasonal TC
forecasting based on global or regional climate models has been so far mostly experimental. Operational
seasonal forecasts provided by the National Centers
for Environmental Prediction (NCEP) Climate Forecast System (CFS) are perhaps the most used seasonal products available in real time (Saha et al.
2010). The CFS system consists of 6 mo forecasts
available daily with 6-hourly outputs, and serves a
wide range of downstream seasonal applications1. A
growing number of studies of the CFS forecasting
system demonstrate its capability in seasonal forecasting, including forecasts of ENSO variability and
precipitation over the tropical region (Kirtman & Min
2009, Wang et al. 2010, Sooraj et al. 2012), intraseasonal oscillation and winter persistent inversions
(Gillies et al. 2010), SST anomalies (Wu et al. 2009),
and extreme climate events (Becker et al. 2013).
Because of their coarse resolution and simplified
physics, direct applications of the CFS products to
regional climate forecasts are difficult in practice.
Thus, dynamical downscaling of the CFS products
with a regional climate model is necessary to enhance the regional characteristics. This downscaling
is especially vital for TC forecasting because TC
intensity and development depends strongly on the
model resolution and model physics (Bengtsson et al.
2007, Vitart et al. 2010, Yeung & Chan 2012, Strachan
et al. 2013, Vecchi et al. 2014). As a result, using only
the CFS forecasts would provide an unreliable count
of TC numbers. A recent study by Yeung & Chan
(2012) demonstrated the necessity of regional downscaling in TC seasonal forecast for the WPAC basin,
1
Inventory and support for this CFS dataset can be found on
the NCEP climate forecast system (CFS) products website
at: />prod/cfs
using the Regional Climate Model (RegCM) to
dynamically downscale the ERA40 reanalysis. Their
study showed that RegCM is capable of reproducing
the climatology of the TC activity in the WPAC basin
fairly well in terms of spatial and temporal distribution during the 1982−2001 period. Nevertheless,
Yeung and Chan’s study focused more on the general
hindcasting of TC genesis and development over the
WPAC basin with the ERA-40 dataset, rather than
real-time seasonal forecasting. Therefore it has only
limited application to seasonal forecasting of TCs
along Vietnam’s coastal region, defined as a zone extending to the meridian of 120° E from Vietnam’s
coastal baseline (hereinafter referred to as the VNC
area).
With the CFS products available in real-time, it is
of interest to examine how they can be applied to
regional TC forecasting. In this study, we examine
the capability of the RegCM model in downscaling
the CFS products for seasonal forecasts of TCs in the
VES that could potentially influence Vietnam’s coastline. Although there have been some studies of seasonal typhoon forecasting for the WPAC basin (Chan
et al. 1998, 2001, Lu et al. 2010, Kim et al. 2012,
Yeung & Chan 2012), explicit forecasts of TC activity
for the VNC area are still inadequate. In this study,
we present a modified vortex tracking algorithm that
is designed specifically for detecting TC-like vortices
from the RegCM model output. This vortex track
algorithm is needed to improve the capability of the
RegCM model in forecasting of TC activity, due to
RegCM’s coarse resolution.
2. EXPERIMENTAL DESCRIPTION
2.1. Model
In this study, version 4 of the Regional Climate
Model (RegCM4.2) was used to provide experimental
real-time seasonal forecasts of TC activity for the
2012−2013 seasons in the WPAC basin, with the main
focus on TCs that are most influential to the VNC area.
The RegCM model was based on the FourthGeneration Mesoscale Model developed in the 1980s
(Dickinson et al. 1989, Giorgi & Bates 1989, Giorgi et al.
1993a,b). RegCM4.2 was a hydrostatic version in the
vertical sigma coordinate that shared many features of
the hydrostatic version of the fifth-generation Pennsylvania State University−National Center for Atmospheric Research Mesoscale Model (MM5; Grell et al.
1994). Several fundamental differences compared to
MM5 include the land surface scheme, the radiation
Phan et al.: Seasonal tropical cyclone forecasting
parameterizations, and convective schemes (Elguindi
et al. 2004). Recent upgrades of the RegCM model included a number of new physics packages that were
based on physics schemes of the Community Climate
Model, including new aerosol radiative transfer calculations, a new prognostic equation for cloud water,
and a new parameterization of surface land use (see,
e.g. Pal et al. 2007, Solmon et al. 2008, Elguindi et al.
2011, Giorgi & Anyah 2012, Giorgi et al. 2012 for more
information).
In all experimental real-time forecasts, RegCM4.2
is configured with a horizontal grid spacing of 36 km,
18 vertical sigma levels, and the model top at 10 hPa.
The model domain is centered at 20° N, 140° E, and
consists of 146 grid points in the east-west direction
and 288 grid points in the north-south direction,
spanning an area from 100 to 180° E and 5° S to 40° N
(Fig. 1). This domain is sufficiently large to capture
not only storms formed in the VES, but also most of
TCs formed in the far-east region of the Philippines
archipelago that could travel to the region. The
model time step was set to 60 s. Model physics
schemes used in this study consist of (1) the Community Climate Model Version 3 (CCM3) radiative
transfer scheme, (2) the Biosphere Atmosphere Transfer Scheme (BATS) land surface scheme, and (3) the
Grell-Arakawa-Schubert cumulus parameterization
scheme (Grell-AS). A sensitivity study of the RegCM
model (Phan et al. 2009) suggested that these above
schemes are adequate for simulating climate in Vietnam and Southeast Asia. Therefore, these parameterization schemes were chosen for the seasonal
TC forecast in all of our experiments.
117
2.2. Real-time experiment
The experiments were conducted during the
2012−2013 typhoon seasons using the RegCM4.2
model to downscale the global CFS products,
which were provided in real-time by NCEP at the
horizontal resolution of 1 × 1° (RegCM_CFS1.0).
The experiments were designed with the main
focus on the 6 mo forecasts of TC activity, and were
configured with a single domain as mentioned
above. Forecasts began at 00:00 h UTC January 1
2012 and were updated every 7 d thereafter (i.e.
there were four 6 mo forecasts conducted in each
month). Lateral boundary conditions including the
SST were updated every 6 h from the CFS forecasts. Each 6 mo forecast generated 6-hourly 3dimensional output consisting of horizontal wind,
potential temperature, geopotential height on the
pressure surfaces, and the sea level pressure. The
output was subsequently post-processed by a modified vortex tracking program that detected and followed any vortex within the model domain. The
real-time experiments were carried out during a
4 mo period from February to May in both 2012
and 2013 to generate 6 mo forecasts of TC activity
in the WPAC basin and the VNC region (i.e. from
March to August, April to September, May to October, and from June to November in 2012 and 2013).
These forecasts supported risk management and
natural disaster prevention actions by the Vietnam
National Hydro-meteorological Service, for which
we were responsible.
2.3. Dataset
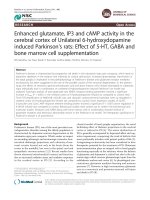
Fig. 1. Model domain configuration of the RegCM4.2 for experimental
real-time forecasts of tropical cyclone (TC) activity for Vietnam’s coastal
region in the 2012−2013 seasons
The primary data used in this study consists of (1) NCEP Climate Forecast System
Reanalysis (CFSR) data for the period
1995−2010, and (2) NCEP CFS Version 2
real-time forecast data for the period 2012−
2013. These datasets are available in
GRIB2 format with a 6-hourly interval.
Both the CFS and the CFSR gridded data
are provided 4 times per day at the synoptic times of 00:00, 06:00, 12:00, and 18:00 h
UTC. Note that the CFSR datasets are
provided at 2 resolutions, i.e. 0.5 × 0.5°
(CFSR0.5) and 2.5 × 2.5° (CFSR2.5), whereas the CFS real-time forecast datasets are
archived on a 1 × 1° grid (CFS1.0), which
could allow for the representation of the
TC circulation and steering flow to some
118
Clim Res 62: 115–129, 2015
degree. Of course, the TC intensity and inner core
structure are barely represented at these coarse resolutions, and therefore dynamical downscaling of the
CFS products is needed to better capture the TC
development and multi-scale interaction (Walsh &
Ryan, 2000, Strachan et al. 2013).
An additional dataset used to verify the TC frequency in the WPAC basin for both the baseline and
real-time experiments is the TC best track data
archived by Unisys Weather Information Systems
(Unisys2) during the 1995−2013 period. This dataset
contains the latitudes and longitudes of storm centers, storm lifetime, and storm intensity, and it is
divided into different basins. This Unisys dataset is
used for all the verifications in this study. Although
there are several different databases from different
agencies such as those maintained by Joint Typhoon
Warning Center (JTWC) or the Japan Meteorological
Agency, they are not consistent in terms of the exact
storm locations or intensity (Knapp & Kruk 2010).
Nevertheless, these datasets are reliable in terms of
the number of TCs, the intensity phases as well as the
general track patterns. Since this study focuses
mostly on the TC frequency and seasonal variations,
such discrepancies in TC absolute intensity should
have minimum impact on our analysis. Thus, the
Unisys dataset can be expected to provide an adequate basis for use in this study.
3. IMPROVED VORTEX TRACKING ALGORITHM
With a typical horizontal resolution around 1 × 1°
in most global climate models, a model vortex tends
to exhibit few signals of the central temperature
anomaly (warm core), the minimum sea level pressure, or the maximum surface wind speed (Bengtsson et al. 1995, Walsh 1997, Walsh & Watterson
1997, Yeung & Chan 2012, Strachan et al. 2013). For
regional climate models with higher resolution,
storm circulations are better represented, but model
representations are still not comparable to the
actual storms in terms of TC size and intensity.
Therefore, an efficient vortex tracking algorithm is
essential in order to reliably detect TC vortices from
the model products.
In general, a vortex tracking algorithm examines a
variety of fields including vorticity, surface wind,
temperature at particular pressure levels, and the
minimum sea level pressure (Bengtsson et al. 1995,
Walsh 1997, Walsh & Watterson 1997, Nguyen &
2
The Unisys dataset is available at
Walsh 2001, Yeung & Chan 2012). Nevertheless, Camargo & Zebiak (2002) showed that these parameters
may sometimes capture local disturbances instead of
proper TCs. They concluded that a tracking algorithm
may need to be modified for different regions, model
dynamics, or model resolution. Therefore, the threshold values are not universal and need to be tuned in
properly for each specific model application.
In this study, we modified a version of the vortex
tracking algorithm proposed by Walsh (1997) for our
purpose of tracking vortices in the VNC region. In
contrast to the original method that emphasizes on
the vorticity parameter, our method considers a
wider range of criteria. Our modified tracking algorithm fulfils 2 requirements: (1) the tracking method
has to detect storms with at least tropical depression
strength as well as all typical TC characteristics, not
only in the open ocean but also close to coastlines;
and (2) it must have the capability to distinguish one
vortex from the other nearby so that the total TC
count is computed correctly. While there are several
different methods for tracking TC-like vortices in
weather forecasting models, the main difficulty when
using regional climate models is that their relatively
low resolutions are not adequate to capture the TC
characteristics of interest (see e.g. Walsh & Ryan
2000). This limitation is compounded by the simplified model physics that is used in climate models to
integrate data efficiently over a long period of time.
Our modified vortex tracking algorithm consists of
2 main phases: a detection phase and a tracking
phase. In the detection phase, the model outputs are
interpolated from the model (sigma) levels to 4 standard isobaric levels at 850, 700, 500 and 300 hPa. For
the tracking phase, the following steps are carried
out at each instant of model output:
(1) At each time step, a grid point is checked to see
if its relative vorticity is a local maximum and has a
value that is greater than a given threshold. The local
maximum is identified by checking if the vorticity is
larger than the vorticity of the 4 adjacent points in
meridional and zonal directions. If the grid point satisfies this condition, a candidate for storm vortex center is marked.
(2) If a candidate grid point is found, the minimum
sea level pressure within a radius of 250 km from the
candidate grid point is searched using the downhill
method combined with 2-dimensional spline interpolation. The location of the minimum sea level pressure after this step does not necessarily coincide with
any model grid point because of the interpolation.
(3) If a minimum sea level pressure is found, other
indicators are used to determine if this is a storm
Phan et al.: Seasonal tropical cyclone forecasting
119
center. The following criteria are employed: (i) The
associated with high vorticity anomalies or a spurious
minimum sea level pressure anomaly (DP), defined as
low pressure area related to steep topography. Sensithe difference between the storm center pressure
tivity experiments with different thresholds of vortic(Pcenter) and the environment pressure (Penv), is smaller
ity revealed that the original algorithm by Walsh
than a given threshold; (ii) the core temperature
tends to produce too many TC centers along the
anomaly (DT), calculated as a weighted average of
Philippines archipelago, over land, or near coastlines
temperature anomaly at isobaric levels, must be posiwhere vorticity has some artificial local point-like
tive; and (iii) the outer core wind strength (OCS) has
maximum. Thus, the vorticity criterion is relaxed in
to be greater than a given value, which is best tuned
our algorithm to eliminate those multiple unrealistic
for each specific model configuration and resolution.
vortex centers near the coastal zone.
(4) If all of the above criteria are satisfied, the locaAs a demonstration of the new tracking algorithm,
tion of the minimum sea level pressure obtained as
Fig. 3 shows the mean bias error and the root mean
described above is considered to be the center of a
square errors of the TC counts detected within the
TC vortex. Since the detection is performed at each
1995−2010 period for 9 different sets of vortex trackarchive interval (every 6 h), it is important that the
ing thresholds. Nine different combinations of vortex
detection process be able to distinguish whether the
tracking criteria including the relative vorticity, OCS,
newly found center belongs to an old vortex from the
and DP are used to select optimum criteria that proprevious archive interval or is the center of a new
vide best-fit TC counts compared to observation. A
storm. This is done by checking the
existence of any storm at the current
time and the previous time within a
domain of radius 250 km around the
current center vortex. Assuming that
the distance between 2 TCs is no less
than 250 km, this procedure should
eliminate virtually all binary vortex
situations. The processes are then repeated for the next cycle until the end
of the searching period.
Note that OCS is defined as an average of the tangential wind speed at 36
Fig. 2. Grid points (circles) in the cylindrical coordinate for calculating (a) the
points on 4 circles within an annulus
outer core wind and (b) the tropical cyclone (TC) warm core anomaly in the
domain between 2 circles of radii 1
new vortex tracking algorithm. Cross and red point indicate the TC center
and 2.5° (Weatherford & Gray 1988)
(Fig. 2a). The average on these cona
b
centric points is calculated by interpoR_0
R_0
30
0.50
lating the wind field from the model
20
0.40
R_HIGH
R_V1
R_HIGH
R_V1
native grid to the cylindrical coordi10
0.30
0
nate using the spline method. Simi0.20
–10
larly, calculations of other field anom- R_LOW
0.10
R_V2 R_LOW
R_V2
–20
–30
0.00
alies such as DP or DT are done by
subtracting the value of the field at the
R_P2
R_O1
R_P2
R_O1
vortex center from the average of 8
points on a circle with radius of 2.5°
R_P1
R_O2
R_P1
R_O2
from the center (Fig. 2b). The weights
for calculating DT are 0.4, 0.3, 0.2, and
Fig. 3. (a) Two-dimensional (radar) chart of the mean bias error (ME; solid
0.1 at isobaric levels of 300, 500, 700
lines) and root mean square errors (RSME; dashed lines) for the 9 different sets
and 850 hPa respectively. In contrast
of vortex-tracker parameters listed in Table 1, with respect to the observed
tropical cyclone (TC) counts during the 1995−2010 period. Blue lines show reto the original algorithm by Walsh
sults for the Climate Forecasting System Reanalysis (CFSR) database at the
(1997), our modified algorithm puts
horizontal resolution of 0.5 × 0.5° (CFSR0.5); red lines show results using the
more weight on OCS as the primary
RegCM model at the horizontal resolution of 36 km with the 2.5 × 2.5° CFSR
criterion to distinguish between a true
data (RegCM_CFSR2.5). (b) As (a), but showing correlations with respect to
the observed TC counts
TC circulation and spurious centers
Clim Res 62: 115–129, 2015
120
complete description of each set of criteria is given in
Table 1. Note that the dataset for testing the vortex
tracking algorithm is from the CFSR database at
the horizontal resolution of 0.5 × 0.5° (hereinafter
CFSR0.5), whereas the downscaling simulations were
conducted using the RegCM model at the horizontal
resolution of 36 km with the 2.5 × 2.5° CFSR data
(hereinafter RegCM_CFSR2.5). In the downscaling
experiments, the CFRS2.5 data was used as input lateral boundary conditions (updated every 6 h).
As seen in Fig. 3, both CFSR0.5 and RegCM_
CFSR2.5 show that the most sensitive parameter in
tracking storm centers is the minimum sea level pressure deficit DP. While changing the vorticity and
OCS threshold does not change the errors in TC
count noticeably, a small change in the DP threshold
leads to significant variation in both mean bias and
the absolute errors. Of the 9 criteria tested, the R_0
criteria with DP = −5 hPa, vorticity ζ = 5 × 10⁻⁵ s−1,
and OCS = 5 m s−1 give the smallest TC count errors
and bias for the RegCM_CFSR2.5 dataset (Fig. 3a).
The correlation for R_0 is however smaller than that
obtained directly detection from the CFSR0.5 dataset
(Fig. 3b), indicating that the annual variation of the
TC counts detected in RegCM_CFSR2.5 downscaling
is less consistent compared to the observed TC
counts (cf. also Fig. 4). Although the correlation is
highest for the R_P1 criteria (0.228, compared to
0.123 for the R_0 criteria) (Fig. 3b), we chose the R_0
criteria for application of our vortex tracking algorithm in RegCM downscaling, because of its smaller
mean bias and root mean square errors. Note that
vortex tracking in the CFSR0.5 dataset is more sensitive to changes in DP because of its coarser resolution
(~55 km, compared to the 36 km resolution in the
RegCM downscaling). As such, thresholds for
Table 1. Nine different sets of criteria for the vortex tracking
algorithm. ζ: vorticity; OCS: outer circulation wind speed; DP:
minimum sea level pressure deficit threshold. Note that the
criteria R_LOW and R_HIGH adopt the lowest and highest
bounds, respectively, for each of the 3 parameters
Criterion
ζ (s−1)
OCS (m s−1)
DP (hPa)
R_0
R_V1
R_V2
R_O1
R_O2
R_P1
R_P2
R_LOW
R_HIGH
5 × 10⁻⁵
1 × 10⁻⁵
1 × 10⁻⁴
5 × 10⁻⁵
5 × 10⁻⁵
5 × 10⁻⁵
5 × 10⁻⁵
1 × 10⁻⁵
1 × 10⁻⁴
5
5
5
3
7
5
5
3
7
−5
−5
−5
−5
−5
−3
−7
−3
−7
Fig. 4. Interannual TC variation detected from the RegCM_
CFSR2.5 data (dashed lines) and directly from CFSR0.5
(solid lines), using the vortex tracking thresholds R_0 and
R_DP0 (see Table 3). Bars: observed TC counts (OBS) during
the same period. Further abbreviations as in Fig. 3 legend
CFSR0.5 can be expected to differ from those obtained for the RegCM output. Our sensitivity experiment with further stratification of the pressure deficit
threshold DP for tracking vortex centers in the
CFSR0.5 dataset shows that the criteria R_DP0 with
DP = 0 hPa, ζ = 5 × 10⁻⁵ s−1, and OCS = 5 m s−1 work
best for the CFSR0.5 dataset (Table 2). Therefore
R_DP0 was selected for all subsequent detection of
TCs in the CFSR0.5 data.
Because the criteria R_0 and R_DP0 result in the
smallest errors in detecting TC counts for the RegCM
downscaling output and CFSR0.5 dataset, these criteria are used next to obtain the total annual TC
counts for the entire period 1995−2010 and the spatial distribution of the TC frequency over the entire
WPAC basin as given in Figs. 4 & 5. Notice in Fig. 4
that both the RegCM downscaling and the CFSR0.5
capture the annual variation of TCs well over
the entire period, including the most active ENSO
phases during 1995−1998, when ENSO transitioned
from the La Niña phase (late months of 1995 to late
Table 2. Sensitivity of the mean bias errors (ME), correlation (R) and root mean square errors (RSME) of the vortex
tracking algorithm for the CFSR0.5 dataset, with criteria
(R_DP0 to R_DP3) defined by different minimum sea level
pressure thresholds (DP, hPa), and vorticity and OCS parameters set as for the R_0 criteria in Table 1
R_DP0
R_DP1
R_DP2
R_DP3
DP (hPa)
ME
R
RMSE
0
–1
–2
–3
–1.25
–2.31
–6.88
–12.94
0.41
0.37
0.47
0.45
6.89
7.12
9.21
14.10
Phan et al.: Seasonal tropical cyclone forecasting
1996) to the strong El Niño phase in 1997. Although
the correlation of the TC counts from RegCM_
CFSR2.5 is not always high, the difference between
the RegCM-detected TC counts and the observed TC
counts is within the 95% confidence interval. Except
for the 2001−2004 period, the overall consistent variation of the TC counts obtained from the RegCM
downscaling indicates that the new vortex tracking
40°N
a
Observation
35°
30°
25°
20°
15°
10°
5°
0°
100°E
40°N
b
110°
120°
130°
140°
150°
160°
170°
180°
120°
130°
140°
150°
160°
170°
180°
130°
140°
150°
160°
170°
180°
CFSR
35°
30°
25°
20°
15°
10°
5°
0°
100°E
40°N
c
110°
121
algorithm operates well at the resolution of 36 km,
and sufficiently well for subsequent application in
the real-time experiment to be presented in Section 4. The TC frequency distribution in Fig. 5 further
demonstrates that RegCM_CFSR2.5 captures the
overall distribution of the TC activity in the WPAC
basin reasonably well. In particular, the elongated
region of high TC frequency in the far-east Philippine Sea is well captured in RegCM_CFSR2.5 (i.e.
values are similar to observed frequencies), whereas
CFSR0.5 captures more TC activity near Philippines
Sea and VES.
To assess the realism of the seasonal TC distribution obtained with our TC tracking algorithm, Fig. 6
compares the seasonal TC distributions for CFSR0.5,
RegCM_CFSR2.5 and observation, averaged over
the 1995−2010 period. It is seen in Fig. 6 that our
tracking algorithm captures well both the number of
TCs and their seasonal variation, with the maximum
value of ~6 storms during the most active months
from mid-August to September as compared to the
average of 7.5 storms observed during this period. In
particular, RegCM_CFSR2.5 closely reproduces the
variation of TC counts from June to July. The bias of
the number of TCs between model and observation is
acceptable, and it is persistent across the months. A
similar tracking algorithm applied directly for the
CFSR0.5 dataset underestimates the total storm
count in almost months of the year, except in the
early season from April to June. Although adjustment of the OCS or the DP criterion could produce
better distribution of the monthly TC counts, the
impacts of the coarse resolution are still fairly signifi-
RegCM
35°
30°
25°
20°
15°
10°
5°
0°
100°E
110°
120°
Fig. 5. Spatial distribution of the TC frequency obtained from
(a) observation, (b) directly from the CFSR0.5 dataset with
the R_DP0 tracking algorithm, and (c) from RegCM_CFSR2.5
outputs using the R_0 tracking algorithm. Numbers in boxes:
no. of counts falling within each box; more intense shading:
higher number of counts. See Table 3 tracking algorithms
and Fig. 3 legend for abbreviations
Fig. 6. Seasonal variation of the averaged TC frequency
during the 1995−2010 period in the North Western Pacific
basin for observed TC count (red), the RegCM_CFSR2.5
simulations (dark gray), and the CFSR0.5 analysis (light
gray). Error bars: 95% confidence intervals for each individual month, which are derived from the 1995−2010 statistics. Further abbreviations as in Fig. 3 legend
122
Clim Res 62: 115–129, 2015
cant, with overall fewer TC counts during this period
regardless of OCS or vorticity criteria used in the
tracking algorithm, thus indicating the critical role of
the grid resolution in capturing TC activity.
Comparison of the geographical distribution of the
TC tracks detected in RegCM_CFSR2.5 dataset to the
observed tracks during the 1995−2010 period (Fig. 7)
reveals further that the RegCM downscaling captures
the pattern and lifetime of TCs during this baseline
period reasonably well. Regardless of the tracking
thresholds, most of the RegCM storms are located in
the northern latitudes (north of 5° N) and west of
150° E with the overall movement in the southeast to
northwest direction at lower latitudes and TCs gradually heading north as they approach the continent.
However, the RegCM storms are relatively short-lived
compared to the observed TCs during the same
period. This is likely because the CFSR2.5 dataset
does not contain sufficient cyclonic motion at the 2.5°
horizontal resolution for the RegCM model to enhance
further, even after adjusting the vortex searching
criteria. Note that there are instances where the
model storm centers are still detected over land; these
remnants of the model storms after making landfall.
While such vortex centers over land could be eliminated entirely by imposing some further check based
on the surface landmask, this would affect some cases
in which a model storm does maintain its strength
over land, even after making landfall, and it is difficult
to remove entirely. Because our main focus of the TC
seasonal forecasting is on the number of TCs formed
over ocean rather than following their entire lifecycle,
any subsequent extension of the track over land will
not generally impact the count of TCs. However, to
ensure that a newly detected storm must form over
ocean, any vortex center that is detected over land at
the first instance is eliminated, because this indicates
that the storm is not a real tropical cyclone.
Given the reasonable performance of the above
tracking criteria in our experiment with the RegCM
downscaling during the 1995−2010
period, we hereinafter use the R_0 criteria listed Table 1 to detect TC centers
in our experimental forecasts of TC frequency in the WPAC basin, using the
RegCM model to downscale the 1 × 1°
CFS real-time forecasts (hereinafter
RegCM_CFS1.0).
4. SEASONAL TC FORECAST FOR
WPAC AND VIETNAM AREAS
4.1. Real-time TC frequency for
WPAC
Fig. 7. (a) Simulated storm tracks detected from the RegCM_CFSR2.5 experiments (see Fig. 3 legend) with the new vortex tracking algorithm, and (b)
observed tracks during the 1995−2010 period. Red star: Hanoi
To evaluate first the performance of
the RegCM_CFS1.0 model in seasonal
TC forecasts for the WPAC basin during
2012−2013 seasons, Fig. 8 compares the
statistics of the monthly TC counts detected from RegCM outputs to the observed TC counts from February to
May in 2012 and 2013. Because the TC
season in VNC typically ranges from
June to November every year, the analysis in this study will consider only the
6 mo forecasts issued during the February to May period for consistency with
the analysis for VNC in the next section.
Since our seasonal forecasts are
cycled every 7 d, four 6 mo forecasts
are initiated in each month. The per-
Phan et al.: Seasonal tropical cyclone forecasting
e
b
f
c
g
d
h
TC count
a
123
Fig. 8. (a–d) Four 6 mo forecast cycles (gray columns) and the monthly mean (black column) of the TC count forecasts from
RegCM_CFS1.0 in (a) February, (b) March, (c) April, and (d) May, and the observed TC frequency (red column) during the same
period in a 2012 real-time experiment. (e–h) As (a–d) but for the 2013 season. Error bars: 95% confidence interval. Abbreviations
as in Fig. 3 legend
124
Clim Res 62: 115–129, 2015
formance of RegCM’s seasonal forecast is quantified
in terms of monthly TC counts, calculated as the
average of the 4 weekly TC count forecasts initiated
in a given month. For example, a forecast of the TC
count for March that is issued in February is the
mean of the 4 TC count forecasts for March from
cycles initiated in February.
As seen in Fig. 8, there is significant variation in the
storm counts from month to month in RegCM’s seasonal forecasts and between the 2012 and 2013
seasons. The variation is relatively small for the
weekly cycles initiated in February and March 2012
and then gradually increases in the later months
toward the summer with maximum variability occurring in May. For example, the 4 cycles started in May
2012 display different numbers of TC counts of up to
6 storms between the cycle initiated at 00:00 UTC h
14 May and that initiated at 00:00 h UTC 28 May
2012. In contrast, forecasts in 2013 exhibit some specific issues with a significant overestimation of the
TC activity in February and March forecast compared with the 95% confidence interval. The larger
variation of TC counts towards summer time appears
to be consistent with less predictable conditions in
the large-scale region environment, as a result of increasingly energetic summer monsoon activities
(Webster et al. 1998, Taraphdar et al. 2010). This is
particularly apparent in WPAC, where > 80% of TCs
are related to the Inter Tropical Convergence Zone
(ITCZ) (Gray 1968). As such, any variation in the
strength or the pattern of the ITCZ could greatly
impact the seasonal predictability of TC activity in
this area.
Despite larger variation from cycle to cycle, it is of
interest that RegCM is able to forecast the general
distribution of the TC counts fairly well, showing an
upward trend of more TCs towards the summer
months as in the observation data. Fig. 9 shows
RegCM_CFS1.0’s 6 mo forecasts of the total number
of TCs issued every month from February to May
compared to the observation data for the forecast
period (i.e. February forecasts are compared with
observation data for March to August). As seen in
this bulk statistics, RegCM_CFS1.0 predicts an increasing tendency of TC activity from February to
April for both seasons of 2012 and 2013. Although the
predicted peaks of the TC counts, in both 2012 and
2013, are somewhat larger than observed (cf. Fig. 8),
the consistent trend of the total TC counts within the
6 mo window indicates that the model is capable of
developing some basic features of TC distribution.
While the good performance of RegCM_CFS1.0 in
seasonal forecasts of TC counts could be attributed to
Fig. 9. Comparison the total number of TCs obtained from 4
real-time 6 mo forecast cycles (gray columns) and the monthly
mean forecast (black) from the RegCM_CFS1.0 issued from
February to May in 2012 and 2013 with the total number of
TCs observed (red) in the respective 6 mo forecast periods.
W1−4: forecast cycles initialized at the first, second, third, and
fourth week of each month, respectively. Error bars: 95% confidence interval derived from the monthly averaged forecasts.
Abbreviations as in Fig. 3 legend and Table 2
its higher resolution, this result could also be influenced by lateral boundary conditions provided by
the CFS products. Thus, a good seasonal forecast
cannot be entirely attributed to the RegCM model
but is to some degree a result of good CFS forecasts.
In order to examine the capability of the CFS model
in real-time forecasts of TC frequency relative to the
RegCM model, Fig. 10 shows the total number of TCs
forecasted within the 6 mo interval obtained directly
from the CFS1.0 during the 2012 and 2013 seasons.
Similar to the forecasts of TC counts in RegCM_
CFS1.0, the TC count obtained from the CFS1.0 forecasts for any month is an average of the four 6 mo
forecasts issued in that month.
Of interest in CFS1.0’s 6 mo forecasts of the total
number of TCs (Fig. 10) is that CFS1.0 substantially
underestimates TC activity throughout the 2012−
2013 seasons, with a maximum TC count of only 3
storms over the entire WPAC basin for forecasts
issued in February 2012 as compared to 15 storms
observed from March to August 2012. Forecasts in
March 2012 do not even capture a single TC during
the entire 6 mo lead time. Similar results are seen for
2013 (Fig. 10a). In contrast, RegCM_CFS1.0 shows
more realistic number of TCs with the total number
of TCs in any month very close to the observed numbers (cf. Figs. 8 & 9). This comparison is of course not
really ‘fair’ because detecting TC centers directly
from the CFS forecasts at a resolution of 1 × 1° degree
may be sensitive to criteria in the tracking algorithm
as discussed in Section 3 (cf. Fig. 3). To address this
issue, an additional sensitivity experiment is con-
Phan et al.: Seasonal tropical cyclone forecasting
Fig. 10. (a) As Fig. 9, but showing results for the Climate
Forecasting System forecasts. (b) As (a), but with a lower
vorticity criterion in the vortex tracking algorithm (see text
for details)
ducted in which both the vorticity maximum and the
OCS value are re-tuned to search for the best number of TCs from the CFS forecasts. The aim of this
tuning is to match the criteria to the lower resolution
of the CFS products compared to the RegCM model
outputs. As seen in Fig. 10b, retuning the searching
vortex criteria could help detect 80 to 90% more TCs
in the CFS forecasts during both the 2012 and 2013
seasons. However, the total TC counts are in general
still much lower compared to observation or the
RegCM_CFS1.0 forecasts. In this regard, the better
performance of the RegCM model in seasonal TC
forecasts suggests that higher-resolution regional
models are still important in enhancing the TC representation and development, which the coarse resolution global forecasts could not attain. In addition
to enhancing the capability of the CFS forecast,
regional downscaling is useful as it allows examination of different climate change scenarios driven by
the global changes, not only in terms of TC count but
also changes in the track patterns and genesis frequency that are not fully captured by global models.
Two experiments were designed to further examine the skill of the RegCM model in the tercile sea-
125
sonal forecasting of the TC frequency with respect to
the observed climatology (EXP_1) and model climatology (EXP_2). For these experiments, the observed
TC and model TC climatology are obtained from the
number of TCs observed during the 1981−2010
period and from the model simulations (RegCM_
CFSR2.5) during the 1995−2010 period, based on values for the 33rd (observed: q33o; model: q33m) and
66th (q66o; q66m) percentiles (see Phan et al. 2014).
For specific evaluation of the tercile forecasts of the
TC activity, the number of TCs obtained from
RegCM_CFS1.0 (NTCs) during the 2012−2013 seasons is compared against the observed climatology
(i.e. q33o and q66o; EXP_1), and against the model
climatology (i.e. q33m and q66m; EXP_2) to classify
forecasts in below normal (B), normal (N), or above
normal (A) categories, where B is defined as NTCs
< q33o (q33m), N–NTCs are in between q33o (q33m)
and q66o (q66m), and A–NTCs > q66o (q66m)
(Table 3); the corresponding statistical scores are
provided in the Table 4.
As seen in Fig. 11, while the 2012 season shows
normal activity, with all 6 mo forecasts falling within
the q33m−q66m range in EXP_2 and 3 of 4 falling
within the q33o−q66o range in EXP_1, the 2013 season exhibits predominantly above-normal activity,
especially toward March to May months, which
explains the fact that above-normal forecasts (A)
have the overall highest bias scores in Table 4. As a
result, the absolute error in the TC count forecasts in
2013 is substantially higher than in 2012, as seen in
Fig. 11. Values of the bias and probability of detection score for category B and N forecasts are rather
Table 3. RegCM real-time tercile forecasts of the total number of TCs during the 2012−2013 seasons for categories of
below normal (B), normal (N), and above normal (A). These
categories are defined with respect to the 33 and 66% percentiles obtained from the observed climatology (EXP_1)
and model climatology (EXP_2) of TC activity during the
baseline periods 1981−2010 and 1995−2010, respectively
Experiment
OBS
B
N
A
SUM
Forecast
EXP_1
B
N
A
SUM
1
1
2
4
0
5
11
16
0
1
11
12
1
7
24
32
EXP_2
B
N
A
SUM
1
1
2
4
0
5
11
16
0
0
12
12
1
6
25
32
126
Clim Res 62: 115–129, 2015
small while they are quite
large for category A forecasts
(Table 4), reflecting missed
forecasts in the ‘B’ and ‘N’
phases, and false alarms in the
‘A’ phase of the model. Despite
the overestimation of the TC
Score Bias_B Bias_N Bias_A POD_B POD_N POD_A PC
HSS
PSS
count in 2013, direct calculation
EXP
of the Heidke Skill Score (HSS)
or Peirce Skill Score (PSS) for
EXP_1
0.25
0.44
2.00
0.25
0.31
0.92
0.53 0.226 0.230
EXP_2
0.25
0.38
2.08
0.25
0.31
1.00
0.56 0.282 0.289
these 3-category phase forecasts appears to confirm some
skill of RegCM with respect to
the equitable forecasts during both seasons, with
HSS values of 0.226 and 0.282, and PSS values of
0.230 and 0.289 for the EXP_1 and EXP_2, respectively (see Tables 3 & 4). Such positive scores are
attributed mostly to the ability of the RegCM model
in detecting correctly the above-normal TC counts in
all forecast cycles from March-June 2013. Furthermore, the fact that values of the HSS and PSS in
EXP_2 are somewhat larger in EXP_1 suggests that
for the tercile forecast, the model climatology should
be used instead of the observed one.
It is encouraging to see that RegCM also captures
well both the tendency of above-normal activity in
2013 and the normal activity in 2012. If the phase of
Fig. 11. 6 mo forecasts of the total number of TCs obtained
the anomaly forecast is used to quantify the perfrom RegCM (green symbols for the weekly forecasts [W1−4],
formance of the tercile forecast, it is seen from
blue circles for the ensemble means), and CFS forecasts
Fig. 11 (and also from Table 3) that RegCM has 17
(black circles), issued from February to May 2012 and 2013,
and the observation data (red circles) for the corresponding
correct phase forecasts out of 32 in EXP_1 and 18
6 mo forecast periods. Red lines show the 33% (dashed) and
out of 32 in EXP_2, corresponding to proportion cor66% (solid) percentiles obtained from the observed climatolrect (PC) scores of 0.53 and 0.56 respectively. In
ogy of TC activity during the 1981−2010 baseline period.
contrast, CFS provides well below normal activity in
Blue lines show the corresponding 33% (dashed) and 66%
all forecasts, with all of the tercile forecasts below
(solid) percentiles obtained from the model climatology conducted based on the RegCM simulation during the 1995−
the normal climatology (Fig. 11). Such consistent
2010 baseline period
phase forecast in RegCM again suggests that
RegCM is capable of correctly reproducing the TC
anomaly tendency that the global CFS forecasts
cannot achieve.
Table 4. Verification scores of model forecasts of TC activity with respect to observed
climatology (EXP_1) and model climatology (EXP_2) based on data in Table 3, showing bias scores, with bias categorized as below normal (B), normal (N), and above normal (A), and probability of detection (POD) for each category. Values for proportion
correct (PC), Heidke Skill Score (HSS), and Peirce Skill Score (PSS) are for all model
forecasts
4.2. Seasonal forecasts for Vietnam’s coastal
region
Fig. 12. As Fig. 9 but for Vietnam’s coastal region within a
domain of (100−120° E) × (5−25° N)
To focus further on the seasonal TC forecasts for
the VNC area, this subsection examines forecasts of
TCs whose gale force winds and associated circulation potential threaten Vietnam’s coastline. Fig. 12
plots the number of TCs detected in the VNC region
(rather than for the entire WPAC basin) during periods covered by forecasts issued from February to
May in 2012 and 2013. To be specific, any TC whose
Phan et al.: Seasonal tropical cyclone forecasting
center is within a domain of (5 to 25° N) × (100 to
120° E) during any stage of its lifetime is considered
to have potential influence on Vietnam’s coastline.
This definition thus includes storms that may form in
the far ocean but later enter the selected domain. The
number of TCs in this sub-region is overall too small
to give a statistically significant result, but sufficient
to see if the trend of the TC distribution is reflected in
RegCM_CFS1.0’s forecasts for this area.
As seen in Fig. 12, RegCM_CFS1.0, the 6 mo
forecasts issued from February to May greatly
overestimate the total number of TCs in the VNC
area for both the 2012 and 2013 seasons compared
with the 95% confidence intervals. Unlike the
forecast for the whole WPAC region, the TC activity in VNC fluctuates markedly from cycle to cycle
due to the small number of the TCs in this area,
with an average of 10 to 12 TCs for most of the
6 mo forecasts. In contrast, observation consistently
shows a smaller number of TCs (~7 to 9). Although
the number of the observed TCs over the entire
WPAC basin is larger than that obtained from
RegCM_CFS1.0’s forecasts (Fig. 9), many observed
TCs did not enter the VES but instead shifted in a
north-northwesterly direction, similarly to in the
baseline period (cf. Fig. 7). As a result, the observed number of TCs that actually entered the
VES and subsequently impacted Vietnam’s coastline is considerably smaller than the total observed
count during the entire period. That the TC counts
obtained from the RegCM_CFS1.0 are similar to
the observed counts in the WPAC basin but much
greater than observed counts in the VNC area
suggests that RegCM_CFS1.0 has some potential
issues with the large-scale flows that, in the model,
somehow expand too far to the west and veer towards the VES instead of turning to the north as
observed.
5. CONCLUSIONS
We have presented experimental seasonal forecasts of tropical cyclone (TC) activity for Vietnam’s
coastal region during the 2012−2013 typhoon seasons, using the RegCM4.2 to downscale the global CFS forecasts (RegCM_CFS1.0). By optimizing
Walsh’s (1997) vortex tracking algorithm, by giving
more weight to the magnitude of the outer core wind
and imposing some empirical thresholds on the vorticity criterion, we developed a modified tracking
algorithm capable of detecting model vortex centers
very well in the CFSR dataset for a baseline period
127
from 1995−2010. Model simulations obtained are
consistent with observation with reference to the
total TC counts, the monthly variations in TC frequency, and the TC track pattern.
Application of the new tracking algorithm to the
real-time 6 mo forecasts of TC frequency during
the 2012−2013 seasons with the RegCM_CFS1.0
showed that RegCM can predict TCs fairly well in
the Northwestern Pacific (WPAC) basin in terms of
both the magnitude and the distribution of TC frequency as compared to the observed TC distribution. Except for the February and March forecasts in
2013, RegCM_CFS1.0 consistently captured the
total number of TCs during the experimental period
with ~15 to 20% more TCs towards summer time
(April to May) compared to forecasts issued in the
February−March period. Although part of RegCM’s
good performance in forecasting the TC frequency
is inherited from the good quality of the CFS forecast, examination of the total TC counts directly
obtained from the CFS forecasts revealed that the
CFS forecasts do not capture TC frequency during
the 2012−2013 seasons. Experiments with different
tracking thresholds showed that underestimation of
the TC count in the CFS forecast is an inherent feature of this global product, and is a consequence of
the low resolution and possibly simplified physics of
the CFS model. Thus, the ability of the RegCM
model in both enhancing TC representation and
reflecting observed distribution of the TC counts
demonstrates the importance of the regional models
in seasonal forecasting of TC activity. Further analysis of the total TC counts for the VNC area showed,
however, that RegCM tends to overestimate the TC
frequency in this sub-region, despite giving good
forecasts for the whole WPAC basin. While the
results obtained in this real-time experiment are not
conclusive due to limited sample size, our plan is to
continue the real-time experiments in order to generate more robust statistics. The possibility of
increasing the horizontal resolution of the regional
climate model system to allow for more detailed
analysis will be explored and presented in an
upcoming study.
Acknowledgments. This research was supported by the
Vietnam Ministry of Science and Technology Foundation
under the Project No: DT.NCCB-DHUD.2011-G/09. This
work was also encouraged and partially supported by the
11-P04-VIE Danida Project. We express our sincere thanks
to 3 anonymous reviewers, the Editor, and Prof. Roger K.
Smith, whose comments and suggestion have helped to
substantially improve this manuscript.
Clim Res 62: 115–129, 2015
128
LITERATURE CITED
Becker EJ, Van Den Dool H, Peña M (2013) Short-term climate extremes: prediction skill and predictability. J Clim
26:512−531
Bengtsson L, Botzet M, Esch M (1995) Hurricane type vortices in a general circulation model. Tellus Ser A Dyn
Meterol Oceanogr 47:175−196
Bengtsson L, Hodges KI, Esch M (2007) Tropical cyclones in
a T159 resolution global climate model: comparison with
observations and re-analyses. Tellus 59A:396–416
Camargo SJ, Barnston AG (2009) Experimental seasonal
dynamical forecasts of tropical cyclone activity at IRI.
Weather Forecasting 24:472–491
Camargo SJ, Zebiak SE (2002) Improving the detection and
tracking of tropical storms in atmospheric general circulation models. Weather Forecast 17:1152–1162
Chan JCL (2008) A simple seasonal forecast update of tropical cyclone activity. Weather Forecast 23:1016−1021
Chan JCL, Shi JE, Lam CM (1998) Seasonal forecasting of
tropical cyclone activity over the western North Pacific
and the South China Sea. Weather Forecast 13:997−1004
Chan JCL, Shi JE, Liu KS (2001) Improvements in the seasonal forecasting of tropical cyclone activity over the
western North Pacific. Weather Forecast 16:491−498
Dickinson RE, Errico RM, Giorgi F, Bates GT (1989) A
regional climate model for the western United States.
Clim Change 15:383−422
Elguindi N, Bi X, Giorgi F, Nagarajan B, Pal J, Solmon F,
Zakey A (2004) RegCM version 3.0 user’s guide. The
Abdus Salam International Centre for Theoretical Physics
(ICTP), Trieste
Elguindi N, Bi X, Giorgi F, Nagarajan B, Pal J, Solmon F,
Giuliani G (2011) Regional climatic model RegCM user
manual version 4.1. ICTP, Trieste
Gillies RR, Wang SY, Yoon JH, Weaver S (2010) CFS prediction of winter persistent inversions in the intermountain
region. Weather Forecast 25:1211−1218
Giorgi F, Anyah RO (2012) The road towards RegCM4. Clim
Res 52:3−6
Giorgi F, Bates GT (1989) The climatological skill of a
regional model over complex terrain. Mon Weather Rev
117:2325−2347
Giorgi F, Marinucci MR, Bates GT (1993a) Development of a
second-generation regional climate model (RegCM2). I.
Boundary-layer and radiative transfer processes. Mon
Weather Rev 121:2794−2813
Giorgi F, Marinucci MR, Bates GT, De Canio G (1993b)
Development of a second-generation regional climate
model (RegCM2). II. Convective processes and assimilation of lateral boundary conditions. Mon Weather Rev
121:2814−2832
Giorgi F, Coppola E, Solmon F, Mariotti L and others (2012)
RegCM4: model description and preliminary tests over
multiple CORDEX domains. Clim Res 52:7–29
Gray WM (1968) Global view of the origin of tropical disturbances and storms. Mon Weather Rev 96:669–700
Grell GA, Dudhia J, Stauffer D R (1994) A description of
the fifth-generation Penn State/NCAR mesoscale model
(MM5). Technical Note NCAR/TN-398+ STR, National
Center for Atmospheric Research (NCAR), Boulder,
CO
Kim JH, Ho CH, Kim HS, Choi W (2012) 2010 Western North
Pacific typhoon season: seasonal overview and forecast
using a track-pattern-based model. Weather Forecast 27:
730−743
Kirtman BP, Min D (2009) Multimodel ensemble ENSO prediction with CCSM and CFS. Mon Weather Rev 137:
2908−2930
Klotzbach PJ (2007) Revised prediction of seasonal Atlantic
basin tropical cyclone activity from 1 August. Weather
Forecast 22:937−949
Klotzbach PJ, Gray WM (2009) Twenty-five years of Atlantic
basin seasonal hurricane forecasts (1984−2008). Geophys Res Lett 36:L09711, doi:10.1029/2009GL037580
Knapp KR, Kruk MC (2010) Quantifying interagency differences in tropical cyclone best-track wind speed estimates. Mon Weather Rev 138:1459−1473
Lu MM, Chu PS, Lin YC (2010) Seasonal prediction of tropical
cyclone activity near Taiwan using the Bayesian multivariate regression method. Weather Forecast 25:1780−1795
Lu MM, Lee CT, Wang B (2013) Seasonal prediction of accumulated tropical cyclone kinetic energy around Taiwan
and the sources of the predictability. Int J Climatol 33:
2846−2854
Nguyen KC, Walsh KJE (2001) Interannual, decadal, and
transient greenhouse simulation of tropical cyclone-like
vortices in a regional climate model of the South Pacific.
J Clim 14:3043−3054
Pal JS, Giorgi F, Bi X, Elguindi N and others (2007) Regional
climate modeling for the developing world: the ICTP
RegCM3 and RegCNET. Bull Am Meteorol Soc 88:
1395−1409
Phan VT, Ngo-Duc T, Ho TMH (2009) Seasonal and interannual variations of surface climate elements over Vietnam. Clim Res 40:49−60
Phan VT, Nguyen VH, Trinh TL, Nguyen QT, Ngo-Duc T,
Laux P, Nguyen XT (2014) Seasonal prediction of surface
air temperature across Vietnam using the Regional Climate Model version 4.2 (RegCM4.2). Adv Meteorol 2014:
245104, doi:10.1155/2014/245104
Saha S, Moorthi S, Pan HL, Wu X, Wang J, Nadiga S,
Reynolds RW (2010) The NCEP climate forecast system
reanalysis. Bull Am Meteorol Soc 91:1015−1057
Solmon F, Mallet M, Elguindi N, Giorgi F, Zakey AS, Konare
A (2008) Dust aerosol impact on regional precipitation
over western Africa, mechanisms and sensitivity to absorption properties. Geophys Res Lett 35:L24705, doi:
10.1029/2008GL035900
Sooraj KP, Annamalai H, Kumar A, Wang H (2012) A comprehensive assessment of CFS seasonal forecasts over
the tropics. Weather Forecast 27:3−27
Strachan J, Vidale PL, Hodges K, Roberts M, Demory ME
(2013) Investigating global tropical cyclone activity with
a hierarchy of AGCMs: the role of model resolution.
J Clim 26:133−152
Taraphdar S, Mukhopadhyay P, Goswami BN (2010) Predictability of Indian summer monsoon weather during
active and break phases using a high resolution regional
model. Geophys Res Lett 37:L21812, doi:10.1029/2010
GL044969
Vecchi GA, Delworth T, Gudgel R, Kapnick S and others
(2014) On the seasonal forecasting of regional tropical
cyclone activity. J Clim 27:7994−8016
Vecchi GA, Zhao M, Wang H, Villarini G and others (2011)
Statistical-dynamical predictions of seasonal North Atlantic hurricane activity. Mon Weather Rev 139:1070−1082
Vitart F, Leroy A, Wheeler MC (2010) A comparison of
Phan et al.: Seasonal tropical cyclone forecasting
129
dynamical and statistical predictions of weekly tropical
cyclone activity in the Southern Hemisphere. Mon
Weather Rev 138:3671−3682
Walsh K (1997) Objective detection of tropical cyclones in
high-resolution analyses. Mon Weather Rev 125:
1767−1779
Walsh KJ, Ryan BF (2000) Tropical cyclone intensity increase near Australia as a result of climate change.
J Clim 13:3029−3036
Walsh K, Watterson IG (1997) Tropical cyclone-like vortices
in a limited area model: comparison with observed climatology. J Clim 10:2240−2259
Wang W, Chen M, Kumar A (2010) An assessment of the
CFS real-time seasonal forecasts. Weather Forecast 25:
950−969
Weatherford CL, Gray WM (1988) Typhoon structure as
revealed by aircraft reconnaissance. I. Data analysis and
climatology. Mon Weather Rev 116:1032−1043
Webster PJ, Magana VO, Palmer TN, Shukla J, Tomas RA,
Yanai MU, Yasunari T (1998) Monsoons: processes, predictability, and the prospects for prediction. J Geophys
Res 103:14451−14510.
Wu R, Kirtman BP, van den Dool H (2009) An analysis of
ENSO prediction skill in the CFS retrospective forecasts.
J Clim 22:1801−1818
Yeung AY, Chan JC (2012) Potential use of a regional climate model in seasonal tropical cyclone activity predictions in the western North Pacific. Clim Dyn 39:783−794
Editorial responsibility: Filippo Giorgi,
Trieste, Italy
Submitted: October 17, 2013; Accepted: October 10, 2014
Proofs received from author(s): December 26, 2014