DSpace at VNU: A new effective learning rule of Fuzzy ART
Bạn đang xem bản rút gọn của tài liệu. Xem và tải ngay bản đầy đủ của tài liệu tại đây (238.22 KB, 8 trang )
2012 Conference on Technologies and Applications of Artificial Intelligence
A new effective learning rule of Fuzzy ART
Nong Thi Hoa, The Duy Bui
Human Machine Interaction Laboratory
University of Engineering and Technology
Vietnam National University, Hanoi
such as document clustering [7] [8], classification of multivariate chemical data [9], Analysing gene expression [10].
Therefore, developing a new effective Fuzzy ART is essential
for clustering applications.
In this paper, we propose a new effective learning rule of
Fuzzy ART that learns many types of datasets as well as
clusters data better than previous models. Our learning rule
updates weights of categories based on the ratio of the input
to the weight of chosen category and a learning rate. The
learning rate presents the speed of increasing/decreasing the
weight of chosen category. It is changed by the following
rule: the number of inputs is larger, value is smaller. We
have conducted experiments with ten typical datasets to prove
the effectiveness of our novel model. Results of experiments
show our novel model clusters better than exiting model,
including Original Fuzzy ART, Complement Fuzzy ART, Kmean algorithm, Euclidean ART.
The rest of the paper is organized as follows. The next
section shows some background. Related works are presented
in Section II. In section VI, we present our learning rule and
discussions. Section VII shows experiments with ten datasets.
Abstract—Unsupervised neural networks are known for their
ability to cluster inputs into categories based on the similarity
among inputs. Fuzzy Adaptive Resonance Theory (Fuzzy ART)
is a kind of unsupervised neural networks that learns training
data until satisfying a given need. In the learning process, weights
of categories are changed to adapt to noisy inputs. In other
words, learning process decides the quality of clustering. Thus,
updating weights of categories is an important step of learning
process. We propose a new effective learning rule for Fuzzy
ART to improve clustering. Our learning rule modifies weights
of categories based on the ratio of the input to the weight of
chosen category and a learning rate. The learning rate presents
the speed of increasing/decreasing the weight of chosen category.
It is changed by the following rule: the number of inputs is larger,
value is smaller. We have conducted experiments on ten typical
datasets to prove the effectiveness of our novel model. Result
from experiments shows that our novel model clusters better
than existing models, including Original Fuzzy ART, Complement
Fuzzy ART, K-mean algorithm, Euclidean ART.
Index Terms—Fuzzy Adaptive Resonance Theory; Clustering;
Learning rule;
I. I NTRODUCTION
Clustering is an important tool in data mining and knowledge discovery because clustering discovers hidden similarity
and key concepts base on the ability of grouping similar items
together. Moreover, clustering summarizes a large amount of
data into a small number of groups. Therefore, it is useful for
comprehending a large amount of data. Fuzzy ART is a artificial neural networks that clusters data into categories by using
AND operators of fuzzy logic. The most important advantage
of Fuzzy ART is learning training data until reaching to given
conditions. Meaning, weights of categories are updated until
they completely adapt to training data. As a result, the learning
process decides the quality of clustering. Thus, designing a
learning rule that allows Fuzzy ART to learn various types of
datasets as well as to cluster data better is always on demand.
Studies about learning process of Fuzzy ART models usually focus on designing new effective learning rules. Capenter’s model maximized code generalization by training system
several times with different orderings of input set [1]. Simpson
incorporated new data and new clusters without retraining
[2]. Tan showed Adaptive Resonance Associative Map with
the ability of hetero-associative learning [3]. Lin addressed
the on-line learning algorithms for realizing a controller [4].
Isawa proposed an additional step, Group Learning, to present
connections between similar categories [5]. Yousuf proposed
an algorithm that allows updating multiple matching clusters
[6]. Moreover, Fuzzy ART has applied for many applications
978-0-7695-4919-4/12 $26.00 © 2012 IEEE
DOI 10.1109/TAAI.2012.60
II. R ELATED
WORKS
Studies about theory of Fuzzy ART can be divided into three
categories, including developing new models of Fuzzy ART;
studying properties of Fuzzy ART; optimizing the performance
of Fuzzy ART. In the first category, new models of Fuzzy
ART were proposed to improve clustering/classifying data into
categories.
Capenter proposed Fuzzy ARTMAP for incremental supervised learning of recognition categories and multidimensional
maps from arbitrary sequences of inputs [1]. This model
minimized predictive error and maximized code generalization
by training system several times with different orderings of
input set.
Simpson presented a fuzzy min-max clustering neural network with unsupervised learning [2]. Pattern clusters were
fuzzy sets associating a membership function. Simpson’s
model have three advantages including stabilizing into pattern
clusters in only a few passes; reducing to hard cluster boundaries; incorporating new data and add new clusters without
retraining.
Tan showed a neural architecture termed Adaptive Resonance Associative Map that extends unsupervised ART systems for rapid, yet stable, hetero-associative learning [3].
216
224
Pattern pairs were coded explicitly and recalled perfectly.
Moreover, this model produces the stronger noise immunity.
Lin addressed the structure and the associated on-line
learning algorithms of a feed forward network for realizing
the basic elements and functions of a traditional fuzzy logic
controller [4]. The input and output spaces were parted on-line
based on the training data by tuning membership functions and
finding proper fuzzy logic rules.
Isawa proposed an additional step, called Group Learning,
for the Fuzzy ART in order to obtain more effective categorization [5]. The important feature of the group learning was
creating connections between similar categories.
Kenaya employed the Euclidean neighbourhood to decide
the said pertinence and patterns mean value for category
training [11]. This model calculated the Euclidean distance
and decides a new pattern in an existing category or a new
category.
Isawa proposed Fuzzy ART combining overlapped categories in connections to void the category proliferation problem [12]. The important feature of this study was arranging
the vigilance parameters for every category and varying them
in learning process.
Yousuf proposed an algorithm that compares all weights to
the input and allows updating multiple matching clusters [6].
This model mitigated the effects and supervision of updating
clusters for the wrong class.
In the second category, important properties of Fuzzy ART
were studied to choosing suitable parameters for a new Fuzzy
ART. Huang presented some important properties of the Fuzzy
ART that distinguished into a number of categories[13]. Properties includes template, access, reset, and other properties for
weight stabilization . Moreover, the effects of choice parameter
and vigilance parameter on the functionality of Fuzzy ART
were presented clearly.
Geogiopoulos provided a geometrical and clearer understanding of why, and in what order, categories are chosen
for various ranges of choice parameter of Fuzzy ART [14].
This study was useful to develop properties of learning that
pertain to the architecture of neural networks. Moreover, he
commented the orders according to which categories were
chosen.
Anagnostopoulos introduced novel geometric concepts,
namely category regions, in the original framework of Fuzzy
ART and Fuzzy ARTMAP. These regions had the same
geometrical shape and shared a lot of common and interesting
properties [15]. He proved properties of learning and showed
the training and performance phases did not depend on the
particular choices of the vigilance parameter in one special
state of the vigilance-choice parameter space.
In the third category, studies focused on ways to increase
the performance of FART. Cano generated function identifiers
for noisy data [16]. Thus, FARTs trained on noisy data without
changing the structure or data preprocessing.
Burwick discussed implementations of ART on a nonrecursive algorithm to decrease algorithmic complexity of
Fuzzy ART [17]. Therefore, the complexity dropped from
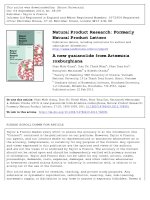
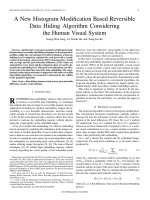
Figure 1.
Architecture of an ART network
O(N*N)+O(M*N) down to O(NM) where N be the number
of categories and M be the input dimension.
Dagher introduced an ordering algorithm that identified
a fixed order of training pattern presentation based on the
maxmin clustering method to improve generalization performance of FART [18].
Kobayashi proposed a new reinforcement learning system
that used fuzzy ART to classify observed information and
construct effective state space [19]. Then, this system was
used to solving partially observable Markov decision process
problems.
Fuzzy ART has applied for many applications such as document clustering [7] [8], classification of multivariate chemical
data [9], Analysing gene expression [10], quality control of
manufacturing process [20], classification with missing data
in a wireless sensor network [21].
III. BACK GROUND [22]
A. ART Network
Adaptive Resonance Theory (ART) neural networks are
developed by Grossberg to address the problem of stabilityplasticity dilemma. The general structure of an ART network
is shown in the Figure 1.
A typical ART network consists of two layers: an input
layer (F1) and an output layer (F2). The input layer contains N
nodes, where N is the number of input patterns. The number
of nodes in the output layer is decided dynamically. Every
node in the output layer has a corresponding prototype vector.
The networks dynamics are governed by two sub-systems: an
attention subsystem and an orienting subsystem. The attention
subsystem proposes a winning neuron (or category) and the
orienting subsystem decides whether to accept it or not. This
network is in a resonant state when the orienting system
accepts a winning category, meaning, the winning prototype
vector matches the current input pattern close enough.
B. Fuzzy ART Algorithm [22]
Input vector: Each input I is an M-dimensional vector
(I1 , .....IM ), where each component li is in the interval [0,
1].
Weight vector: Each category (j) corresponds to a vector
wj = (Wj1 , ..., wjM ) of adaptive weights, or LTM traces.
The number of potential categories N(j = i,..., N) is arbitrary.
Initially
225
217
Wj1 = ... = wjM = 1
Fast-commit slow-recode option: For efficient coding of
noisy input sets, it is useful to set β = 1 when J is an
uncommitted node, and then to take β < 1 after the category is
(new)
committed. Then wj
= I the first time category J becomes
active.
(1)
and each category is said to be uncommitted. Alternatively,
initial weights wji may be taken greater than 1. Larger weights
bias the system against selection of uncommitted nodes, leading to deeper searches of previously coded categories. After
a category is selected for coding it becomes committed. As
shown below, each LTM trace wji is monotone non-increasing
through time and hence converges to a limit.
Parameters: Fuzzy ART dynamics are determined by a
choice parameter α 0; a learning rate parameter β ∈ [0, 1];
and a vigilance parameter θ ∈ [0, 1].
Category choice: For each input I and category j, the choice
function Tj is defined by
Tj (I) =
|I ∧ wj |
α + |wj |
C. Fuzzy ART with complement coding [22]
Moore [23] described a category proliferation problem that
can occur in some analog ART systems when a large number
of inputs erode the norm of weight vectors. Proliferation of
categories is avoided in Fuzzy ART if inputs are normalized;
that is, for some γ > 0
|I| = γ
for all inputs I. Normalization can be achieved by preprocessing each incoming vector a. A normalization rule, called
complement coding, achieves normalization while preserving
amplitude information. Complement coding represents both
the on-response and the off-response to a. To define this
operation in its simplest form, let a itself represent the onresponse. The complement of a, denoted by ac , represents the
off-response, where
(2)
where the fuzzy AND (Zadeh, 1965) operator ∧ is defined
by
(x ∧ y)i = min(xi , yi )
(3)
and where the norm |.| is defined by
aci = 1 − ai
M
|x| =
|xi |
(4)
For notational simplicity, Tj (I) in Equation 2 is often
written as Tj when the input I is fixed. The category choice
is indexed by J, where
I = (ai , aci ) = (a1 , ..., aM , ac1 , ..., aM
i )
Wj1 = ... = wj2M = 1
IV. K- MEANS C LUSTERING [24]
(6)
k
(7)
N
J=
(j)
xi − C j
2
(13)
j=1 i=1
Then the value of the choice function Tj is reset to −1 for
the duration of the input presentation to prevent its persistent
selection during search. A new index J is chosen, by Equation
5 . The search process continues until the chosen J satisfies
Equation 6.
Learning: The weight vector wj is updated according to
the equation
wjnew = β(I ∧ wjold ) + (1 − β)wjold
(12)
K-means is one of the simplest unsupervised learning algorithms that solve the clustering problem. The procedure
follows a simple and easy way to classify a given data set
through a certain number of clusters (assume k clusters). This
algorithm aims at minimizing a squared error function by the
following equation:
Learning then ensues, as defined below. Mismatch reset
occurs if
|I ∧ wj |
≤ρ
|I|
(11)
After normalization, |I| = M so inputs preprocessed into
complement coding form are automatically normalized. Where
complement coding is used, the initial condition 1 is replaced
by
(5)
If more than one Tj is maximal, the category j with
the smallest index is chosen. In particular, nodes become
committed in order j = 1, 2, 3, . . . .
Resonance or reset: Resonance occurs if the match function of the chosen category meets the vigilance criterion; that
is, if
|I ∧ wj |
≥ρ
|I|
(10)
The complement coded input I to the recognition system is
the 2M-dimensional vector
i=1
Tj = max{Tj : j = 1...N }
(9)
where N be the number of points that is in cluster j.
(j)
In the other words, xi − Cj 2 is a chosen distance
(j)
measure between a data point xi and the cluster centre Cj ,
is an indicator of the distance of the n data points from their
respective cluster centres.
The algorithm is composed of the following steps:
• Step 1: Place k points into the space represented by the
objects that are being clustered. These points represent
initial group centroids.
(8)
226
218
Step 2: Assign each object to the group that has the
closest centroid.
• Step 3: When all objects have been assigned, recalculate
the positions of the k centroids.
• Step 4: Repeat Steps 2 and 3 until the centroids no
longer move. This produces a separation of the objects
into groups from which the metric to be minimized can
be calculated.
Although the procedure will always terminate, the K-means
algorithm does not necessarily find the most optimal configuration, corresponding to the global objective function minimum.
•
categories. Our novel model with the new effective learning
rule greatly clusters better than exiting studies.
Our novel model consists of following steps:
• Step 1: Set up connection weights Wj , the choice parameter α and the vigilance parameter ρ.
• Step 2: Choose a suitable category for the input according
to Equation 2-5 .
• Step 3: Test the current state that can be resonance or
reset by Equation 6 and 7 .
• Step 4: Learning is performed by our learning rule:
wjnew = wjold + β(I − wjold )
V. E UCLIDEAN ART A LGORITHM [11]
The Euclidean ART is a clustering technique that evaluates the Euclidean distance between patterns and cluster
centrers to decide clustering membership of patterns. The
pattern membership is dependent on the parameter Rth ,the
Euclidean threshold. The Euclidean ART algorithm consist of
the following steps:
• Step 1: Present a normalized and complement coded
pattern to Euclidean ART module.
• Step 2: Calculate the Euclidean distance between this
pattern and the entire existing cluster centers by Equation 14. Those Euclidean distances are considered as an
activation value of each cluster center with respect to
the presented pattern. If there is no cluster center yet,
consider this pattern to be the first one.
•
(xi − wj )2
(14)
j=1
•
•
where j is the category index found in Euclidean ART
network and i is the index of the current presented pattern.
Step 3: Find d(J), where d(J) = min(d).
Step 4: If d(J) ≤ Rth then
– Include the presented pattern xk in the winning
cluster whose center is wJ .
– Start the learning process; calculate the new cluster
center according to learning equation 15
•
L
k=1
VII. E XPERIMENTS
We select 10 datasets from UCI database [25] and
Shape database [26], including Iris, Wine, Jain, Flame, R15,
Glass, Pathbased, Compound, Aggregation, and Spiral. These
datasets are different from each other by the number of
attributes, the number of categories, the number of patterns,
and distribution of categories. Table I shows parameters of
selected databases.
Our novel models are compare to Fuzzy ARTs [22], Kmean
[24], and Euclidean ART [11]. Six models are coded to
assess the effective of our novel models, including Original Fuzzy ART (OriFART), Complement Fuzzy ART (ComFART), Original New Fuzzy ART (OriNewFART), Complement New Fuzzy ART (ComNewFART), K-mean (Kmean),
and Euclidean ART (EucART).
xJk
(15)
L
where xJk is the pattern member k of cluster J and
L is the number of cluster members.
Else xi becomes a new category wN +1
Step 5: Jump back to Step 1 to accept a new pattern if
there are more patterns to test. Else training is over and
resulting Euclidean ART matrix is the trained Euclidean
ART network.
wJ new =
where β be learning rate. The learning rate is change
base on the number of patterns of datasets. Meaning, the
number of patterns is larger, β is smaller. In other words,
adding an input to a category, the weight vector of this
category is increased/decreased to adapt to the new input.
In Fuzzy ART, wj is in [0,1]. Therefore, if wj < 0 then
assign wj = 0 and wj > 1 then assign wj = 1
Fast-commit slow-recode option is similar to Fuzzy
Original ART of Carpenter.
B. Discussion
In previous studies, learning rules are similar with two
terms, including the percent of old weight of the chosen
category and the percent of the ratio of the input to old weight
of the chosen category. Learning parameter β is used to present
the percent of terms. In our learning rule, learning parameter
shows the rate of learning process is quick or slow. Therefore,
our learning rule is different from previous studies.
Our novel model can coded into two models, including
Original New Fuzzy ART without normalizing inputs and
Complement New Fuzzy ART with normalizing inputs. Therefore, we have two models in experiments. Similarly with the
model of Carpenter [22].
With Complement Fuzzy ARTs, category proliferation problem is not happened by normalizing inputs. Moreover, choosing a suitable value of β (enough small), Original Fuzzy ARTs
void the category proliferation problem. Thus, do not solve this
problem in experiments.
N
d(j) =
(16)
VI. O UR APPROACH
A. Our novel model
Our goal is creating a new Fuzzy ART that clusters better.
We propose a new effective rule for updating weights of
227
219
Table V
T HE NUMBER OF SUCCESSFUL CLUSTERING PATTERNS IN G LASS DATASET
Table I
F EATURES OF DATASETS
Index
1
2
3
4
5
6
7
8
9
10
Dataset Name
Iris
Glass
Wine
Jain
Pathbased
Spiral
R15
Flame
Compound
Aggregation
#Categories
3
7
3
2
3
3
15
2
6
7
#Attribute
4
9
13
2
2
2
2
2
2
2
#Reocords
150
214
178
373
300
312
600
240
399
788
#Records
50
%
100
%
150
%
200
%
214
%
1
1–50
2
51–100
Category Index
Distribution
3
101–150
3
207–312
Table VII
T HE NUMBER OF SUCCESSFUL CLUSTERING PATTERNS IN S PIRAL
DATASET
T HE NUMBER OF SUCCESSFUL CLUSTERING PATTERNS IN I RIS DATASET
OriFART
30
100.0
55
91.7
65
72.2
88
73.3
118
78.7
ComFART
30
100.0
60
100.0
83
92.2
111
92.5
139
92.7
EucART
30
100.0
58
96.7
81
90.0
108
90.0
135
90.0
#Records
50
%
100
%
150
%
200
%
250
%
312
%
K-mean
30
100.0
60
100.0
85
94.4
112
93.3
140
93.3
Table IV
T HE DISTRIBUTION OF CATEGORIES IN G LASS DATASET
3
147–163
2
102–206
Table X shows the distribution of categories is not uniform
with 7 categories.
Table XI shows Complement New Fuzzy ART are greatly
better than other models in all sub-tests, excepting Euclidean
ART model in three first sub-tests. However, Euclidean ART
model is greatly lower Complement New Fuzzy ART in the
sub-test with 788 patterns.
Table III
2
71–146
1
1–101
E. Experiment 5: Testing with Aggregation dataset
Table IV shows the distribution of categories is not uniform
with 7 categories, especially, the distribution of the fourth
category is 0.
Table V shows our novel model is better some sub-tests
with the large number of testing patterns and not better some
sub-tests with the small one.
1
1–70
K-mean
41
82.0
53
53.0
53
35.3
73
36.5
87
40.7
Table VIII shows the distribution of categories is not uniform with 2 categories.
Table IX shows Original New Fuzzy ART are greatly better
than other models in all sub-tests, excepting Original Fuzzy
ART model in the sub-test with 240 patterns.
B. Experiment 2: Testing with Glass dataset
Category Index
Distribution
EucART
4
8.0
25
25.0
46
30.7
73
36.5
79
36.9
D. Experiment 4: Testing with Flame dataset
Table II shows the distribution of categories is uniform with
3 categories.
Table III shows the number of successful clustering patterns
in Iris dataset. Data are sorted by the number of testing
patterns. Table III shows Complement New Fuzzy ART is
better in all sub-tests.
ComNewFART
30
100.0
60
100.0
87
96.7
115
95.8
143
95.3
ComFART
6
12.0
25
25.0
61
40.7
67
33.5
80
37.4
Table VI shows the distribution of categories is uniform
with 3 categories.
Table VII shows Original New Fuzzy ART are greatly better
than other models in all sub-tests, excepting Euclidean ART
model in the sub-test with 312 patterns.
A. Experiment 1: Testing with Iris dataset
OriNewFART
30
100.0
59
98.3
84
93.3
114
95.0
144
96.0
OriFART
6
12.0
42
42.0
54
36.0
79
39.5
92
43.0
C. Experiment 3: Testing with Spiral dataset
Data of each datasets are normalized to values in [0,1]. In
all experiments, we choose a random vector of each category
to be the initial weight vector. Values of parameters are chosen
to reach to highest performance of models. In most datasets
and most models, α = 0.8, β = 0.1, ρ = 0.5. In Euclidean
ART with all datasets, ρ = 0.4.
#Records
30
%
60
%
90
%
120
%
150
%
ComNewFART
1
2.0
26
26.0
53
35.3
87
43.5
99
46.3
Table VI
T HE DISTRIBUTION OF CATEGORIES IN S PIRAL DATASET
Table II
T HE DISTRIBUTION OF CATEGORIES IN I RIS DATASET
Category Index
Distribution
OriNewFART
8
16.0
49
49.0
84
56.0
106
53.0
119
55.6
4
5
164–176
6
177-185
OriNewFART
44
88.0
71
71.0
72
48.0
85
42.5
101
40.4
120
38.5
ComNewFART
2
4.0
49
49.0
50
33.3
84
42.0
84
33.6
118
37.8
OriFART
2
4.0
37
37.0
38
25.3
59
29.5
69
27.6
103
33.0
ComFART
11
22.0
25
25.0
32
21.3
78
39.0
88
35.2
88
28.2
EucART
1
2.0
48
48.0
49
32.7
82
41.0
99
39.6
133
42.6
Table VIII
T HE DISTRIBUTION OF CATEGORIES IN F LAME DATASET
7
186-214
Category Index
Distribution
228
220
1
1–87
2
88–240
K-mean
22
44.0
22
22.0
25
16.7
64
32.0
80
32.0
102
32.7
Table IX
T HE NUMBER OF SUCCESSFUL CLUSTERING PATTERNS IN F LAME
Table XIII
T HE NUMBER OF SUCCESSFUL CLUSTERING PATTERNS IN W INE DATASET
DATASET
#Records
50
%
100
%
150
%
200
%
240
%
OriNewFART
50
100.0
98
98.0
148
98.7
190
95.0
203
84.6
ComNewFART
50
100.0
87
87.0
131
87.3
153
76.5
159
66.3
OriFART
50
100.0
87
87.0
121
80.7
171
85.5
211
87.9
ComFART
38
76.0
83
83.0
127
84.7
127
63.5
133
55.4
EucART
44
88.0
94
94.0
142
94.7
148
74.0
152
63.3
#Records
30
%
60
%
90
%
120
%
150
%
178
%
K-mean
39
78.0
54
54.0
104
69.3
154
77.0
188
78.3
Table X
T HE DISTRIBUTION OF CATEGORIES IN AGGREGATION DATASET
Category Index
Distribution
1
1–45
2
46–215
3
216–317
4
318–590
5
591–624
6
625–754
OriNewFART
30
100.0
59
98.3
75
83.3
92
76.7
116
77.3
138
77.5
ComNewFART
30
100.0
59
98.3
80
88.9
101
84.2
128
85.3
156
87.6
OriFART
30
100.0
59
98.3
77
85.6
99
82.5
124
82.7
149
83.7
ComFART
22
73.3
41
68.3
58
64.4
73
60.8
97
64.7
124
69.7
Table XIV
T HE DISTRIBUTION OF CATEGORIES IN R15
7
755–788
Category Index
Distribution
8
281–320
1
1–40
9
321–360
2
41–80
10
361–400
3
81–120
11
401–440
4
121–160
12
441–480
EucART
30
100.0
59
98.3
60
66.7
60
50.0
61
40.7
61
34.3
K-mean
30
100.0
60
100.0
81
90.0
104
86.7
128
85.3
156
87.6
DATASET
5
161–200
13
481–520
6
201–240
14
521–560
7
241–280
15
561–600
Experiment 6: Testing with Wine dataset
Table XII shows the distribution of categories is uniform
with 3 categories.
Table XIII shows Complement New Fuzzy ART is approximate K-mean and better than other models.
Table XIX shows Complement New Fuzzy ART is lower
K-mean with all sub-tests and Euclidean ART with two first
sub-tests, and better than other models.
F. Experiment 7: Testing with R15 dataset
Table XX shows the distribution of categories is not uniform
with 2 categories.
Data from Table XXI shows Complement New Fuzzy ART
are better than Original Fuzzy ART and Euclidean ART.
However, Complement New Fuzzy ART is a bit lower than
K-mean and Complement Fuzzy ART in two final sub-tests.
In summary, although several sub-tests of other models are
better than our novel model, our novel model is better than
exiting models in many sub-tests and in most datasets.
I. Experiment 10: Testing with Jain dataset
Table XIV shows the distribution of categories is uniform
with 15 categories.
Table XV shows Complement New Fuzzy ART is approximate Euclidean ART, equal to Complement Fuzzy ART, and
better than K-mean and Original Fuzzy ART.
G. Experiment 8: Testing with Compound dataset
Table XVI shows the distribution of categories is not
uniform with 6 categories.
Table XVII shows Original New Fuzzy ART is better than
other models, excepting Original Fuzzy ART. In two first subtests, Original New Fuzzy ART is better than Original Fuzzy
ART but lower in two final sub-tests.
VIII. C ONCLUSION
In this paper, we proposed a new effective learning rule for
Furry ART. Our novel model updates weights of categories
base on the ratio of the input to the weight of chosen category,
and a learning rate. The learning parameter shows the rate of
learning process is quick or slow. Changing learning rate is
made by the following rule: The number of inputs is larger,
H. Experiment 9: Testing with Pathbased dataset
Table XVIII shows the distribution of categories is uniform
with 3 categories.
Table XV
T HE NUMBER OF SUCCESSFUL CLUSTERING PATTERNS IN R15
Table XI
T HE NUMBER OF SUCCESSFUL CLUSTERING PATTERNS IN AGGREGATION
#Records
100
%
200
%
300
%
400
%
500
%
600
%
DATASET
#Records
200
%
400
%
600
%
788
%
OriNewFART
196
98.0
355
88.8
502
83.7
545
69.2
ComNewFART
193
96.5
367
91.8
558
93.0
615
78.0
OriFART
167
83.5
273
68.3
357
59.5
404
51.3
ComFART
167
83.5
328
82.0
509
84.8
538
68.3
EucART
200
100.0
392
98.0
573
95.5
577
73.2
K-mean
163
81.5
265
66.3
391
65.2
417
52.9
1
1–59
2
60–130
ComNewFART
98
98.0
191
95.5
287
95.7
387
96.8
487
97.4
587
97.8
OriFART
95
95.0
187
93.5
265
88.3
347
86.8
447
89.4
547
91.2
ComFART
98
98.0
191
95.5
287
95.7
387
96.8
487
97.4
587
97.8
EucART
100
100.0
192
96.0
287
95.7
387
96.8
487
97.4
587
97.8
K-mean
100
100.0
146
73.0
161
53.7
256
64.0
356
71.2
456
76.0
Table XVI
T HE DISTRIBUTION OF CATEGORIES IN C OMPOUND DATASET
Table XII
T HE DISTRIBUTION OF CATEGORIES IN W INE DATASET
Category Index
Distribution
OriNewFART
96
96.0
191
95.5
286
95.3
384
96.0
484
96.8
584
97.3
DATASET
Category Index
Distribution
3
131–178
229
221
1
1–50
2
51–142
3
143–180
4
181–225
5
226–383
6
384–399
Table XVII
T HE NUMBER OF SUCCESSFUL CLUSTERING PATTERNS IN C OMPOUND
Table XXI
T HE NUMBER OF SUCCESSFUL CLUSTERING PATTERNS IN JAIN DATASET
DATASET
#Records
100
%
200
%
300
%
399
%
OriNewFART
66
66.0
109
54.5
162
54.0
205
51.4
ComNewFART
69
69.0
103
51.5
155
51.7
197
49.4
OriFART
63
63.0
107
53.5
177
59.0
208
52.1
ComFART
56
56.0
69
34.5
84
28.0
141
35.3
EucART
69
69.0
105
52.5
158
52.7
201
50.4
#Records
100
%
200
%
300
%
373
%
K-mean
52
52.0
74
37.0
74
24.7
90
22.6
Table XVIII
T HE DISTRIBUTION OF CATEGORIES IN PATHBASED DATASET
Category Index
Distribution
1
1–110
2
111–207
3
208–300
ACKNOWLEDGEMENTS
This work is supported by Nafosted research project No.
102.02-2011.13.
R EFERENCES
[1] G. A. Capenter, S. Grossberg, and N. Markuron, “Fuzzy artmap-an
addaptive resonance architecture for incremental learning of analog
maps,” 1992.
Table XIX
T HE NUMBER OF SUCCESSFUL CLUSTERING PATTERNS IN PATHBASED
DATASET
OriNewFART
30
60.0
30
30.0
55
36.7
96
48.0
142
56.8
192
64.0
ComNewFART
33
66.0
33
33.0
57
38.0
98
49.0
148
59.2
198
66.0
OriFART
27
54.0
27
27.0
42
28.0
42
21.0
85
34.0
135
45.0
ComFART
40
80.0
40
40.0
51
34.0
51
25.5
77
30.8
127
42.3
EucART
29
58.0
29
29.0
51
34.0
89
44.5
139
55.6
189
63.0
K-mean
39
78.0
50
50.0
91
60.7
128
64.0
178
71.2
228
76.0
Table XX
T HE DISTRIBUTION OF CATEGORIES IN JAIN DATASET
Category Index
Distribution
1
1–276
ComNewFART
100
100.0
200
100.0
293
97.7
352
94.4
OriFART
99
99.0
199
99.5
209
69.7
258
69.2
ComFART
100
100.0
200
100.0
300
100.0
372
99.7
EucART
100
100.0
114
57.0
129
43.0
177
47.5
K-mean
100
100.0
200
100.0
300
100.0
365
97.9
[2] P. Simpson, “Fuzzy min-max neural networks - part 2: Clustering,” IEEE
Transactions on Fuzzy Systems, vol. 1, no. 1, p. 32, 1993.
[3] A.-H. Tan, “Adaptive resonance associative map,” Elsevier Science,
Neural Network, vol. 8, no. 3, pp. 437–446, 1995.
[4] C.-t. Lin, C.-j. Lin, and C. Lee, “Fuzzy adaptive learning control network
with on-line neural learing,” Elsevier Science-Fuzzy sets and Systems,
vol. 71, pp. 25–45, 1995.
[5] H. Isawa, M. Tomita, H. Matsushita, and Y. Nishio, “Fuzzy adaptive
resonance theory with group learning and its applications,” 2007 International Symposium on Nonlinear Theory and its Applications, no. 1,
pp. 292–295, 2007.
[6] A. Yousuf and Y. L. Murphey, “A supervised fuzzy adaptive resonance
theory with distributed weight update,” Springer-Verlag Berlin Heidelberg, vol. Part I, LN, no. 6063, pp. 430–435, 2010.
[7] P. Pardhasaradhi, R. P. Kartheek, and C. Srinivas, “A evolutionary fuzzy
art computation for the document clustering,” International Conference
on Computing and Control Engineering, 2012.
[8] R. Kondadadi and R. Kozma, “A modified fuzzy art for soft document
clustering,” Proceedings of the 2002 International Joint Conference on
Neural Networks. IJCNN’02, pp. 2545–2549, 2002.
[9] X.-H. Song, P. K. Hopke, M. Bruns, D. a. Bossio, and K. M. Scow, “A
fuzzy adaptive resonance theorysupervised predictive mapping neural
network applied to the classification of multivariate chemical data,”
Chemometrics and Intelligent Laboratory Systems, vol. 41, no. 2, pp.
161–170, 1998.
[10] S. Tomida, T. Hanai, H. Honda, and T. Kobayashi, “Gene expression
analysis using fuzzy art,” Genome Informatic, vol. 12, pp. 245–246,
2001.
[11] R. Kenaya and K. C. Cheok, “Euclidean art neural networks,” Proceedings of the World Congress on Engineering and Computer Science 2008,
no. 1, 2008.
[12] H. Isawa, H. Matsushita, and Y. Nishio, “Improved fuzzy adaptive
resonance theory combining overlapped category in consideration of
connections,” IEEE Workshop on Nonlinear Circuit Networks, pp. 8–
11, 2008.
[13] J. Huang, M. Georgiopoulos, and G. L. Heileman, “Fuzzy art properties,”
Elsevier Science, Neural Network, vol. 8, no. 2, pp. 203–213, 1995.
[14] M. Geogiopoulos, H. Fernlund, G. Bebis, and G. Heileman, “Fart and
fartmap-effects of the choice parameter,” pp. 1541–1559, 1996.
[15] G. C. Anagnostopoulos and M. Georgiopoulos, “Category regions as
new geometrical concepts in fuzzy-art and fuzzy-artmap,” Elsevier
Science, Neural Network, vol. 15, pp. 1205–1221, 2002.
[16] M. Cano, Y. Dimitriadis, E. Gomez, and J. Coronado, “Learning from
noisy information in fasart and fasback neuro-fuzzy systems,” Elsevier
Science, Neural Network, vol. 14, pp. 407–425, 2001.
[17] T. Burwick and F. Joublin, “Optimal algorithmic complexity of fuzzy
art,” Kluwer Academic Publisher-Neural Processing Letters, vol. 7, pp.
37–41, 1998.
[18] I. Dagher, M. Georgiopoulos, G. L. Heileman, and G. Bebis, “An
ordering algorithm for pattern presentation in fuzzy artmap that tends
to improve generalization performance.” IEEE transactions on neural
networks, vol. 10, no. 4, pp. 768–78, 1999.
[19] K. Kobayashi, S. Mizuno, T. Kuremoto, and M. Obayashi, “A reinforcement learning system based on state space construction using fuzzy art,”
Proceedings of SICE Annual Conference, vol. 2005, no. 1, pp. 3653–
3658, 2005.
[20] M. Pacella, Q. Semeraro, and A. Anglani, “Adaptive resonance theorybased neural algorithms for manufacturing process quality contro,”
International Journal of Production Research, no. 21, pp. 4581–4607.
[21] L. E. Parker, “Classification with missing data in a wireless sensor
network,” IEEE SoutheastCon 2008, pp. 533–538, Apr. 2008.
this parameter is smaller. We proposed our novel model with
the new learning rule to compare to exiting models.
Moreover, we have conducted experiments with ten datasets
to prove the effectiveness of our novel model. Experiments
show our novel model is the best with four datasets (Iris, Glass,
Spiral, Flame), better than or equal to other models with four
datasets (Aggregation, Wine, R15, Compound). However, Kmean is better than our models with two datasets (Pathbase,
Jain) and complement Fuzzy ART with Jain dataset.
From data of experiments, we obtain two important conclusions, including (i) our novel model clusters correctly from
80% to 100% with formal small datasets that categories
distribute uniformly and (ii) from 50% to 80% with formal
small datasets that its categories distribute non-uniformly and
consist of many categories.
#Records
50
%
100
%
150
%
200
%
250
%
300
%
OriNewFART
99
99.0
199
99.5
289
96.3
353
94.6
2
277–373
230
222
[22] G. Carpenter, S. Grossberg, and D. B. Rosen, “Fuzzy art : Fast stable
learning and categorization of analog patterns by an adaptive resonance
system,” Pergamon Press-Neural network, vol. 4, pp. 759–771, 1991.
[23] B.Moore, “Art 1 and pattern clustering,” Proceedings of the 1988
Connectionist Models Summer School, Morgan Kaufmann Publishers,
pp. 174–1985, 1989.
[24] J.B.MacQueen, “Some methods for classification and analysis of multivariate observations,” Proceedings of 5th Berkeley Symposium on
Mathematical Statistics and Probability, no. 1, pp. 281–297, 1967.
[25] “Uci database,” Avaliable at: />[26] “Shape database,” Avaliable at: nsuu.fi/sipu/datasets/.
231
223