DSpace at VNU: Occurrence of cyclic and linear siloxanes in indoor air from Albany, New York, USA, and its implications for inhalation exposure
Bạn đang xem bản rút gọn của tài liệu. Xem và tải ngay bản đầy đủ của tài liệu tại đây (553.82 KB, 7 trang )
Science of the Total Environment 511 (2015) 138–144
Contents lists available at ScienceDirect
Science of the Total Environment
journal homepage: www.elsevier.com/locate/scitotenv
Occurrence of cyclic and linear siloxanes in indoor air from Albany,
New York, USA, and its implications for inhalation exposure
Tri Manh Tran a,b, Kurunthachalam Kannan a,c,⁎
a
Wadsworth Center, New York State Department of Health, Department of Environmental Health Sciences, School of Public Health, State University of New York at Albany, Empire State Plaza,
P.O. Box 509, Albany, NY 12201-0509, United States
Faculty of Chemistry, Hanoi University of Science, Vietnam National University, 19 Le Thanh Tong, Hoan Kiem, Hanoi, Viet Nam
c
Biochemistry Department, Faculty of Science and Experimental Biochemistry Unit, King Fahd Medical Research Center, King Abdulaziz University, Jeddah 21589, Saudi Arabia
b
H I G H L I G H T S
•
•
•
•
Cyclic and linear siloxanes were determined in 60 indoor air samples.
Concentrations of 14 siloxanes ranged from 249 to 6210 ng/m3 with the highest levels in salons.
High molecular weight siloxanes were preferably sorbed in particulate phase of indoor air.
Inhalation exposure dose to siloxanes ranged from 0.27 to 3.18 μg/kg-bw/d.
a r t i c l e
i n f o
Article history:
Received 10 October 2014
Received in revised form 7 December 2014
Accepted 8 December 2014
Available online xxxx
Editor: Adrian Covaci
Keywords:
Siloxane
Indoor air
Inhalation exposure
PDMS
Cyclic methylsiloxane
D5
a b s t r a c t
Cyclic and linear siloxanes are used in a wide variety of household and consumer products. Nevertheless, very few
studies have reported the occurrence of these compounds in indoor air or inhalation exposure to these compounds.
In this study, five cyclic (D3–D7) and nine linear siloxanes (L3–L11) were determined in 60 indoor air samples
collected in Albany, New York, USA. The mean concentrations of individual siloxanes in particulate and vapor
phases ranged from b12 μg g−1 (for octamethyltrisiloxane [L3], decamethyltetrasiloxane [L4]) to 2420 μg g−1
(for decamethylcyclopentasiloxane [D5]) and from 1.05 ng m−3 to 543 ng m−3, respectively. The mean concentrations of individual siloxanes in combined particulate and vapor phases of bulk indoor air ranged from 1.41 ng m−3
(for L4) to 721 ng m−3 (for D5). Cyclic siloxanes hexamethylcyclotrisiloxane (D3), octamethylcyclotetrasiloxane
(D4), D5, dodecamethylcyclohexasiloxane (D6), and octadecamethylcycloheptasiloxane (D7) were found in all indoor air samples. The mean concentrations of total siloxanes (i.e., sum of cyclic and linear siloxanes) ranged from
249 ng m−3 in laboratories to 6210 ng m−3 in salons, with an overall mean concentration of 1470 ng m−3 in
bulk indoor air samples. The calculated mean daily inhalation exposure doses of total siloxanes (sum of 14 siloxanes) for infants, toddlers, children, teenagers, and adults were 3.18, 1.59, 0.76, 0.34, and 0.27 μ g/kg-bw/day,
respectively.
© 2014 Elsevier B.V. All rights reserved.
1. Introduction
Siloxanes are organo-silicone compounds and consist of – (CH3)2SiO
– structural units. Two major groups of siloxanes of commercial significance are cyclic and linear siloxanes. Siloxanes are used in a wide variety
of consumer and industrial products (Horii and Kannan, 2008; Ortega
and Subrenat, 2009). Personal care products contain siloxanes at concentrations on the order of several percentages by weight (Horii and
Kannan, 2008; Wang et al., 2009). Cyclic siloxanes – D4, D5, D6, and
D7 – were found in consumer products at mean concentrations of
⁎ Corresponding author at: Wadsworth Center, Empire State Plaza, PO Box 509, Albany,
NY 12201-0509, USA.
E-mail address: (K. Kannan).
/>0048-9697/© 2014 Elsevier B.V. All rights reserved.
9380, 81,800, 43,100, and 846 μg g− 1 respectively; skin lotions
contained total linear siloxanes at concentrations (sum of L4 to L14)
as high as 73,000 μg g−1 (i.e., 7.3% by weight; Horii and Kannan,
2008). The total cyclic siloxane concentrations (D6 to D25) in siliconized rubber products marketed for food contact use were in the range
of 3310 to 14,700 μg g−1 (Kawamura et al., 2001).
Studies have reported the occurrence of siloxanes in a wide range of
environmental samples, including outdoor air, water, wastewater, indoor dust, soil, landfill biogas, sediment, sewage sludge, and biota, including humans (Wang et al., 2001, 2013a,2013b; Badjagbo et al.,
2010; Kierkegaard and McLachlan, 2010; Sánchez-Brunete et al.,
2010; Zhang et al., 2011; Bletsou et al., 2013; Blanchard et al., 2014;
Cortada et al., 2014; Lee et al., 2014). A recent review has summarized
environmental occurrence of cyclic siloxanes (Wang et al., 2013a).
T.M. Tran, K. Kannan / Science of the Total Environment 511 (2015) 138–144
Accumulation of D5 in fish from the arctic environment has been shown
(Warner et al., 2010).
Despite the use of siloxane-containing products in the indoor environment and the volatility of siloxanes, very few studies have reported
the occurrence of these compounds in indoor air (Shields et al., 1996;
Latimer et al., 1998; Kaj et al., 2005; Companioni-Damas et al., 2014).
One study reported the occurrence of cyclic and linear siloxanes in indoor air samples collected from the UK and Italy, at concentrations as
high as 170 μg m−3 (Pieri et al., 2013). Another study reported a median
concentration of 2200 ng m−3 for the sum of D4, D5, and D6 concentrations in indoor air samples from Chicago, Illinois, USA (Yucuis et al.,
2013). A guidance value of 4000 μg m−3 and a precautionary guideline
value of 400 μg m−3 were recommended for the sum of D3 to D6 in indoor air in Germany (German Environment Agency, 2011).
Studies have reported reproductive and endocrine effects of siloxanes in laboratory animals. Estrogenic and androgenic activities of D4
and/or D5 have been reported in rats (McKim et al., 2001; Quinn et al.,
2007b). A recent article has reviewed the toxicity of cyclic siloxanes
(Wang et al., 2013a). The potential of D4 to suppress the preovulatory luteinizing hormone surge and ovulation has been shown in
laboratory rodent studies (Quinn et al., 2007a). Meeks et al. (2007)
showed that a single dose of D4 on the day prior to mating resulted in
a significant reduction in fertility in female rats. A dose-dependent increase in uterine weights in ovariectomized mice and an increase in
uterine peroxidase activity were shown in D4-exposed mice (He et al.,
2003). Inhalation exposure of rats to D5 did not alter humoral immunity
and caused only minor, transient changes in hematological, clinical, and
anatomical parameters (Burns-Naas et al., 1998). Several environmental risk assessment studies conducted in Canada, Sweden and the UK
suggested that methylsiloxanes are persistent and can pose harmful effects on the environment (Kaj et al., 2005; Environment Canada, 2008;
Brooke et al., 2009).
Siloxanes are ubiquitous in the environment, and potential exists for
contamination in laboratories and sampling devices, which imposes
challenges in the collection and analysis of siloxanes in environmental
samples. A few studies have reported the methods to collect siloxanes
in air (Wang et al., 2001; Badjagbo et al., 2009; Kierkegaard and
McLachlan, 2010; Yucuis et al., 2013; Pieri et al., 2013; ConpanioniDamas et al., 2014). In this study, by use of a combination of quartz
fiber filters and polyurethane foam (PUF) plugs, we collected indoor
air samples by a low-volume air sampler at various indoor environments including homes, offices, schools, salons and public places. The
objectives of this study were to determine five cyclic and nine linear siloxanes in both particulate and vapor phases of indoor air in Albany,
New York, USA. Inhalation exposure of humans to siloxanes was also
estimated.
2. Materials and methods
2.1. Standards
Hexamethylcyclotrisiloxane (D3), octamethylcyclotetrasiloxane
(D4), decamethylcyclopentasiloxane (D5), and dodecamethylcyclohexasiloxane (D6), with a purity of N95%, were purchased from Tokyo
Chemical Industry, Inc. (Wellesley Hills, MA, USA). Octamethyltrisiloxane (L3) (98%), decamethyltetrasiloxane (L4) (97%), and dodecamethylpentasiloxane (L5) (97%) were purchased from Sigma-Aldrich
(St. Louis, MO, USA). Polydimethylsiloxane (PDMS) 200 fluid (viscosity
of 5 cSt) that contained octadecamethylcycloheptasiloxane (D7), linear
tetradecamethylhexasiloxane (L6), and other polydimethylsiloxanes
(L7, L8, L9, L10, and L11) were purchased from Sigma-Aldrich
(Table S1). Tetrakis (trimethylsiloxy)-silane (M4Q) of 97% purity was
from Aldrich, and 13C-labeled decamethylcyclopentasiloxane[2,4,6,8,10-13C5] (13C-D5) of 98% purity was from Bristlecone Biosciences, Inc. (Brea, CA, USA), and these two compounds were used as
surrogate standards. All standards were dissolved in hexane. The
139
composition of PDMS was determined and reported in our previous
study (Horii and Kannan, 2008) and the PDMS mixture was used in
the determination of concentrations of linear siloxanes.
2.2. Sample collection and preparation
PUF plugs (ORBO-1000 PUF dimensions: 2.2 cm O.D × 7.6 cm length)
were from Supelco (Bellefonte, PA, USA). For the analysis of background
levels of siloxanes, PUF plugs were extracted twice with 100 mL mixture
of dichloromethane (DCM) and hexane (3:1, v:v) and analyzed by gas
chromatography–mass spectrometry (GC–MS). It was found that each
of the newly purchased PUF plugs contained D3, D4, D5, D6, and D7 at
6.03 ± 4.72 ng, 19.9 ± 6.59 ng, 32.2 ± 12.5 ng, 7.44 ± 3.05 ng, and
4.18 ± 2.19 ng, respectively (n = 5). Therefore, all PUF plugs required
additional cleaning prior to use. PUFs were purified by shaking with
100 mL mixture of DCM and hexane (3:1, v:v) for 30 min. This procedure was performed twice. The cleaned PUFs were wrapped in solvent
rinsed aluminum foil, stored in a glass jar, and kept in an oven at 100 °C
until sampling. The quartz fiber filters (Whatman, grade QM-A, pore
size: 2.2 μm with a particle retention rating at 98% efficiency in liquid,
32 mm diameter) were prepared by heating at 450 °C for 20 h. The purified quartz fiber filters were kept in an oven at 100 °C until use. The quartz
fiber filters were weighed in an analytical balance (to nearest 0.01 mg)
before and after the collection of air samples for the determination of particle content.
Two PUF plugs were packed in tandem in a glass tube (ACE glass,
2.2 cm O.D × 25 cm length), and the quartz fiber filter was held with a
Teflon cartridge (Supelco, PUF filter cartridge assembly, cat. no.
21031) on top of the glass tube packed with PUF plugs. All glassware
used for sampling and analysis was rinsed with acetone and hexane
and heated at 450 °C immediately prior to use.
Indoor air samples were collected for 12 to 24 h by a low-volume air
sampler (LP-20; A.P. Buck Inc., Orlando, FL, USA) at a flow rate of 5 L per
minute. The total volume of air collected from each location ranged
from 3.6 m3 to 7.2 m3. Air samples (both PUFs and filters) were kept
at − 18 °C until analysis. The samples were kept for no longer than 3
weeks for analysis. The samples were collected from March to May
2014 at several locations in Albany, New York, USA. The sampling locations were grouped into six categories: homes (n = 20), offices (n = 7),
laboratories (n = 13), schools (n = 6), salons (n = 6, hair and nail salons), and public places (n = 8, e.g., shopping malls).
Prior to analysis, samples (both PUFs and filters) were spiked with
100 ng of M4Q and 13C-D5 as surrogate standards. PUF plugs were extracted by shaking in an orbital shaker (Eberbach Corporation, Ann
Arbor, MI, USA) with DCM and hexane (3:1, v:v) for 30 min. The extraction was performed twice, with 100 mL of solvent mixture for the first
extraction and 80 mL for the second. The extracts were concentrated
in a rotary evaporator at 40 °C to approximately 5 mL. The solution
was then transferred into a 12-mL glass tube and concentrated by a gentle stream of nitrogen to exactly 1 mL and transferred into a GC vial.
The particulate samples were extracted by shaking glass fiber filters
with a mixture of DCM and hexane (3:1; 20 mL; v:v) each time for
5 min, which was performed three times. The extract was concentrated
in a rotary evaporator and then by a gentle stream of nitrogen to exactly
1 mL. The extract was then transferred into a GC vial.
2.3. Instrumental analysis
Analysis was performed on an Agilent Technologies 6890 gas chromatograph (GC) interfaced with a 5973 mass spectrometer (MS).
Separation of siloxanes was achieved by HP-5MS capillary column
(Agilent, Santa Clara, CA, USA; 5% diphenyl 95% dimethylpolysiloxane,
30 m × 0.25 mm i.d. × 0.25 μm film thickness). Samples were injected
in the splitless mode, and the injection volume was 2 μL. The oven
temperature was programmed from 40 °C (held for 2 min) to 220 °C
at 20 °C/min, increased to 280 °C at 5 °C/min (held for 10 min), and
140
T.M. Tran, K. Kannan / Science of the Total Environment 511 (2015) 138–144
held for 5 min at 300 °C. Ion fragment m/z 207 was monitored for D3, m/z
281 for D4, D7, and L5, m/z 355 for D5, and m/z 341 for D6. Ion fragment
m/z 147 was used for confirmation of L6 and L7. Ion fragment m/z 207 was
monitored for confirmation of L4 and m/z 221 for the other siloxanes
(Horii and Kannan, 2008; Badjagbo et al., 2009; Zhang et al., 2011;
Bletsou et al., 2013). Ion fragment m/z 281 was monitored for M4Q and
m/z 360 for 13C-D5.
cyclic and three linear siloxanes in gas and particulate phases were
from 73.4 to 116%, with an RSD of 7.3 to 15.6% (Table 1). For values
below the MQL, the concentrations were set at one-half of the MQL for
statistical analysis. Statistical analysis was conducted through Microsoft
Excel (Microsoft Office 2010) and GraphPad Prism version 5.0. Statistical significance was set at p b 0.05.
3. Results and discussion
2.4. Quality assurance and quality control
3.1. Concentrations of siloxanes in particulate phase
Siloxanes are present in several laboratory products, which have
been examined in our previous study (Horii and Kannan, 2008). Efforts
were taken to minimize background levels of siloxane contamination in
our analysis. All glassware was heated for 20 h at 450 °C prior to use. Solvents were used directly from glass bottles, and exposure of solvent to
air was kept minimal. GC vials were capped in an aluminum foil (instead
of rubber septum). Procedural blanks were analyzed with every set of 8
samples. D3, D4, D5, and D6 levels in procedural blanks were 3.31 ±
0.91 ng, 4.2 ± 2.46 ng, 7.18 ± 3.52 ng, and 1.8 ± 0.36 ng, respectively.
Other siloxanes were not detected in the procedural blanks. The contamination of siloxanes in procedural blanks is from solvents, glassware,
or residual levels present in PUFs (after purification). The reported concentrations in indoor air samples were subtracted by the average values
found for the procedural blanks. The calibration curve was linear over a
concentration range of 1 ng/mL to 500 ng/mL for individual siloxanes
(R2 N 0.995). Duplicate samples were collected in three locations and
the relative standard deviation (RSD) of measured concentrations was
b10%.
A total of 100 ng of M4Q and 13C-D5, D3, D4, D5, D6, L3, L4, and L5
were spiked into blank PUF plugs and a glass fiber filter and passed
through the entire analytical procedure. The recoveries of target compounds spiked into PUFs and filters are shown in Table 1. The recoveries
of M4Q spiked into samples ranged from 90.8 to 116% (mean: 101%;
RSD: 8.7%) in the particle phase and from 87.5 to 120% (mean: 104%;
RSD: 10.4%) in the vapor phase. The method detection limit (MDL)
and the method quantification limit (MQL) were determined on the
basis of an average volume of air collected, which was 3.6 m3; the average weight of airborne particle collected, which was 0.25 mg, and the
lowest point in the calibration standard with a signal-to-noise ratio of
3 and 10, respectively. The sample concentration/dilution factors were
included in the calculation of MDL and MQL. For the vapor phase, the
MQL ranged from 0.22 to 2.22 ng m−3, and, for the particulate phase,
the MQL ranged from 3.2 to 32 ng g−1. The mean recoveries of four
The concentrations of individual siloxanes in the particulate phase
(Table 2) were calculated based on the weight of the airborne particle
collected in a glass fiber filter (that ranged from 0.15 mg to 0.45 mg).
D3, D4, D5, D6, and D7 were found in all samples, whereas L3 and L11
were detected in only 26.7% and 8.33% of the samples, respectively. L5
to L9 were found frequently in samples (75% to 95%) at high concentrations, whereas L3, L4, and L11 were rarely detected. Among various siloxanes analyzed, D5 and L8 were the most abundant compounds in
the particulate phase. The concentrations of D5 in the particulate
phase ranged from 29.3 to 34,300 μg g−1 (mean: 2420) and the concentrations of L8 ranged from below MQL to 12,700 μg g−1 (mean: 1320).
The air volume based measurements (ng m−3) of siloxanes in the particulate phase of indoor air are shown as the supporting information
(Table S2).
Because airborne particles are a source of indoor dust after deposition, concentrations of siloxanes measured in airborne particles were
compared with those reported in indoor dust. The concentrations of siloxanes in airborne particles were four times higher than the concentrations reported in indoor dust from China (Lu et al., 2010). The sum of
mean concentration of five cyclic and nine linear siloxanes in the particulate phase of indoor air was 6000 μg g−1 (i.e., approximately 0.6% by
weight). The highest concentrations of siloxanes were found in salons.
Personal care products are the major sources of siloxanes in the indoor
environment (Horii and Kannan, 2008; Wang et al., 2009), which explains the elevated concentrations found in air samples from salons.
3.2. Concentrations of siloxanes in vapor phase
The concentrations of siloxanes in the vapor phase of indoor air are
shown in Table 3. The concentrations of D4, D5, and D6 were higher in
the vapor phase than in the particulate phase (Fig. 1). Higher concentrations of these three siloxanes in the vapor phase than in the particulate
Table 1
The method detection limit, quantitation limit and the recoveries of siloxanes through the analytical method used in this study.
Vapor phase
Particulate phase
Recoveries, % (n = 8)
MDL (ng m
D3
D4
D5
D6
D7
L3
L4
L5
L6
L7
L8
L9
L10
L11
M4Q
13
C-D5
0.06
0.08
0.06
0.06
0.19
0.14
0.14
0.14
0.19
0.19
0.56
0.56
0.83
0.83
–
–
−3
)
Recoveries, % (n = 8)
MQL (ng m
0.22
0.28
0.22
0.22
0.56
0.83
0.83
0.56
0.83
0.83
1.94
1.94
2.22
2.22
–
–
−3
)
Range
Mean
RSD
MDL (ng g−1)
MQL (ng g−1)
Range
Mean
RSD
66.0–84.9
85.4–121
88.7–126
93.9–123
–
75.5–110
93.6–123
82.5–116
–
–
–
–
–
–
87.5–120
84.4–122
73.4
105
109
109
–
93.9
112
103
–
–
–
–
–
–
104
106
7.3
13.1
14.7
11.9
–
10.6
12.7
11.9
–
–
–
–
–
–
10.4
14.4
0.8
1.2
0.8
0.8
2.8
2.0
2.0
2.0
2.0
2.0
8.0
8.0
12.0
12.0
–
–
3.2
4.0
3.2
3.2
8.0
12.0
12.0
8.0
12.0
12.0
28.0
28.0
32.0
32.0
–
–
77.5–105
86.6–119
98.4–125
80.7–115
–
79.5–112
78.0–122
96.9–120
–
–
–
–
–
–
90.8–116
83–115
91.2
106
116
99.7
–
96.9
104
110
–
–
–
–
–
–
101
97.6
9.8
11.8
8.6
12.2
–
12.0
15.6
8.7
–
–
–
–
–
–
8.7
11.8
Method detection limit (MDL) and method quantitation limit (MQL) were calculated on the basis of the average volume of air collected which was 3.6 m3 and the average weight of airborne particle collected, which was 0.25 mg. RSD: relative standard deviation.
Table 2
Concentrations of individual siloxanes in the particulate phase of indoor air samples collected from various locations in Albany, New York, USA (μg g−1).
Homes
n = 20
Offices
n=7
Laboratories
n = 13
Schools
n=6
Public places
n=8
Total
n = 60
D3
D4
D5
D6
D7
L3
L4
L5
L6
L7
L8
L9
L10
L11
Σ Sil.
8.59–38.9
24.3
100
17.6–66.3
42.7
100
13–131
40.9
100
15.3–41.6
27.7
100
21–34.5
26.7
100
6.43–37.6
14.6
100
6.43–131
29.3
100
17.9–169
47.6
100
19.2–50.4
35
100
13.9–108
49.7
100
24–400
153
100
145–1680
665
100
13.4–75
37.6
100
13.4–1680
118
100
127–12,400
1590
100
40.4–2100
795
100
29.3–394
167
100
258–17,300
5610
100
849–34,300
10,400
100
41–2950
1230
100
29.3–34,300
2420
100
28.8–842
188
100
60.1–702
262
100
9.42–106
47.1
100
66.3–1500
565
100
147–2450
955
100
59.8–652
240
100
9.42–2450
287
100
17.6–438
104
100
20.9–656
231
100
10.3–319
79.8
100
34.3–443
275
100
37.4–432
213
100
7–271
76.1
100
7–656
138
100
n.d.–12.2
b12
25
n.d.–15.6
b12
14.3
n.d.–179
27.3
76.9
n.d.
n.d.
–
n.d.
n.d.
–
n.d.
n.d.
–
n.d.–179
b12
26.7
n.d.–29.8
b12
30
n.d.–15.6
b12
42.9
n.d.
n.d.
–
n.d.–20
b12
50
n.d.–34.5
14
83.3
n.d.–19.9
b12
25
n.d.–34.5
b12
36.7
n.d.–251
40.3
80
n.d.–93.3
32.8
85.7
n.d.–408
41.5
46.2
n.d.–211
64.8
66.7
23.1–264
103
100
9.6–33
19
100
n.d.–408
45.6
76.7
n.d–1270
184
85
n.d.–330
81
28.6
n.d.–22.7
6.13
53.8
10.7–741
292
100
267–1320
662
100
59.6–872
281
100
n.d.–1320
205
76.7
23.5–1950
390
100
12.8–1720
511
100
n.d.–64.4
31.3
84.6
36.8–3390
1060
100
654–3670
2230
100
b12–514
340
100
n.d.–3670
570
95
53.7–2550
987
100
b28–2260
787
100
n.d.–77.7
36.6
76.9
98.3–3690
1350
100
2210–12,700
6710
100
78.8–1640
666
100
n.d.–12,700
1320
95
b28–1920
435
100
b28–250
128
100
n.d.–32.3
b28
46.2
n.d.–345
201
83.3
468–12,700
4320
100
n.d.–146
67.9
75
n.d.–12,700
623
78.3
n.d.–374
86.9
75
n.d.–53.7
b32
14.3
n.d.–104
b32
7.69
n.d.–127
58.1
50
175–4530
1600
100
n.d.–45.6
b32
25
n.d.–4530
202
46.7
n.d.
n.d.
–
n.d.
n.d.
–
n.d.
n.d.
–
n.d.
n.d.
–
n.d.–295
145
83.3
n.d.
n.d.
–
n.d.–295
b32
8.33
–
4100
–
–
2940
–
–
567
–
–
9680
–
–
28,000
–
–
3000
–
–
6000
–
Freq. %: frequency of siloxanes detectable in particulate phase. n.d.: not detectable. “b”: below the limit of quantification of the method. Σ Sil.: the total concentrations of all siloxanes D3–D7 and L3–L11
Table 3
Concentrations of individual siloxanes in the vapor phase of indoor air samples collected from various locations in Albany, New York, USA (ng.m−3).
Homes
n = 20
Offices
n=7
Laboratories
n = 13
Schools
n=6
Salons
n=6
Public places
n=8
Total
n = 60
Range
Mean
Freq. %
Range
Mean
Freq. %
Range
Mean
Freq. %
Range
Mean
Freq. %
Range
Mean
Freq. %
Range
Mean
Freq. %
Range
Mean
Freq. %
D3
D4
D5
D6
D7
L3
L4
L5
L6
L7
L8
L9
L10
L11
Σ Sil.
3.46–68.6
21.6
100
1.96–5.99
8.00
100
3.76–61.3
15.7
100
6.25–20.2
13.4
100
6.34–16.1
10.6
100
12.6–43.2
22.1
100
3.46–68.6
16.9
100
4.37–210
50.9
100
0.06–7.8
23.06
85.7
5.27–87.5
31.6
100
12.8–245
76.1
100
193–722
446
100
34.3–501
196
100
3.58–722
105
100
18–812
263
100
6.36–92.5
74.54
100
15.8–163
70.5
100
111–1020
349
100
375–3710
2500
100
236–2420
1090
100
12.7–3710
543
100
7.91–240
50.9
100
3.09–30.7
26.64
100
4.68–111
23.9
100
10.5–136
76.8
100
121–885
374
100
4.1–283
144
100
4.1–885
89.5
100
7.03–157
39.8
100
2.92–46.2
34.56
100
n.d.–59.4
11.5
61.5
4.23–58.3
27.4
100
8.3–65.7
31.4
100
3.71–140
71.3
100
n.d.–157
35.2
91.7
n.d.–5.62
b0.83
35
n.d.–1.29
b0.83
14.3
n.d.–53.5
4.54
23.1
n.d.
n.d.
–
n.d.–2.65
0 b 0.83
83.3
n.d.–2.96
b0.83
100
n.d.–53.4
1.58
91.7
n.d.–8.39
b0.83
25
n.d.
n.d.
–
n.d.–3.68
b0.83
30.8
n.d.–2.54
b0.83
14.3
n.d.–8.87
3.34
50
n.d.–5.69
b0.83
12.5
n.d.–8.87
b0.83
28.3
n.d.–106
12.7
45
n.d.–49.2
15.43
42.9
n.d.–38.8
9.11
38.5
n.d.–3.55
1.16
33.3
1.68–28.3
15.1
100
n.d.–31.8
12.2
75
n.d.–106
11.2
55
n.d.–191
31.1
55
n.d.–13.7
9.12
57.1
n.d.–92.3
12.6
38.5
n.d.–40.3
10.6
50
7.12–150
90.9
100
4.77–424
158
100
n.d.–424
45.3
58.3
n.d.–175
42.3
50
n.d.–68.6
42.05
71.4
n.d.–8.95
0.82
7.69
n.d.–103
39.6
66.7
56.7–510
312
100
n.d.–368
159
62.5
n.d.–510
75.6
51.7
n.d.–219
30.1
25
n.d.
n.d.
–
n.d.–134
10.7
7.69
n.d.–120
38.9
50
35.7–346
111
100
n.d.–51.5
8.77
62.5
n.d.–346
28.5
30
n.d.
n.d.
–
n.d.
n.d.
–
n.d.
n.d.
–
n.d.
n.d.
–
n.d.–48.9
20.3
50
n.d.
n.d.
–
n.d.–48.9
2.47
6.67
n.d.
n.d.
–
n.d.
n.d.
–
n.d.
n.d.
–
n.d.
n.d.
–
n.d.
n.d.
–
n.d.
n.d.
–
n.d.
n.d.
–
n.d.
n.d.
–
n.d.
n.d.
–
n.d.
n.d.
–
n.d.
n.d.
–
n.d.
n.d.
–
n.d.
n.d.
–
n.d.
n.d.
–
–
546
–
–
236
–
–
193
–
–
636
–
–
3920
–
–
1870
–
–
956
–
T.M. Tran, K. Kannan / Science of the Total Environment 511 (2015) 138–144
Salons
n=6
Range
Mean
Freq. %
Range
Mean
Freq. %
Range
Mean
Freq. %
Range
Mean
Freq. %
Range
Mean
Freq. %
Range
Mean
Freq. %
Range
Mean
Freq. %
n.d.: not detectable. Freq. %: frequency of siloxanes detectable in indoor air. “b”: below the limit of quantification of the method. Σ Sil.: the total concentrations of all siloxanes D3–D7 and L3–L11
141
142
T.M. Tran, K. Kannan / Science of the Total Environment 511 (2015) 138–144
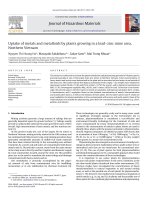
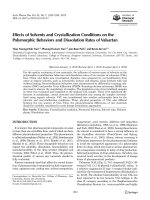
Fig. 1. Concentrations of individual siloxanes in the vapor and particulate phases of indoor air (n = 60) from Albany, New York, USA.
phase can be explained by their high vapor pressure (see Latimer et al.,
1998). However, it should be noted several environmental factors including temperature, relative humidity, and amount and type of particulate matter can affect partitioning of siloxanes in air (Latimer et al.,
1998). Further discussion regarding gas-particle partitioning (Kp) of siloxanes can be found in the Supporting information (Table S3).
The mean ratio for concentrations of D4 between vapor and particulate phases was 4.7, and this ratio was 3.0 and 3.8 for D5 and D6, respectively. In contrast, the high molecular weight siloxanes such as L8 and L9
were found more frequently in the particulate phase. Among all microenvironments studied, L8 and L9 concentrations were 6 and 70 times,
respectively, higher in the particulate phase than in the vapor phase.
L10 and L11 were detected only in the particulate phase of all samples.
High molecular weight siloxanes have low vapor pressures, which explain the preferential partitioning of L10 and L11 to the particulate
phase. It is also worth to note that retention of siloxanes onto glass
fiber filter from vapor phase during sampling is not known.
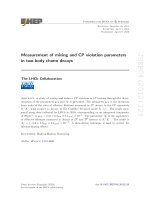
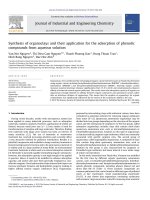
3.3. Siloxanes in bulk indoor air (particulate plus vapor phases)
Total concentrations of individual siloxanes in indoor air were determined by summation of concentrations measured in the particulate and
vapor phases on a volumetric (m3) basis (Table 4). The mean concentration of siloxanes was the highest in indoor air samples collected from
hair salons and the lowest in laboratories (Fig. 2). Eleven of the 14 target
siloxanes were found in all samples from hair salons. L3, L4, L10, and L11
were found less frequently in the air samples. The mean concentration
of siloxanes found in hair salons was 6210 ng m−3; the next highest
concentration was in samples from the public places (1990 ng m−3)
and schools (1240 ng m−3). The mean total concentration of siloxanes
in hair salons was 25 times higher than the lowest value of
249 ng m−3 found in laboratories and 4 times higher than the total
mean value for all samples (1470 ng m− 3). As indicated above, high
concentrations in siloxanes in salons can be explained by the extensive
use of personal care products in hair salons. The total mean concentration of siloxanes found in our study is similar to that reported
by Yucuis et al. (2013), who found a median concentration of
2200 ng m−3 for the sum of D4, D5, and D6 in indoor air (in laboratories
and offices) from Chicago, Illinois, USA. However, our values are much
lower than those of the mean concentrations of eight siloxanes in indoor
air (in homes, offices, and supermarkets) reported from Italy and the UK
(18 to 240 μg m−3 for Italy and from 78 to 350 μg m−3 for the UK) (Pieri
et al., 2013). Companioni-Damas et al. (2014) reported D5 concentrations as high as 293,000 ng m−3 in homes and 2850 ng m−3 in laboratories in Barcelona, Spain.
3.4. Contribution of D4 and D5 to total siloxane concentrations in indoor air
Among several siloxanes, D4 and D5 were the most widely studied compounds. D4 and D5 were found at the high concentrations
in indoor air from Albany and ranged from 6.19 to 752 ng m− 3 for
D4 (mean: 116 ng m − 3) and from 19 to 5130 ng m − 3 for D5
(mean: 721 ng m− 3 ). The sum concentrations of D4 and D5
accounted for ≥ 82% of the total of five cyclic siloxanes determined
in our study. Yucuis et al. (2013) reported D4 levels in indoor air
from the Seamans Center for Engineering Arts and Sciences at the
University of Iowa (23 to 500 ng m− 3); these values are similar to
what was found in indoor air from Albany. The D5 concentrations
at a Swedish rural site ranged from 0.7 to 8 ng m− 3 (Kierkegaard
and McLachlan, 2010), which were much lower than the concentrations found in our study.
The ratios of D5 to D4 concentrations have been used in the determination of sources of cyclic siloxanes in the environment (Navea et al.,
2011; Yucuis et al., 2013). The D5/D4 ratios in indoor air from Albany
were 7.86, 5.68, 1.90, 6.56, 6.45, and 5.73 for homes, offices, laboratories,
schools, hair salons, and public places, respectively. The D5/D4 ratios in
indoor air were similar among the five categories of sampling locations,
except for the laboratory locations, which had the lowest values (1.90).
High D5/D4 ratios in indoor environments suggest the existence of
point sources of cyclic siloxanes. Personal care and household products
are the sources of siloxanes in indoor air. The mean concentrations of D5
in personal care products were much higher than those of D4
(2890 μg g−1 for D5 and 141 μg g−1 for D4) (Horii and Kannan, 2008).
For the entire sample set of 60 indoor air samples, the ratio of D5/D4
was 6.21. The D5/D4 ratios were reported to range from 2.6 to 4.4 for indoor air samples in three types of commercial buildings in the USA
(Shields et al., 1996). A recent study reported that the D5/D4 ratios averaged 91 and 3.2 for indoor and outdoor air, respectively (Yucuis et al.,
2013).
–
1040
–
–
510
–
–
249
–
–
1240
–
–
6210
–
–
1990
–
–
1470
–
Total
n = 60
Public places
n=8
Salons
n=6
Schools
n=6
Laboratories
n = 13
Offices
n=7
n.d.: not detectable. freq. %: frequency of siloxanes detectable in indoor air. “b”: below the limit of quantification of the method. Σ Sil.: the total concentrations of all siloxanes D3–D7 and L3–L11
L11
n.d.
n.d.
–
n.d.
n.d.
–
n.d.
n.d.
–
n.d.
n.d.
–
n.d.–38.1
19
83.3
n.d.
n.d.
–
n.d.–38.1
2.44
8.33
n.d.–58.7
12.4
75
n.d.–6.57
b2.22
14.3
n.d.–14.4
b2.22
7.69
n.d.–38.6
9.88
50
19.2–576
167
100
n.d.–2.37
b2.22
25
n.d.–576
22.5
46.7
L10
2.8–513
94.7
100
3.72–256
89.1
100
n.d.–13.6
3.77
69.2
4.94–170
88.1
100
194–792
520
100
b0.83–385
175
100
n.d.–792
127
95
L9
L8
6.48–442
145
100
n.d.–266
74.7
71.4
n.d.–140
14
61.5
6.85–440
168
100
282–1090
709
100
3.25–80
41.1
100
n.d.–1090
153
98.3
L7
L6
n.d.–379
56
85
n.d.–53.8
16.2
42.9
n.d.–93.5
13.2
46.2
2.1–65
25.7
100
41–235
147
100
23–426
166
100
n.d.–426
62.7
80
n.d.–133
17.7
80
n.d.–103
18.4
57.1
0.1–84.2
13.4
53.9
n.d.–11.5
4.14
66.7
5.1–41.3
22.7
100
b0.56–33
12.9
100
n.d.–133
15.4
81.7
L5
L4
n.d.–12.1
1.33
35
n.d.–1.86
b0.83
28.6
n.d.–3.78
b0.83
30.8
n.d.–2.64
1.22
66.7
n.d.–11.1
4.96
83.3
n.d.–5.79
b0.83
37.5
n.d.–12.1
1.41
51.7
n.d.–5.72
1.54
75
n.d.–2.69
b0.83
71.4
n.d.–54
7.72
92.3
n.d.
n.d.
–
n.d.–2.75
1.0
83.3
b0.83–3.1
b0.83
100
b0.83–54
2.5
75
L3
D7
12.5–197
52.9
100
8.16–143
55.5
100
3.1–71.2
17.8
100
20.8–73.8
46.6
100
20.7–92.2
48.4
100
5.92–144
73.8
100
3.1–197
47.3
100
14.9–311
75.4
100
13.6–122
50.8
100
5.73–121
28.9
100
34.7–196
107
100
160–1040
444
100
6.26–297
151
100
5.73–1040
113
100
D6
D5
40.4–1840
446
100
39–428
150
100
19–170
87.6
100
197–1770
649
100
530–5130
3200
100
251–2470
1140
100
19–5130
721
100
8.4–216
56.7
100
6.19–82.6
26.5
100
7.29–89.1
38
100
20–29
98.9
100
206–752
495
100
35.4–505
199
100
6.19–752
116
100
D4
D3
5.07–70.5
24.6
100
5.88–17.2
12.2
100
5.20–74.2
20.4
100
7.6–25.1
15.9
100
8.44–19.2
13
100
13.1–43.6
22.6
100
5.07–74.2
20
100
Range
Mean
Freq. %
Range
Mean
freq. %
Range
Mean
Freq. %
Range
Mean
Freq. %
Range
Mean
Freq. %
Range
Mean
Freq. %
Range
Mean
Freq. %
Homes
n = 20
Table 4
Total concentration of cyclic and linear siloxanes in bulk indoor air (ng m−3) (sum of particulate and vapor phases) from Albany, New York, USA.
143
0.4–299
57.7
100
n.d.-28.2
12.6
71.4
n.d.–3.99
b1.94
23.1
n.d.–104
28
66.7
50.2–869
420
100
b1.94–7.9
3.55
100
n.d.–869
66.2
78.3
Σ Sil.
T.M. Tran, K. Kannan / Science of the Total Environment 511 (2015) 138–144
Fig. 2. Mean concentrations of total siloxanes (vapor plus particulate phases) in indoor air
samples from six categories of sampling locations in Albany, New York, USA.
3.5. Human exposure to siloxanes via inhalation
On the basis of the average inhalation rate of 13 m3 day−1 (CEPA,
1994; Pieri et al., 2013), we calculated the inhalation exposure to siloxanes by multiplying the measured concentration (ng m−3) with the volume of air inhaled (m3). The results showed that the mean value of
exposure of total siloxanes from homes, offices, laboratories, schools, salons, and public places were 13,500, 6630, 3230, 16,200, 80,700, and
25,900 ng day−1, respectively. The inhalation exposure dose for people
in salons was the highest (80,700 ng day−1). The mean daily exposure
to total siloxanes from all locations was 19,100 ng day−1. Among several siloxanes measured, D5 exposure was the highest and ranged from
247 to 66,700 ng day−1 (mean: 9370 ng day−1). The average inhalation
exposure doses for L8, L7, D4, and D6 were 1990, 1650, 1510, and
1470 ng day−1, respectively.
No previous studies have reported human exposure doses of siloxanes by age. Because the average body weights vary with age, infants
(b1 yr): 6 kg-bw, toddlers (1–3 yr): 12 kg-bw, children (3–11 yr): 25
kg-bw, teenagers (11–18 yr): 57 kg-bw, and adults: 72 kg-bw (U.S. Environmental Protection Agency Child-Specific Exposure Factors Handbook, 2008), the calculated exposure doses of total siloxanes for
infants, toddlers, children, teenagers, and adults were 3.18, 1.59, 0.76,
0.34, and 0.27 μg/kg-bw/day, respectively. D5 contributed to the highest
daily exposures, with 1.56, 0.78, 0.37, 0.16, and 0.13 μg/kg-bw/day for
infants, toddlers, children, teenagers, and adults, respectively. It is
worth to note that our exposure doses are approximate values as
these are based on average concentrations found in various microenvironments. Furthermore, a study by Utell et al. (1998) reported that only
12% of the inhaled D4 dose was absorbed in systemic circulation and
such information may be taken into account when calculating actual exposure doses. However, high doses of inhalation exposure to D4 used in
that study may underestimate absorbed fraction of D4.
Jovanovic et al. (2008) reported that the dermal exposure to cyclic
siloxanes present in lotions and antiperspirants in the United States
was 0.1 and 0.2 mg day−1, respectively; siloxane exposure doses from
indoor air calculated in our study were similar to the exposure doses
calculated from skin lotions and antiperspirants. Nevertheless, based
on a comprehensive analysis of a wide range of personal care products,
Horii and Kannan (2008) showed that the daily exposure rate to total siloxanes from personal care products (inhalation, ingestion, and dermal
absorption pathways) was 307 mg day−1 for the United States women
and D5 contributed 162 mg day−1. The inhalation exposure doses of siloxanes calculated in our study were lower than the values reported in
144
T.M. Tran, K. Kannan / Science of the Total Environment 511 (2015) 138–144
the UK (Pieri et al., 2013); the reported siloxane exposure doses for children and adults in the UK were 3.19 and 1.88 mg day−1, respectively.
4. Conclusions
Five cyclic and nine linear siloxanes were determined in 60 indoor
air samples from Albany, New York, USA; most siloxanes were found
in almost all indoor air samples, and D3, D4, D5, and D6 were found in
all samples. Indoor air from hair salons contained the highest concentrations of siloxanes (mean: 6210 ng.m−3). D5 was the most abundant
compound in indoor air samples (mean: 721 ng.m−3). High molecular
weight siloxanes (L7, L8, and L9) existed predominantly in the particulate phases than in the vapor phases. The estimated average inhalation
exposure dose to total siloxanes in indoor air was 19,100 ng day−1.
Acknowledgments
We thank Anthony M. DeJulio for the help with sampling.
Appendix A. Supplementary data
Supplementary data to this article can be found online at http://dx.
doi.org/10.1016/j.scitotenv.2014.12.022.
References
Badjagbo, K., Furtos, A., Alaee, M., Moore, S., Sauvé, S., 2009. Direct analysis of volatile
methylsiloxanes in gaseous matrixes using atmospheric pressure chemical ionization–tandem mass spectrometry. Anal. Chem. 81, 7288–7293.
Badjagbo, K., Héroux, M., Alaee, M., Moore, S., Sauvé, S., 2010. Quantitative analysis of volatile methylsiloxanes in waste-to-energy landfill biogases using direct APCI–MS/MS.
Environ. Sci. Technol. 44, 600–605.
Blanchard, O., Glorennec, P., Mercier, F., Bonvallot, N., Chevrier, C., Ramalho, O., Mandin, C.,
Bot, B.L., 2014. Semi-volatile organic compounds in indoor air and settled dust in 30
French dwelling. Environ. Sci. Technol. 48 (7), 3959–3969.
Bletsou, A.A., Asimakopoulos, A.G., Stasinakis, A.S., Thomaidis, N.S., Kannan, K., 2013. Mass
loading and fate of linear and cyclic siloxanes in a wastewater treatment plant in
Greece. Environ. Sci. Technol. 47, 1824–1832.
Brooke, D.N., Crookes, M.J., Gray, D., Robertson, D., 2009. Environmental Risk Assessment
Report: Decamethylcyclopentasiloxane. Environmental Agency of England and
Wales, Bristol, UK, Britol.
Burns-Naas, L.A., Mast, R.W., Klykken, P.C., McCay, J.A., White, K.L., Mann, P.C., Naas, D.J.,
1998. Toxicology and humoral immunity assessment of decamethylcyclopentasiloxane
(D5) following a 1-month whole body inhalation exposure in Fischer 344 rats. Toxicol.
Sci. 43, 28–38.
CEPA (California Environmental Protection Agency), 1994. How much air do we breathe?
Brief report to the scientific and technical community. Available:. .
gov/research/resnotes/notes/94-11.htm.
Companioni-Damas, E.Y., Santos, E.J., Galceran, M.T., 2014. Linear and cyclic
methylsiloxanes in air by concurrent solvent recondensation-large volume injection–gas chromatography–mass spectrometry. Talanta 118, 245–252.
Cortada, C., Reis, L.C., Vidal, L., Llorca, J., Canals, A., 2014. Determination of cyclic and linear
siloxanes in wastewater samples by ultrasound-assisted dispersive liquid–liquid
microextraction followed by gas chromatography–mass spectrometry. Talanta 120,
191–197.
Environment Agency, German, 2011. Indoor air guide values for cyclic dimethylsiloxanes.
Bundesgesundheitsblatt 54, 388–400. />Environment Canada, Health Canada, 2008. Screening Assessment for The, Challenge,
Decamethylcyclopentasiloxane (D5). available from:, />asp?lang=En&n=13CC261E-5FB0-4D33-8000 (accessed Nov 2014).
He, B., Rhoders-Brower, S., Miller, M.R., Munson, A.E., Germolec, D.R., Walker, V.R., Korach,
K.S., Meade, B.J., 2003. Octamethylcyclotetrasiloxane exhibits estrogenic activity in
mice via Erα. Toxicol. Appl. Pharmacol. 192, 254–261.
Horii, Y., Kannan, K., 2008. Survey of organosiloxane compounds, including cyclic and linear siloxanes, in personal-care and household products. Arch. Environ. Contam.
Toxicol. 55, 701–710.
Jovanovic, M.L., McMahon, J.M., McNett, D.A., Tobin, J.M., Plotzke, K.P., 2008. In vitro and
in vivo percutaneous absorption of 14C-octamethylcyclotetrasiloxane (14C-D4) and
14
C-decamethylcyclopentasiloxane (14C-D5). Regul. Toxicol. Pharmacol. 50, 239–248.
Kaj, L., Schlabach, M., Andersson, J., Cousins, A.P., Schmidbauer, N., Brorstrom-Lunden, E.,
2005. Siloxanes in the Nordic Environment. TemaNord, Nordic Council of Ministers,
Copenhagen.
Kawamura, Y., Nakajima, A., Mutsuga, M., Yamada, T., Maitani, T., 2001. Residual chemical
in silicone rubber products for food contact use. Shokuhin Eiseigaku Zasshi 42,
316–321 (Japanese).
Kierkegaard, A., McLachlan, M.S., 2010. Determination of decamethylcyclopentasiloxane
in air using commercial solid phase extraction cartridges. J. Chromatogr. A 1217,
3557–3560.
Latimer, H.K., Kamens, R.M., Chandra, G., 1998. The atmospheric partitioning of
decamethylcyclopentasiloxane (D5) and 1-hydroxynonamethylcyclopentasiloxane
(D4TOH) on different types of atmospheric particles. Chemosphere 36, 2401–2414.
Lee, S., Moon, H.B., Song, G.J., Ra, K., Kannan, K., 2014. A nationwide survey and emission
estimates of cyclic and linear siloxanes through sludge from wastewater treatment
plants in Korea. Sci. Total Environ. 497–498, 106–112.
Lu, Y., Yuan, T., Yun, S.H., Wang, W., Wu, Q., Kannan, K., 2010. Occurrence of cyclic and linear siloxanes in indoor dust from China, and implications for human exposures. Environ. Sci. Technol. 44, 6081–6087.
McKim, J.M., Wilga, P.C., Breslin, W.J., Plotzke, K.P., Gallavan, R.H., Meeks, R.G., 2001. Potential estrogenic and antiestrogenic activity of the cyclic siloxane octamethylcyclotetrasiloxane (D4) and the linear siloxane hexamethylsiloxane (HMDS) in
immature rats using the uterotrophic assay. Toxicol. Sci. 63, 37–46.
Meeks, R.G., Stump, D.G., Siddiqui, W.H., Holson, J.F., Plotzke, K.P., Reynolds, V.L., 2007. An
inhalation reproductive toxicity study of octamethylcyclotetrasiloxane (D4) in female
rats using multiple and single day exposure regimens. Reprod. Toxicol. 23, 192–201.
Navea, J.G., Young, M.A., Xu, S.H., Grassian, V.H., Stanier, C.O., 2011. The atmospheric lifetimes and concentrations of cyclic methylsiloxanes octamethylcyclotetrasiloxanes
(D4) and decamethylcyclopentasiloxane (D5) and the influence of heterogeneous
uptake. Atmos. Environ. 45, 3181–3191.
Ortega, R.D., Subrenat, A., 2009. Siloxane treatment by adsorption into porous materials.
Environ. Technol. 30 (10), 1073–1083.
Pieri, F., Katsoyiannis, A., Martellini, T., Hughes, D., Jones, K.C., Cincinelli, A., 2013. Occurrence of linear and cyclic volatile methyl siloxanes in indoor air samples (UK and
Italy) and their isotopic characterization. Environ. Int. 59, 363–371.
Quinn, A.L., Dalu, A., Meeker, L.S., Jean, P.A., Meeks, R.G., Crissman, J.W., Gallavan, R.H.,
Plotzke, K.P., 2007a. Effects of octamethylcyclotetrasiloxane (D4) on the luteinizing
hormone (LH) surge and levels of various reproductive hormones on female
Sprague–Dawley rats. Reprod. Toxicol. 23, 532–540.
Quinn, A.L., Regan, J.M., Tobin, J.M., Marinik, B.J., McMahon, J.M., McNett, D.A., Sushynski,
C.M., Crofoot, S.D., Jean, P.A., Plotzke, K.P., 2007b. In vitro and in vivo evaluation of the
estrogenic, androgenic, and progestagenic potential of two cyclic siloxanes. Toxicol.
Sci. 96 (1), 145–153.
Sánchez-Brunete, C., Miguel, E., Albero, B., Tadeo, J.L., 2010. Determination of cyclic and
linear siloxanes in soil samples by ultrasonic-assisted extraction and gas chromatography–mass spectrometry. J. Chromatogr. A 1217, 7024–7030.
Shields, H.C., Fleischer, D.M., Weschler, C.J., 1996. Comparisons among VOCs measured in
three types of US commercial buildings with different occupant densities. Indoor Air.
Int. J. Indoor Air Qual. Clim. 6, 2–17.
U.S. EPA (U.S. Environmental Protection Agency), 2008. Child-Specific Exposure Factors
Handbook (final report). Available:. />cfm?deid=199243.
Utell, M.J., Gelein, R., Yu, C.P., Kenaga, C., Geigel, E., Torres, A., Chalupa, D., Gibb, F.R.,
Speers, D.M., Mast, R.W., Morrow, P.E., 1998. Quantitative exposure of humans to
an octamethylcyclotetrasiloxane (D4) vapor. Toxicol. Sci. 44, 206–213.
Wang, X.M., Lee, S.C., Sheng, G.Y., Chan, L.Y., Fu, F.M., Li, X.D., Min, Y.S., Chan, C.Y., 2001.
Cyclic organosilicon compounds in ambient air in Guangzhou, Macau and Nanhai,
Pearl River Delta. Appl. Geochem. 16, 1447–1454.
Wang, R., Moody, R.P., Koniecki, D., Zhu, J., 2009. Low molecular weight cyclic volatile
methylsiloxanes in cosmetic products sold on Canada: implication for dermal exposure. Environ. Int. 35, 900–904.
Wang, D.G., Norwood, W., Alaee, M., Byer, J.D., Brimble, S., 2013a. Review of recent advances in research on the toxicity, detection, occurrence and fate of cyclic volatile
methyl siloxanes in the environment. Chemosphere 93, 711–725.
Wang, D.G., Steer, H., Tait, T., Williams, Z., Pacepavicius, G., Young, T., Ng, T., Smyth, S.A.,
Kinsman, L., Alaee, M., 2013b. Concentration of cyclic volatile methylsiloxanes in biosolid amended soil, influent, effluent, receiving water, and sediment of wastewater
treatment plants in Canada. Chemosphere 93, 766–773.
Warner, N.A., Evenset, A., Christensen, G., Gabrielsen, G.W., Borga, K., Leknes, H., 2010.
Volatile siloxanes in the European arctic: assessment of sources and spatial distribution. Environ. Sci. Technol. 44, 7705–7710.
Yucuis, R.A., Stanier, C.O., Hornbuckle, K.C., 2013. Cyclic siloxanes in air, including identification of high level in Chicago and distinct diurnal variation. Chemosphere 92 (8),
905–910.
Zhang, Z., Qi, H., Ren, N., Li, Y., Gao, D., Kannan, K., 2011. Survey of cyclic and linear siloxanes in sediment from Songhua river and in sewage sludge from wastewater treatment plants, Northeastern China. Arch. Environ. Contam. Toxicol. 60, 204–211.