DSpace at VNU: Uptake of metals and metalloids by plants growing in a lead-zinc mine area, Northern Vietnam
Bạn đang xem bản rút gọn của tài liệu. Xem và tải ngay bản đầy đủ của tài liệu tại đây (622.19 KB, 8 trang )
Journal of Hazardous Materials 186 (2011) 1384–1391
Contents lists available at ScienceDirect
Journal of Hazardous Materials
journal homepage: www.elsevier.com/locate/jhazmat
Uptake of metals and metalloids by plants growing in a lead–zinc mine area,
Northern Vietnam
Nguyen Thi Hoang Ha a , Masayuki Sakakibara a,∗ , Sakae Sano b , Mai Trong Nhuan c
a
b
c
Graduate School of Science and Engineering, Ehime University, Matsuyama 790-8577, Japan
Department of Geology, Ehime University, Matsuyama 790-8577, Japan
Department of Environmental Geology, Vietnam National University, Hanoi, 334 Nguyen Trai, Hanoi, Vietnam
a r t i c l e
i n f o
Article history:
Received 29 July 2010
Received in revised form 14 October 2010
Accepted 6 December 2010
Available online 14 December 2010
Keywords:
Metals
Northern Vietnam
Phytoremediation
Phytomining
Plants
a b s t r a c t
This study was conducted to evaluate the phytoremediation and phytomining potential of 10 plant species
growing naturally at one of the largest lead–zinc mines in Northern Vietnam. Total concentrations of
heavy metals and arsenic were determined in the plant and in associated soil and water in and outside of
the mine area. The results indicate that hyperaccumulation levels (mg kg−1 dry weight) were obtained in
Houttuynia cordata Thunb. (1140) and Pteris vittata L. (3750) for arsenic, and in Ageratum houstonianum
Mill. (1130), Potamogeton oxyphyllus Miq. (4210), and P. vittata (1020) for lead. To the best of our knowledge, the present paper is the first report on metal accumulation and hyperaccumulation by H. cordata,
A. houstonianum, and P. oxyphyllus. Based on the obtained concentrations of metals, bioconcentration
and translocation factors, as well as the biomass of these plants, the two latter species and P. vittata are
good candidates for phytoremediation of sites contaminated with arsenic and multi-metals. None of the
collected plants was suitable for phytomining, given their low concentrations of useful metals (e.g., silver,
gallium, and indium).
© 2010 Elsevier B.V. All rights reserved.
1. Introduction
Mining activities generate a large amount of tailings that are
generally deposited upon the ground surface [1]. Tailings usually
provide an unfavorable substrate for plant growth because of their
low pH, high concentrations of toxic metals, and low nutrient content [2].
At the present study site, one of the largest Pb–Zn mines in
Northern Vietnam, mining activity started in the 18th century and
has continued until the present. Long-term mining operations have
generated considerable amounts of sulfide-rich waste materials
that have been released directly to the surrounding area without
treatment. As a result, soil and water are contaminated with heavy
metals and As. Of particular concern, water from the main stream
in the study area is directly used for irrigation and domestic supply
by rural communities located around the mine [3]. This problem
gives rise to the need to remediate the mine tailings and drainage
contaminated with heavy metals and As.
Soil remediation is primarily accomplished by the physical removal of soils from contaminated sites for landfilling,
incineration, or in situ stabilization by chemical treatment [4].
∗ Corresponding author at: Bunkyo-cho 2-5, Matsuyama 790-8577, Japan.
Tel.: +81 89 927 9649; fax: +81 89 927 9640.
E-mail address: (M. Sakakibara).
0304-3894/$ – see front matter © 2010 Elsevier B.V. All rights reserved.
doi:10.1016/j.jhazmat.2010.12.020
These technologies are generally costly and in many cases result
in significant secondary damage to the environment [4]. In
contrast, phytoremediation is considered a cost-effective and
environment-friendly technology for the treatment of soils and
water contaminated by heavy metals/metalloids [5–7]. Criteria
related to the concentration of metals in plant shoots are used to
identify those plants with the greatest potential in phytoremediation [8]. Hyperaccumulators are defined as plants with leaves able
to accumulate at least 100 mg kg−1 of Cd; 1000 mg kg−1 of As, Cu,
Pb, Ni, Co, Se, or Cr; or 10,000 mg kg−1 of Mn or Zn (dry weight)
when grown in a metal-rich environment [9,10].
Phytomining has also emerged as an environment-friendly technology to allow economic exploitation of low-grade surface ores or
mineralized soils that are too metal-poor for conventional mining [11,12]. The use of plant species for both phytoremediation
and phytomining appears to be a sustainable approach that would
ensure the commercialization of these technologies.
It is important to use native plants for phytoremediation
because such plants respond better to the stress conditions at the
site than would plants introduced from other environments [13].
Previous studies have investigated the concentrations of heavy
metals/metalloids in natural vegetation in and around mining
areas, as well as the possible use of such plants for phytoremediation [13–19]. However, few studies have evaluated accumulation of
useful metals (e.g., In, Ag, and Ga) in plants and the possible use of
these plants for the combined phytoremediation and phytomining.
N.T.H. Ha et al. / Journal of Hazardous Materials 186 (2011) 1384–1391
The objectives of this research are to (1) determine the concentrations of multiple heavy metals and As in plant species growing
on a contaminated site, and (2) assess the feasibility of using these
plants for phytoremediation and phytomining.
2. Materials and methods
2.1. Sampling
Plant samples, together with associated soil and water samples
in and outside of the mine area, mine drainage, and along the main
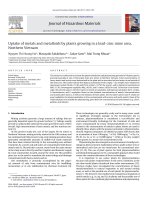
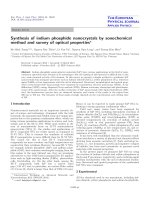
stream, were collected in March and November of 2009 (Fig. 1). The
plants were sampled based on their coverage at the site. A total of
168 plant samples of 10 plant species were collected and identified
from seven sites in the mine area and at one site outside of the mine
for comparison (Table 1; Fig. 1). The plant species collected were
Ageratum houstonianum Mill. (Asteraceae), Commelina communis L.
(Commelinaceae), Diplazium esculenta (Retz.) Sw. (Aspleniaceae),
Equisetum diffusum D. Don (Equisetaceae), Houttuynia cordata
Thunb. (Saururaceae), Kyllingia nemoralis (Cyperaceae), Leersia
hexandra Sw. (Poaceae), Potamogeton oxyphyllus Miq. (Potamogetonaceae), Pteris vittata L. (Pteridaceae), and Selaginella delicatula
(Desv.) Alst (Selaginelaceae) (Table 1).
2.2. Analytical methods
Soil samples were dried at 80 ◦ C for 3 days, ground to a fine
size, and homogenized for analysis by X-ray fluorescence (Epsilon
1385
Table 1
Family, species composition, and number of plant samples in and outside of the
mine area.
Code name
Family
Species
n
Age
Com
Dip
Equ
Hou
Kyl
Lee
Pot
Pte
Sel
Asteraceae
Commelinaceae
Aspleniaceae
Equisetaceae
Saururaceae
Cyperaceae
Poaceae
Potamogetonaceae
Pteridaceae
Selaginelaceae
Ageratum houstonianum Mill.
Commelina communis L.
Diplazium esculenta (Retz.) Sw.
Equisetum diffusum D. Don
Houttuynia cordata Thunb.
Kyllingia nemoralis
Leersia hexandra Sw.
Potamogeton oxyphyllus Miq.
Pteris vittata L.
Selaginella delicatula (Desv.) Alst
12
15
15
15
18
9
3
12
63
6
5) at Ehime University, Japan, to determine the concentrations of
elements in the soil.
Plant samples were separated into roots and shoots, and thoroughly rinsed with deionized water using an ultrasonic cleaner to
remove soil particles attached to the plant surfaces. After rinsing,
the samples were dried in a ventilated oven at 80 ◦ C for 2 days.
The dried samples were ground into fine powder using a mortar
mill. Plant samples (20 mg per each) were digested with mixture
(H2 O2 :HF:HNO3 = 2:5:10) for inductively coupled plasma–mass
spectrometer (ICP–MS) analysis. Elemental analyses of plant and
water samples were performed by ICP–MS (Varian 820-MS) at the
Integrated Center for Sciences, Ehime University, Japan.
Reagent blanks and internal standards were used where
appropriate to ensure accuracy and precision in the ICP–MS anal-
Fig. 1. Map showing the location of the sampling sites. Unc: uncontaminated site.
76.5 (62.5–84.1)
3470 (1420–6240)
153 (141–165)
47.9 (7.52–76.9)
468*** (124–1050)
4590*** (846–10300)
1280*** (307–2560)
106*** (41.5–240)
28.8*** (1.67–38.2)
13.5*** (2.25–24.9)
30700*** (16900–77900)
n.d.
73300*** (71200–74800)
848 (802–894)
n.d.
715*** (705–723)
82100*** (79300–84700)
9290*** (8780–9670)
186*** (175–196)
269*** (257–284)
96.7*** (94.6–101)
91800*** (89100–94300)
Differentiations between concentrations of each element in the soil at contaminated and uncontaminated sites are significant.
a
Element.
b
Uncontaminated site.
c
Not determined.
*
p < 0.05.
**
p < 0.01.
***
p < 0.001.
49.9 (46.8–52.5)
1820 (1780–1880)
81.2 (79.3–83.1)
51.2 (47.1–55.6)
114 (110–118)
1260*** (1230–1290)
309*** (290–319)
15.3 (9.31–18.8)
4.47 (3.93–5.06)
7.42*** (6.00–9.90)
3350*** (3210–3450)
48.2 (25.0–74.3)
24200*** (2630–51500)
331 (305–357)
48.4 (38.7–57.8)
149** (65.8–242)
3810*** (1490–7780)
12600*** (2490–35900)
7.52 (5.02–10.0)
18.2*** (5.71–37.4)
3.30*** (1.37–5.29)
2630*** (2190–3540)
5
4
3
**
2
c
1
Analyses of soil samples revealed very high concentrations of
Pb, As, Zn, Mn, and Cd (Table 2). Concentrations of Pb, As, and Zn in
all samples from the mine site were significantly higher than those
in the sample from outside of the mine site (p < 0.001) (Table 2). The
highest concentrations (mg kg−1 ) of Pb, Zn, Mn, Co, Cd, and In were
94,300, 84,700, 74,800, 894, 284, and 101, respectively, as obtained
in a sample collected from site 1; the highest concentrations of As,
Cu, Ag, Cr, and Ni were 35,900 (site 5), 1050 (site 7), 240 (site 7),
135 (site 2), and 55.6 mg kg−1 (site 6), respectively (Table 2). All the
concentrations of Cu, Zn, As, Cd, and Pb in soil samples collected
from the mine site exceeded Vietnamese standard limits for industrial soil, which are 100, 300, 12, 10, and 300 mg kg−1 , respectively
[23]. The highest concentrations of As, Pb, Zn, Cd, and Cu in soil
were higher than the maximum allowable limits of heavy metals
in industrial soil by factors of 2990, 314, 282, 28, and 11, respectively [23]. The concentrations of heavy metals and As in the soil
samples were correlated, with r(41) = 0.34–0.81 (p < 0.05) for Mn,
0.51–0.91 (p < 0.001) for Cu, 0.66–0.93 (p < 0.001) for Zn, 0.35–0.81
(p < 0.05) for As, 0.34–0.84 (p < 0.05) for Ag, 0.45–0.84 (p < 0.01) for
Cd, 0.39–0.89 (p < 0.01) for In, and 0.54–0.91 (p < 0.001) for Pb. This
finding may indicate that all these metals and As were derived from
similar sources [13].
Whereas the soil was mainly contaminated by Pb, As, Zn, Mn,
and Cd, the water environment in the study area was contaminated
by Mn, As, and Pb, with concentrations exceeding WHO standards
for drinking water by factors ranging from 2 to 90 (Table 3). The
highest concentrations of Mn, Pb, Zn, As, Cu, Ni, and Cd from
mine drainage water were 1920, 566, 134, 93.5, 4.77, 3.78, and
Sites
3.1. Concentrations of heavy metals and As in soil and water
Elea
3. Results and discussion
Table 2
Mean (range) concentrations (mg kg−1 ) of heavy metals and As in the soil in and outside of the mine area (n = 3–15).
Statistical analyses of experimental data were performed using
the SPSS 15.0 package for Windows. All data were tested for goodness of fit to a normal distribution, using a Kolmogorov–Smirnow
one-sample test. Data were log transformed where necessary to
achieve homogeneity of variance. Student’s t tests were used to
detect significant differences in plant concentrations of heavy metals and As between samples collected in March and November
2009, and between plant roots and shoots. Evaluation of significant
differences among means was performed using one-way ANOVA
followed by Tukey’s post-hoc test, with p < 0.05 indicating statistical significance. Pearson product moment correlation coefficients
(r) were used to express the associations of quantitative variables.
6
2.4. Statistical analysis
31.4 (26.6–34.3)
14300** (14100–14500)
301 (259–343)
33.7 (31.3–36.5)
210** (202–216)
6650*** (6560–6680)
10900*** (10800–11000)
22.5* (18.8–26.2)
28.8*** (28.6–29.9)
10.6*** (9.75–11.4)
6650*** (6570–6710)
7
The bioconcentration factor for soil (BCFs) is defined as the ratio
of metal concentration in shoots to that in the soil [10,20]. The bioconcentration factor for water (BCFw) is defined as the ratio of the
total concentration of the element in the whole plant to that in the
growing solution [21].
The translocation factor (TF), which indicates the effectiveness
of a plant in translocation, is defined as the ratio of element concentrations in the shoots to that in the roots [22].
45.2 (36.7–52.7)
5600 (5430–5930)
n.d.
33.3 (27.4–39.1)
252** (244–265)
7070*** (6860–7460)
5830*** (5580–6180)
22.5* (21.8–23.9)
39.0*** (37.9–41.1)
14.4*** (13.6–15.8)
7600*** (7260–8030)
2.3. Bioconcentration and translocation factors
117 (102–135)
9320** (5230–13800)
n.d.
26.9 (24.6–30.8)
493*** (195–811)
3220*** (1840–4730)
11100*** (8900–13300)
33.8*** (22.3–48.9)
11.8*** (8.23–15.2)
12.9*** (9.42–16.9)
15000*** (10300–19800)
Uncb
yses of elements. Certified reference materials NIES CRM No. 1
(National Institute for Environmental Studies, Japan) and SRM
1643e (National Institute of Standards Technology, U.S.A.) were
used for quality control of the analytical procedure employed for
plant and water samples, respectively, and the recoveries of heavy
metals and As were 91–101%.
64.8 (59.8–70.2)
1030 (917–1310)
n.d.
33.6 (24.1–44.6)
40.9 (33.6–47.4)
89.5 (79.7–109)
4.69 (4.43–5.39)
3.08 (2.08–4.79)
1.03 (0.97–1.12)
0.85 (0.51–1.45)
83.1 (58.4–123)
N.T.H. Ha et al. / Journal of Hazardous Materials 186 (2011) 1384–1391
Cr
Mn
Co
Ni
Cu
Zn
As
Ag
Cd
In
Pb
1386
N.T.H. Ha et al. / Journal of Hazardous Materials 186 (2011) 1384–1391
1387
Table 3
Concentrations (g l−1 ) of heavy metals and As in the water from mine drainages and stream.
Element
Sites
2
Cr
Mn
Co
Ni
Cu
Zn
Ga
As
Ag
Cd
In
Pb
3.21
1920
0.47
3.15
4.77
134
0.10
13.7
0.09
1.01
0.03
566
3
±
±
±
±
±
±
±
±
±
±
±
±
1.37a
113***
0.26
1.42***
1.47**
30**
0.04
9.1***
0.01
0.20**
0.01
351***
2.06
1460
0.45
3.78
1.71
134
0.06
12.3
0.05
0.47
0.04
3.09
4
±
±
±
±
±
±
±
±
±
±
±
±
0.09
95***
0.09
0.28***
0.13
20**
0.01
1.1***
0.01
0.15
0.01
0.85
4.32
75.7
0.22
2.30
6.77
9.20
0.16
93.5
0.50
0.04
0.02
0.24
5
±
±
±
±
±
±
±
±
±
±
±
±
0.55
7.4*
0.03
0.04***
5.51
0.69
0.02
10.1***
0.77
0.01*
0.01
0.04
3.51
346
0.75
2.17
0.94
7.50
0.03
80.2
0.04
0.02
0.02
0.19
6
±
±
±
±
±
±
±
±
±
±
±
±
1.08
216*
0.77
0.30***
0.69
5.30
0.02***
25.8***
0.01**
0.01***
0.01
0.17
3.68
0.69
0.16
1.59
0.87
16.2
0.03
21.3
0.10
0.11
0.04
4.58
Uncb
7
±
±
±
±
±
±
±
±
±
±
±
±
1.67
0.14
0.07
0.39**
0.29
14.5
0.04**
12.7***
0.15*
0.08*
0.01
7.14*
5.18
393
0.96
3.75
1.70
121
0.06
7.73
0.05
0.75
0.03
183
±
±
±
±
±
±
±
±
±
±
±
±
1.56
62
0.01
0.76***
0.07
10*
0.03
0.22***
0.01*
0.01
0.01
23***
3.55
0.76
0.29
0.56
1.47
1.65
0.25
0.88
0.87
0.27
0.03
0.62
±
±
±
±
±
±
±
±
±
±
±
±
1.80
0.30
0.17
0.48
1.67
0.55
0.17
0.36
1.04
0.16
0.01
0.35
Differentiations between concentrations of each element in the water at contaminated and uncontaminated sites are significant.
a
Means ± standard deviations (n = 3–9).
b
Uncontaminated site.
*
p < 0.05.
**
p < 0.01.
***
p < 0.001.
1.01 g l−1 , respectively, which are significantly higher than concentrations in water from the uncontaminated site (p < 0.01). The
concentrations of Cu, As, and Pb in the soil and water samples were
correlated, with r(45) = 0.68 (p < 0.001), 0.60 (p < 0.001), and 0.48
(p < 0.01), respectively. This finding may indicate that these metals
in water were leached from the associated soils.
3.2. Plant accumulation and transport of heavy metals and As
There were no significant differences (p > 0.05) in metal concentrations in plants collected in March and November 2009 (Student’s
t test); therefore, the results presented here are based on the combined data. High concentrations of heavy metals and As in the soil
and water may result in high levels of these elements in the collected plant samples. The concentrations of all heavy metals and
As varied widely among sites and plant species [24]. The highest
concentrations of heavy metals and As (mg kg−1 dry weight) in the
plant roots were found in P. vittata for Pb (12,700), Zn (6190), Cu
(160), Ag (35.3), and In (5.66); in E. diffusum for Mn (10,100), As
(3660), Co (30.2), and Ga (8.70); in C. communis for Cr (715) and Ni
(191); and in H. cordata for Cd (52.8). The highest concentrations in
the shoots were found in P. oxyphyllus for Mn (5010), Pb (4210), Zn
(1810), Ag (13.5), and Co (8.48); in H. cordata for Cu (87.5) and Ga
(6.75); in L. hexandra for Cr (205) and Ni (81.9); in P. vittata for As
(3750); in A. houstonianum for Cd (20.1); and in S. delicatula for In
(4.28) (Tables 4–6).
Metal concentrations in the plants were poorly correlated with
total metal concentrations in the soil. This result was expected
because total metal concentrations are considered to be poor
indicators of metal availability to plants [15,25]. However, the concentrations of Cu (r = 0.31, p < 0.05, n = 51), Ag (r = 0.49, p < 0.001,
n = 49), and In (r = 0.42, p < 0.01, n = 49) in the plant roots were correlated with those in the soil. The concentrations of Zn (r = 0.70,
p < 0.001, n = 42) and Cd (r = 0.81, p < 0.001, n = 45) in the plant roots
were highly correlated with those in water. Correlations between
the concentrations of heavy metals in the plant shoots and those in
water were also found for Mn (r = 0.38, p < 0.05, n = 45), Zn (r = 0.50,
p < 0.01, n = 42), and Cd (r = 0.31, p < 0.05, n = 45).
Normal and toxic concentrations of heavy metals and As
(mg kg−1 ) are respectively considered to be 0.1–0.5 and 5–30 for
Cr, 20–300 and 300–500 for Mn, 0.02–0.1 and 15–30 for Co, 0.1–5.0
and 10–100 for Ni, 5–30 and 20–100 for Cu, 27–150 and 100–400
for Zn, 1.0–1.7 and 5–20 for As, 0.05–0.2 and 5–30 for Cd, and 5–10
and 30–300 for Pb [25]. Most of the collected plant species showed
concentrations higher than these toxic levels for Cr, Mn, Zn, As, and
Pb, whereas they showed normal levels for Co, Ni, Cu, and Cd. In
addition, all of the plant species were able to adapt very well to
growth in soil that was highly contaminated by As and multiple
heavy metals, especially Pb, Zn, Mn, and Cd (Table 2). These results
may indicate that the plant species growing on the present site,
contaminated by heavy metals and As, are tolerant of these metals.
In the previous study, Yoon et al. [13] reported concentrations
(mg kg−1 ) of undetectable to 1183, 6–460, and 17–598 for Pb, Cu,
and Zn, respectively, in native plants growing on a contaminated
site. MorenoJimenez et al. [15] reported concentrations (mg kg−1 )
of Mn, Cu, Zn, and Cd of 14.9–400.6, 2.68–70.2, 9.5–1048, and
undetectable to 22.04, respectively, in shoots of plants growing in
an area surrounding a mine site. Stoltz and Greger [16] reported
concentrations of Cu, Zn, As, Cd, and Pb of 6.4–160, 68–1630,
0.7–276, 0.1–12.5, and 3.4–920 mg kg−1 , respectively in wetland
plant species growing on submerged mine tailings. Rio et al. [17]
reported concentrations (mg kg−1 ) of Pb, Zn, Cu, Cd, and As of undetectable to 450, 13–1138, 1.2–152, undetectable to 9.7, and 0.8–120,
respectively, in wild vegetation in a river area after a toxic spill at a
mine site. In an analysis of wetland plant species collected from
mine tailings, Deng et al. [18] reported concentrations of up to
11,116, 1249, and 1090 mg kg−1 for Zn, Pb, and Cd, respectively,
in Sedum alfredii growing on tailings at a Pb–Zn mine. Chehregani
et al. [19] reported concentrations (mg kg−1 ) of undetectable to
14.6, 9.60–84.0, 4.00–18.5, 4.00–1485, and 20.0–1987 for Cd, Cu,
Ni, Pb, and Zn, respectively, in shoots and leaves of plants collected
in a waste pool at a Pb–Zn mine. In the present study, the concentrations of Pb, Cu, Zn, As, Cd, Mn, and Ni are higher than those in
the plants reported by Yoon et al. [13], Moreno-Jimenez et al. [15],
Stoltz and Greger [16], Rio et al. [17], Deng et al. [18], and Chehregani et al. [19], but lower than the concentrations of Cu and Cd in
the plants assessed by Stoltz and Greger [16] and Deng et al. [18],
respectively.
3.3. Potential plant species for phytoremediation and
phytomining
An ideal plant for phytoremediation should have the following characteristics: (1) an inherent capacity to hyperaccumulate
and tolerate metals and metalloids in aboveground tissues; (2) a
high and fast-growing biomass and be repulsive to herbivores (to
prevent the escape of accumulated metals and metalloids to the
food chain); (3) BCFs and TF values higher than 1; (4) a widely dis-
1388
Table 4
Mean (range) concentrations of Cr, Mn, Co, and Ni (mg kg−1 dry weight) in plant samples in and outside of the mine area (n = 3–63).
Code name
Mn
Co
Ni
Root
Shoot
Root
Shoot
Root
Shoot
Root
Shoot
25.3 (24.3–27.1)
215 (5.93–715)
69.9* (31.9–109)
21.6 (9.69–55.5)
7.72 (6.01–9.53)
21.7 (13.7–41.4)
112 (111–114)
11.2 (7.23–14.8)
22.9 (4.57–121)
38.8 (36.6–40.4)
46.8** (45.1–54.9)
22.3 (4.91–36.1)
5.67 (4.80–6.86)
63.1* (35.1–105)
9.06 (4.81–17.9)
44.9** (40.0–54.4)
192*** (179–205)
11.5 (6.00–15.3)
12.7 (4.27–67.9)
47.9* (40.4–63.2)
704 (683–739)
1080 (244–2110)
4600** (184–9630)
7800*** (3460–10100)
1560 (339–3060)
1820 (871–4230)
3040*** (2980–3140)
3680 (2930–5740)
1430 (142–1600)
712*** (673–735)
1030 (970–1130)
672 (160–1570)
215 (78.8–434)
580 (189–1540)
672 (224–1310)
1440 (1080–2110)
676 (647–727)
3140 (2190–5010)
227 (76.3–808)
392 (330–430)
0.51 (0.49–0.53)
3.87*** (1.77–7.33)
8.64*** (1.16–17.3)
16.5*** (6.32–30.2)
4.92* (1.68–9.18)
5.86 (2.67–11.2)
10.6*** (10.2–11.2)
6.92 (4.72–8.63)
3.90 (0.81–17.3)
4.67 (4.58–4.78)
0.83 (0.75–0.94)
1.12 (0.53–1.73)
0.61 (0.27–1.37)
1.20 (0.37–1.79)
2.21 (0.30–4.55)
3.12 (0.88–5.06)
2.01 (1.87–2.23)
6.20 (4.25–8.48)
0.61 (0.20–2.54)
4.11 (0.89–7.29)
9.14 (8.52–10.4)
74.3 (1.86–191)
39.9*** (12.0–74.1)
9.56 (4.52–19.2)
3.77 (2.12–4.98)
10.7 (7.57–17.4)
48.0 (44.7–54.4)
11.3 (9.41–13.0)
9.58 (1.25–43.7)
16.9 (15.6–19.2)
12.7* (11.5–14.1)
7.11 (1.62–10.9)
1.82 (1.02–3.48)
21.6 (0.49–35.6)
3.63 (1.02–8.75)
13.9* (9.69–18.4)
72.5* (64.4–81.9)
13.8 (8.24–18.9)
3.65 (0.49–20.8)
15.6 (14.1–19.1)
Differentiations between root and shoot of each element of the same plant species are significant.
*
p < 0.05.
**
p < 0.01.
***
p < 0.001.
Table 5
Mean (range) concentrations of Cu, Zn, Ga, and As (mg kg−1 dry weight) in plant samples in and outside of the mine area (n = 3–63).
Code name
Age
Com
Dip
Equ
Hou
Kyl
Lee
Pot
Pte
Sel
Cu
Zn
Root
Shoot
19.0 (18.7–19.6)
33.0 (25.7–39.1)
32.4*** (28.4–37.8)
56.5*** (36.1–84.6)
51.4* (43.5–79.0)
30.4** (21.6–40.3)
44.6*** (43.1–47.4)
32.3 (20.3–50.6)
76.7 (22.1–160)
32.9** (32.4–33.6)
22.8 (21.8–24.1)
26.3 (14.1–42.7)
12.0 (8.58–15.8)
16.4 (12.7–22.3)
36.8 (14.4–87.5)
18.4 (11.3–26.9)
10.6 (10.3–11.2)
36.4 (20.0–63.1)
13.8 (8.56–28.7)
19.0 (13.9–23.5)
Root
1130 (1110–1180)
448 (341–696)
1220* (530–2050)
986*** (306–2200)
898* (448–2600)
453* (260–819)
844*** (821–889)
877 (612–1450)
1360 (117–6190)
352*** (343–369)
Ga
As
Shoot
Root
Shoot
Root
Shoot
1210 (1200–1220)
289 (158–463)
176 (88.9–268)
139 (61.8–244)
252 (130–498)
239 (172–298)
197 (183–208)
1120 (601–1810)
196 (60.8–951)
250 (229–270)
0.52 (0.37–0.61)
1.84*** (1.50–2.64)
3.11*** (1.51–5.74)
6.43*** (3.36–8.70)
2.97* (1.40–4.51)
2.52* (1.30–3.00)
6.23** (4.92–7.04)
3.92 (1.06–5.51)
3.98 (0.34–7.45)
3.17** (2.13–3.71)
0.89 (0.68–1.28)
1.05 (0.42–1.52)
0.68 (0.29–1.30)
0.82 (0.13–1.19)
2.57 (0.35–6.75)
1.20 (0.72–2.14)
0.36 (0.23–0.58)
3.38 (0.92–5.97)
0.68 (0.21–2.03)
1.36 (0.46–1.91)
162 (145–195)
117 (64.4–204)
82.5* (71.2–104)
2230*** (539–3660)
428 (146–1080)
630 (80.8–1620)
458*** (436–494)
508* (33.8–857)
454 (124–1740)
272*** (255–284)
209 (166–280)
75.8 (13.1–128)
17.2 (9.86–106)
167 (23.4–308)
325 (32.0–1140)
324 (28.9–938)
9.25 (9.08–9.56)
151 (34.7–222)
1750 (627–3750)
57.6 (30.3–82.0)
Hyperaccumulation values are bold. Differentiations between root and shoot of each element of the same plant species are significant.
*
p < 0.05.
**
p < 0.01.
***
p < 0.001.
N.T.H. Ha et al. / Journal of Hazardous Materials 186 (2011) 1384–1391
Age
Com
Dip
Equ
Hou
Kyl
Lee
Pot
Pte
Sel
Cr
1070 (968–1130)
384 (92.2–955)
150 (47.2–261)
234 (19.1–851)
99.4 (81.5–130)
386 (111–700)
111 (106–116)
1710 (489–4210)
296 (49.1–1020)
136 (129–150)
1050 (988–1160)
464 (239–727)
1310** (932–1720)
1590*** (287–4830)
222 (122–270)
556 (275–720)
2880*** (2870–2910)
2260 (490–4620)
2980 (270–12700)
234*** (214–245)
Hyperaccumulation values are bold. Differentiations between root and shoot of each element of the same plant species are significant.
*
p < 0.05.
**
p < 0.01.
***
p < 0.001.
Root
Shoot
0.87 (0.51–1.54)
0.32 (0.06–0.48)
2.13 (1.03–3.19)
0.14 (0.01–0.45)
1.14 (0.07–2.32)
0.56 (0.14–1.69)
0.23 (0.03–0.32)
1.07 (0.26–2.22)
0.98 (0.04–5.14)
3.89 (3.12–4.28)
1.06 (0.27–1.47)
0.28 (0.21–0.44)
0.83 (0.24–1.68)
0.57*** (0.24–1.10)
0.31 (0.10–0.92)
0.33 (0.22–0.74)
1.32* (1.05–1.51)
0.60 (0.12–0.91)
1.59 (0.13–5.66)
0.40 (0.28–0.64)
Root
Shoot
19.0 (11.7–20.1)
1.90 (0.41–3.53)
0.71 (0.50–1.08)
0.70 (0.17–1.31)
4.92 (0.95–13.3)
2.18 (1.68–2.99)
0.56 (0.54–0.59)
10.6** (6.98–14.3)
0.75 (0.20–3.46)
2.04 (0.52–3.50)
12.6 (11.6–14.3)
17.0* (4.53–41.4)
10.9** (8.22–1.47)
6.88*** (1.65–16.6)
16.9 (8.07–52.8)
4.17*** (2.94–5.71)
13.3*** (12.4–14.8)
7.23 (4.42–11.6)
5.36 (0.50–22.2)
2.40*** (2.28–2.64)
Root
3.68 (3.20–4.25)
2.76 (0.87–6.64)
1.34 (0.27–2.22)
0.85 (0.22–2.24)
2.75 (0.42–9.31)
2.26 (0.47–3.80)
0.33 (0.22–0.39)
6.59 (0.82–13.5)
2.48 (0.29–13.3)
3.91 (0.64–7.01)
Shoot
Root
3.58 (3.23–4.22)
4.11 (3.04–6.87)
2.55* (1.45–4.12)
5.40*** (0.88–15.0)
3.26 (0.79–9.32)
3.44 (1.21–7.94)
5.25*** (4.74–5.80)
4.97 (0.80–11.3)
8.43 (0.71–35.3)
1.61 (1.51–1.81)
In
Cd
Ag
Code name
Table 6
Mean (range) concentrations of Ag, Cd, In, and Pb (mg kg−1 dry weight) in plant samples in and outside of the mine area (n = 3–63).
Age
Com
Dip
Equ
Hou
Kyl
Lee
Pot
Pte
Sel
Pb
Shoot
N.T.H. Ha et al. / Journal of Hazardous Materials 186 (2011) 1384–1391
1389
tributed, highly branched root system; (5) easy to cultivate and
with a wide geographic distribution; and (6) relatively easy to harvest [6]. In contrast, phytomining is constrained by the need to
produce a commercially viable metal crop [26]. Whether phytomining can become a reality depends on the price of the target
metal [10]. In other words, the goal of phytoremediation is to clean
contaminated media, whereas that of phytomining is economic
return.
In the present study, the plants had accumulated very low concentrations of Ag, Ga, and In. Considering the present market prices
of these metals [27] and the concentrations of these elements in
the plants analyzed in the present study, none of the plant species
collected from the mine shows potential for phytomining of these
useful metals.
The data presented in this study indicate that hyperaccumulation levels were obtained for H. cordata and P. vittata for As (Table 5),
and for A. houstonianum, P. oxyphyllus, and P. vittata for Pb (Table 6).
To the best of our knowledge, the present study is the first to report
on the accumulation of As and multiple heavy metals and the hyperaccumulation in A. Houstonianum, P. oxyphyllus, and H. cordata.
Of the four hyperaccumulators identified in the present study,
A. houstonianum appeals as the best plant species for tranlocating
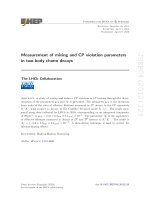
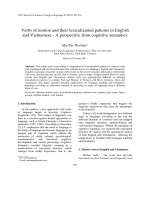
heavy metals and As from the roots to shoots. BCFs values varied
markedly among the elements, ranging from 0.001 (Co) to 2.32 (Cr)
(Fig. 2a). The BCFs values for A. houstonianum for Cr and Ni, which
excceded 1, reflected the ability of this plant species to accumulate
these metals from the soil and to transport them from the roots to
shoots. High BCFw values were obtained for all heavy metals, ranging from 964 (As) to 148,000 (Mn) (Fig. 2b). TF values exceeding 1
were obtained for Cr, Mn, Co, Ni, Zn, Ga, As, Ag, Cd, Ag, and In; values
close to 1 were obtained for Cu (0.92) and Pb (0.91) (Fig. 2c). Moreover, A. Houstonianum, a cool season annual plant that requires dry
or moist soil, has a relatively high biomass, shows rapid growth, is
easy to propage, and is widely distributed in the study area, making
it a good candidate for the phytoremediation of soil contaminated
with As and multi-metals, especially Pb.
Among the plant species analyzed in the present study, P. vittata
is the most widely distributed species. The results of the present
study are in agreement with a previous study that found P. vittata
to be an efficient As hyperaccumulator [28]. Low BCFs values were
obtained for the plant, ranging from 0.002 (Co) to 0.85 (As) (Fig. 2a).
This result is in line with the finding by Stoltz and Greger [16] that
most of the plant species growing on mine tailings are restricted in
terms of the translocation of metals and As to the shoots. The limited upward movement of elements from the roots to shoots can be
considered as a tolerance mechanism [29]. In contrast, BCFw values
were very high, ranging from 6190 (Cr) to 762,900 (Pb) (Fig. 2b).
Very high BCFw values were obtained for Pb and Mn (310,500),
reflecting the strong ability of P. vittata to accumulate these heavy
metals from water. TF values exceeding 1 were obtained for As
and In. The TF value obtained for P. vittata for As was significantly
higher than the value for other hyperaccumulators identified in
the present study (p < 0.001) (Fig. 2c). In addition, P. vittata is mesophytic and widely naturalized in many areas with a mild climate,
has a high biomass, shows rapid growth, and propagates easily
[21,28]; therefore, this plant has high potential for the phytoremediation of As and multi-metals, especially Pb. This finding is in
line with previous reports that P. vittata has potential for the phytoremediation of soils contaminated by As [21], Zn and As [30], Cd
and As [31], and As, Pb, and Zn [32].
Among the 10 plant species collected in the study area, P. oxyphyllus, a submerged aquatic plant that grows naturally in ponds,
shallow rivers, and streams, usually in slightly acid water, appears
to be the best hyperaccumulator of Pb. This plant accumulated
higher concentrations of Mn, Co, Cu, Ga, and Pb than did other
species analyzed in the present study. The BCFs values of P. oxyphyl-
1390
N.T.H. Ha et al. / Journal of Hazardous Materials 186 (2011) 1384–1391
Fig. 2. Bioconcentration factor for soil (a) and for water (b), and translocation factor (c) of four plant species around and outside of the mine. Error bars on columns are
standard deviations (n = 6–15). Error bars with difference letters indicate significant differences among plant species at p < 0.05. The Y axis on the right of (b) is used for Pb
and Mn.
lus varied greatly from 0.08 (Co) to 2.37 (Cd) (Fig. 2a). In contrast,
BCFw values were much higher than BCFs values, ranging widely
from 4010 (Cr) to 4,966,000 (Mn) (Fig. 2b). Very high BCFw values
were obtained for Mn, Pb (865,000), and Ga (192,000), reflecting
the strong ability of P. oxyphyllus to accumulate these heavy metals
from water. P. oxyphyllus also appeals as a useful species in translocating heavy metals from the roots to shoots. TF values exceeding 1
were obtained for this plant for Cr, Ni, Cu, Zn, Ag, Cd, and In; values
close to 1 were obtained for Mn, Co, and Ga (Fig. 2c). Though the
biomass of P. oxyphyllus is lower than that of A. houstonianum and
P. vittata, its high concentrations of heavy metals and rapid growth
make it a candidate for the phytoremediation of water contaminated by As and multi- metals, especially Pb and Mn.
Though H. cordata is a hyperaccumulator of As, its low BCFs and
TF values (Fig. 2a and c), and small biomass mean that it has less
potential for phytoremediation than do A. houstonianum, P. vittata,
and P. oxyphyllus.
4. Conclusions
Results of this study indicate that H. cordata, A. houstonianum,
and P. oxyphyllus were identified as metal hyperaccumulators for
the first time. P. vittata, A. Houstonianum, and P. oxyphyllus are
good candidates for phytoremediation of sites contaminated with
As and multi-metals. None of the collected plants was suitable for
phytomining. To fully investigate the potential for phytoremedia-
N.T.H. Ha et al. / Journal of Hazardous Materials 186 (2011) 1384–1391
tion, further studies (both greenhouse and field experiements) are
needed to confirm the phytoremediation potential of these plant
species and to establish their agronomic requirements and optimal
management practices.
Acknowledgements
This study was supported by the Grant for Environmental
Research Projects from The Sumitomo Foundation (no. 083187),
the Grant-in-Aid for Scientific Research from the Japanese Society for the Promotion of Science (B) (no. 19340153), and the Grant
for Research and Development Assistance of Ehime University. The
authors are grateful to Dr. M. Kuramoto at the Integrated Center
for Sciences, Ehime University, Japan and Dr. N.T. Chi at Vietnam
National University, Hanoi for their help with the chemical analysis
and field study.
References
[1] S. Dudka, D.C. Adriano, Environmental impacts of metal ore mining and processing: a review, J. Environ. Qual. 26 (1997) 590–602.
[2] J.W.C. Wong, C.M. Ip, M.H. Wong, Acid-forming capacity of lead–zinc mine tailings and its implications for mine rehabilitation, Environ. Geochem. Health 20
(1998) 149–155.
[3] IGS (Institute of Geological Science, Vietnam Academy of Science and Technology), Intergrated Investigation, Mining Potential Evaluation of some Important
Natural Resources (Pb-Zn, Au) in Government-Permitted Exploitation Mines for
Socioeconomic Development of Bac-Kan Province: Investigation Report, Hanoi,
2000 (in Vietnamese).
[4] D.A. Belluck, S.L. Benjamin, S. David, Why remediate? in: J.L. Morel, G. Echevarria, N. Goncharova (Eds.), Phytoremediation of Metal-Contaminated Soils,
Springer, Netherlands, 2006, pp. 1–23.
[5] D.E. Salt, R.D. Smith, I. Raskin, Phytoremediation Annu. Rev. Plant Biol. 49 (1998)
643–668.
[6] C. Garbisu, I. Alkorta, Phytoextraction: a cost-effective plant-based technology
for the removal of metals from the environment, Bioresour. Technol. 77 (2001)
229–236.
[7] A.P.G.C. Marques, A.O.S.S. Rangel, P.M.L. Castro, Remediation of heavy
metal contaminated soils: phytoremediation as a potentially promising clean-up technology, Crit. Rev. Environ. Sci. Technol. 39 (8) (2009)
622–654.
[8] R.D. Reeves, Hyperaccumulation of trace elements by plants, in: J.L. Morel, G.
Echevarria, N. Goncharova (Eds.), Phytoremediation of Metal-Contaminated
Soils, Springer, Netherlands, 2006, pp. 25–52.
[9] R.D. Reeves, A.J.M. Baker, Metal-accumulating plants, in: I. Raskin, B.D.
Ensley (Eds.), Phytoremediation of Toxic Metals: Using Plants to Clean
up the Environment, John Wiley and Sons Inc., New York, 2000,
pp. 193–229.
[10] R.R. Brooks, Plants That Hyperaccumulate Heavy Metals, Ist ed., CAB International, Wallingford, 1998.
[11] C.W.N. Anderson, R.R. Brooks, A. Chiarucci, C.J. LaCoste, M. Leblanc, B.H. Robinson, R. Simcock, R.B. Stewart, Phytomining for nickel, thallium and gold, J.
Geochem. Explor. 67 (1999) 407–415.
1391
[12] R. Boominathan, N.M. Saha-Chaudhury, V. Sahajwalla, P.M. Doran, Production
of nickel bio-ore from hyperaccumulator plant biomass: applications in phytomining, Biotechnol. Bioeng. 86 (3) (2004) 243–250.
[13] J. Yoon, X. Cao, Q. Zhou, L.Q. Ma, Accumulation of Pb, Cu, and Zn in native plants
growing on a contaminated Florida site, Sci. Total Environ. 368 (2006) 456–464.
[14] N. Haque, J.R. Peralta-Videa, G.L. Jones, T.E. Gill, J.L. Gardea-Torresdey, Screening
the phytoremediation potential of desert broom (Baccharis sarothroides Gray)
growing on mine tailings in Arizona, USA, Environ. Pollut. 153 (2008) 362–368.
[15] E. Moreno-Jimenez, J.M. Penalosa, R. Manzano, R.O. Carpena-Ruuiz, R. Gamarra,
E. Esteban, Heavy metals distribution in soils surrounding an abandoned mine
in NW Madrid (Spain) and their transference to wild flora, J. Hazard. Mater. 162
(2009) 854–859.
[16] E. Stoltz, M. Greger, Accumulation properties of As, Cd, Cu, Pb, and Zn by four
wetland plant species growing on submerged mine tailings, Environ. Exp. Bot.
47 (2002) 271–280.
[17] M.D. Rio, R. Font, C. Almela, D. Velez, R. Montoro, A.D.H. Bailon, Heavy metals
and arsenic uptake by wild vegetation in the Guadiamar river area after the
toxic spill of the Aznalcollar mine, J. Biotechnol. 98 (2002) 125–137.
[18] D.M. Deng, J.C. Deng, J.T. Li, J. Zhang, M. Hu, Z. Lin, B. Liao, Accumulation of zinc,
cadmium, and lead in four populations of Sedum alfredii growing on lead/zinc
mine spoils, J. Integr. Plant Biol. 50 (6) (2008) 691–698.
[19] A. Chehregani, M. Noori, H.L. Yazdi, Phytoremediation of heavy-metal-polluted
soils: screening for new accumulator plants in Angouran mine (Iran) and evaluation of removal ability, Ecotox. Environ. Saf. 72 (2009) 1349–1353.
[20] M.I. Mattina, W. Lannucci-Berger, C. Musante, J.C. White, Concurrent plant
uptake of heavy metals and persistent organic pollutants from soil, Environ.
Pollut. 124 (3) (2003) 375–378.
[21] C. Tu, L.Q. Ma, B. Bondada, Arsenic accumulation in the hyperaccumulator Chinese brake and its utilization potential for phytoremediation, J. Environ. Qual.
31 (2002) 1671–1675.
[22] W.H. Zhang, Y. Cai, C. Tu, L.Q. Ma, Arsenic speciation and distribution in an
arsenic hyperaccumulating plant, Sci. Total Environ. 300 (1–3) (2002) 167–177.
[23] TCVN 7209-2002, Soil quality-Maximum Allowable Limits of Heavy Metals in
the Soil, Ministry of Science and Technology, Hanoi, Vietnam, 2002.
[24] B.J. Alloway, A.P. Jackson, H. Morgan, The accumulation of cadmium by vegetables grown on soils contaminated from a variety of sources, Sci. Total Environ.
91 (1990) 223–236.
[25] A. Kabata-Pendias, H. Pendias, Trace Elements in Soils and Plants, 2nd ed., CRC
Press, Boca Raton, Florida, 1992.
[26] B.H. Robinson, A. Chiarucci, R.R. Brooks, D. Petit, J.H. Kirkman, P.E.H. Gregg, V.D.
Dominicis, The nickel hyperaccumulator plant Alyssum bertolonii as a potential
agent for phytoremediation and phytomining of nickel, J. Geochem. Explor. 59
(1997) 75–86.
[27] V. Sheoran, A.S. Sheoran, P. Poonia, Phytomining: a review, Miner. Eng. 22
(2009) 1007–1019.
[28] L.Q. Ma, K.M. Komar, C. Tu, W. Zhang, Y. Cai, E.D. Kennelley, A fern that hyperaccumulates arsenic, Nature 409 (2001) 579.
[29] J.A.C. Verkleij, H. Schat, Mechanisms of metal tolerance in plants, in: J. Shaw
(Ed.), Heavy Metal Tolerance in Plants-Evolutionary Aspects, CRC Press, Boca
Raton, Florida, 1990, pp. 179–193.
[30] Z.Z. An, Z.C. Huang, M. Lei, X.Y. Liao, Y.M. Zheng, T.B. Chen, Zinc tolerance and
accumulation in Pteris vittata L. and its potential for phytoremediation of Znand As-contaminated soil, Chemosphere 62 (2006) 796–802.
[31] X. Xiao, T.B. Chen, Z.Z. An, L. Mei, Z.C. Huang, X.Y. Liao, Y. Liu, Potential of Pteris
vittata L. for phytoremediation of sites co-contaminated with cadmium and
arsenic: the tolerance and accumulation, J. Environ. Sci. 20 (2008) 62–67.
[32] F.Y. Wu, H.M. Leung, S.C. Wu, Z.H. Ye, M.H. Wong, Variation in arsenic, lead
and zinc tolerance and accumulation in six populations of Pteris vittata L. from
China, Environ. Pollut. 157 (2009) 2394–2404.