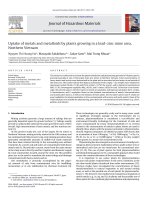
DSpace at VNU: Sediment distribution and transport at the nearshore zone of the Red River delta, Northern Vietnam
Bạn đang xem bản rút gọn của tài liệu. Xem và tải ngay bản đầy đủ của tài liệu tại đây (346.63 KB, 8 trang )
Journal of Asian Earth Sciences 29 (2007) 558–565
www.elsevier.com/locate/jaes
Sediment distribution and transport at the nearshore zone of the
Red River delta, Northern Vietnam
Do Minh Duc
a,*
, Mai Trong Nhuan a, Chu Van Ngoi a, Tran Nghi a, Dao Manh Tien b,
Tj. C.E. van Weering c, G.D. van den Bergh c
a
Faculty of Geology, University of Science, Vietnam National University, Hanoi, Viet Nam
Division for Marine Geology, Department of Geology and Mineral Resources, Viet Nam
Royal Netherlands Institute for Sea Research (NIOZ), P.O. Box 59, 1790, AB Den Burg, Texel, The Netherlands
b
c
Received 22 August 2003; received in revised form 27 February 2005; accepted 2 March 2006
Abstract
The coast between Ngason and Haiphong is largely formed by accretion of the Red River system. In the region, five main surface
sediment types (sand, sandy silt, silt, mud and sand at shoals) could be defined, which differ from one another in their sedimentary characteristics. Sand dominates along the shoreline between 0 and 15 m water depth. Down to a water depth of about 25–30 m, the sediment
is dominantly silt. Further offshore the surface sediments are mainly sandy silt and sand of older units (Early-Middle Holocene, Late
Pleistocene). Net sediment transport directions are defined by grainsize analysis according to the method of Gao and Collins [Gao,
S., Collins, M., 1992. Net sediment transport patterns inferred from grain-size trends, based upon definition of transport vectors. Sedimen. Geol. 80, 47–60, 1992]. At river mouths, directions of sediment transport are variable where the depths are shallower than 5 m.
From 5 to 10 m water depth, sediments are mainly transported southeastward at the Ba Lat, Lach and Day mouths, northeastward
at the Tra Ly mouth and eastward at the Thai Binh mouth. Recently, the Hai Hau erosional shoreline is not supplied with sediment
from the Ba Lat mouth and sediments are transported southwestward alongshore in the region shallower than 5 m. The region of depths
from 10 to 30 m is specified by southward sediment transport.
Ó 2007 Elsevier Ltd. All rights reserved.
Keywords: Grain size; Surface sediment; Sediment transport; Red River delta; Vietnam
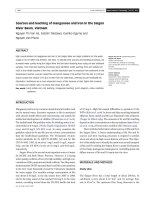
1. Introduction
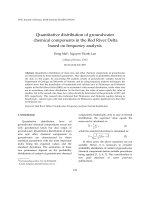
The Ngason-Haiphong area forms a part of the west
coast of the South China Sea (Fig. 1) and has been largely
formed by accretion of the Red River delta system. The
annual amount of sediment transported by the Red River
system into the South China Sea is about 82 · 106 m3. In
the wet season (from June to January), about 90% of the
annual sediment supply is transported through the various
distributaries (Nhuan et al., 1996). Of the total amount of
sediment supplied, 11.7% passes through the Van Uc and
*
Corresponding author.
E-mail address: (D.M. Duc).
1367-9120/$ - see front matter Ó 2007 Elsevier Ltd. All rights reserved.
doi:10.1016/j.jseaes.2006.03.007
Thai Binh river mouths, 11.8% through the Tra Ly river
mouth, 37.8% through the Red River (Ba Lat) mouth
and 23.7% through the Day river mouth. These major river
mouths represent very rapid accretion zones where sediment accumulation rates exceed sea level rise (1–2 mm/
year) and tectonic subsidence (2 mm/year, Ngoi et al.,
2000).
The northern part of the Ngason-Haiphong coast (from
Ba Lat to Haiphong) has a diurnal tidal regime with an
average amplitude of 2.5–3.5 m. In the southern part, from
Ba Lat to Ngason, the tide is mixed with a diurnal dominance. The average tidal amplitude is 2–3 m. Waves usually
have a dominant direction from the east-northeast during
the dry season and from east-southeast during the wet season. The average and maximum wave heights are 0.7–1.3 m
D.M. Duc et al. / Journal of Asian Earth Sciences 29 (2007) 558–565
559
106o 30’
o
106 00’
HAIPHONG
Va
n
o
20 40’
Thai B
Uc
mo
inh m uth
outh
THAI THUY
Diem Dien mou
th
20o30’
Tr a Ly mouth
Re
dR
20o20’ NAM DINH
province
THAI BINH TIEN HAI
province
ive
Lan mouth
r
Vanh shoal
Ngo Dong River
Ba
Ninh Co
Giao Phong
Den lat m
River
ou
shoal
Hai Loc
th
20o10’
Da
y
mo
ut h
NGASON
HAI HAU
LEGEND
Accretionary shoreline
Hai Thinh
Erosional shoreline
Lach
mouth
106o 00’
10
0
10
20 km
o
106 30’
Fig. 1. Location of the study area.
and 3.5–4.5 m, respectively, but in severe storms wave
heights can reach over 5 m (Nhuan et al., 1996).
The shorelines at the major river mouths are currently
expanding at a rate of about 15–100 m/year. The newly
formed land constitutes a useful environment for aquatic
cultures and mangrove development. The rapid accretion
in front of the river mouths causes widespread difficulties
for navigation. On the other hand, sediment deficits in
the adjacent areas lead to shoreline erosion. The coastal
erosion causes the loss of land, demolishment of infrastructure and expansion of saline intrusions. The coastal zone
where rapid erosion prevails is from south of the Ba Lat
mouth (Giao Long) to the Hai Thinh commune (Hai
Hau district, Nam Dinh province) (Fig. 1). The shoreline
regression in this region can reach 10–15 m/year. Erosion
of the shoreline also takes place north of the Van Uc river
(Haiphong city) with lower intensity. 234Th and 210Pb analysis on a number of boxcores and gravity cores in front of
the Red River mouth indicates that the main deposition
takes place south of the river mouth. Toward the north
the sea bed at a depth of 20–25 m is eroded during the
dry season (van den Bergh et al., this volume). There is a
regular southwest to southward bottom current in the
study area at a depth of 15–25 m (Nhuan et al., 1996; Dankers, 2001), enabling transport of fine-grained sediments in
front of the Red River mouth towards the south.
Detailed knowledge concerning the sediment distribution and transport pathways is very important in
understanding the accretionary and erosional patterns in
the coastal zone. This paper presents some results of sediment distribution and transport analysis along the
Ngason-Haiphong coastal zone between a depth of 0 and
30 m, in order to make a contribution in solving questions
related to forecasting shoreline changes, landuse planning
and mitigation of hazards caused by erosion and accretion.
2. Methods and materials
Sediment samples were collected and obtained during
the national research projects on sedimentology and geoenvironment of the coastal zone of Northern Vietnam, carried out by Hanoi University of Science in 1996 and by the
Vietnam – Netherlands ‘‘Red River Delta’’ joint research
project in 2000.
During the fieldwork of these projects, small ships were
used. The position of sampling stations in 1996 and 2000
was determined using a GPS with an accuracy of 5 and
100 m, respectively. In 1996, 564 surface sediment samples
were taken with a grab sampler. The distance between stations was 2.5 km in shallow areas (<10 m water depth) and
5 km in deeper water (10–30 m). In 2000 the fieldwork concentrated on the front of the Red River mouth, covering
the area between 106°20 0 2300 E–106°57 0 3400 E and 22°25 0
4100 N–19°58 0 3900 N. Two successive fieldworks in the dry
(March) and wet (August) season were carried out. A grid
of 20 shallow penetrating echosounder profiles was
retrieved. Based on the interpretation of the acoustic profiles, stations were selected for bottom sampling. All the
sampling stations were located at depths of over 8 m. A
total of 44 gravity cores (up to 2 m long) and 31 box cores
(up to 20 cm long) were retrieved. However, no gravity
cores and box cores could be successfully retrieved at
560
D.M. Duc et al. / Journal of Asian Earth Sciences 29 (2007) 558–565
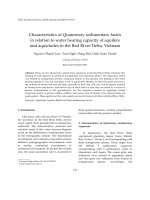
The coefficients of correlation (r) for the parameters
median diameter (D50), sandy content, silty content and
clayey content are 0.83, 0.94, 0.81 and 0.86, respectively.
These good correlations allow for a conversion of values
obtained by laser diffraction to those of the pipette method.
The sediment was classified using the criteria for classification of sediments of the British Geological Survey.
McLaren and Bowles (1985) proposed a hypothesis
that relates two cases of grain-size trends to net transport paths. According to this model, along the direction
of net transport sediments can be either better sorted,
finer and more negative skewed (measured in / units)
or better sorted, coarser and more positively skewed.
The model has been re-examined by Gao and Collins
(1990), afterwards (1992), they proposed a procedure to
define two dimensional net sediment transport pathways,
including some steps as follows: comparisons of grainsize
parameters at a station with the ones at adjacent stations
to define unit and trend vectors, averaging to define of
transport vectors and significance test of the derived
trends.
Assumptions taken into account: sorting, mean and
skewness are considered to be of equal importance in defining transport trends. The sediment samples taken by grab
sampler may represent different time periods (e.g., longer
places where sand or gravel constituted the surface sediments. Twenty-one sub-samples were taken from the split
gravity cores for granulometry. In addition, 49 sandy sediment samples were retrieved at the Den shoal and Vanh
shoal (Fig. 1).
In 1996, grain size distributions of sediment samples
were analyzed by means of sieve for the sandy fractions
(sieve sizes: 2, 1, 0.5, 0.25, 0.125 and 0.063 mm), and by
means of pipette analysis for samples containing particles
smaller than 63 lm (Table 1). In 2000, sieves were also used
for the sandy fractions of samples, but laser diffraction
analysis (Master Sizer, Malvern Instruments, Ltd.) was
used for the finer-grained fractions. For comparison of
the two methods, 14 samples were analyzed by both methods (sieve/pipette and sieve/laser diffraction). The correlation of grain size characteristics between both methods is
shown in Fig. 2.
Table 1
The number of analyzed samples
Method
Year 1996
Year 2000
Sieve
Pipette
Laser diffraction
272
292
0
49
14
117
a
30
b
30
y = 1.4753x + 3.4639
R2 = 0.8754
25
20
y = 2.3798x - 2.7154
R2 = 0.6885
15
Pipette
Pipette
20
10
10
5
0
0
0
5
10
15
20
25
0
30
10
Laser diffraction
c
20
30
Laser diffraction
75
d
50
y = 0.7338x + 0.6377
70
2
R = 0.7369
40
Pipette
Pipette
65
60
30
20
55
y = 0.9695x + 5.2816
R2 = 0.6625
50
50
55
60
65
Laser diffraction
70
10
75
10
20
30
40
50
Laser diffraction
Fig. 2. Correlations of median diameter (in lm) (a) and sandy (b), silty (c), clayey (d) percentages based on analyses by laser diffraction and the pipette
method.
D.M. Duc et al. / Journal of Asian Earth Sciences 29 (2007) 558–565
561
or shorter periods are represented at sites of higher and
lower sedimentation rates, respectively). The characteristic
distance is assumed to be 5 km, which is the longest distance between two adjacent sample stations. Therefore,
the differences of sedimentation rates between stations of
shorter than 5 km apart are supposed to be small.
there are 24 well-sorted and 11 poorly sorted samples. On
average sandy silt is composed of 41% sand and 50% silt,
whereas clay content is always less than 16.5%. D50 ranges
from 0.020 to 0.062 mm with an average of 0.044 mm.
3. Sediment distribution at the nearshore zone of the RRD
Silt covers two narrow northwest-southeast trending
strips pertaining to the old sediment units (the old and
recent silts are not mapped as distinct units in Fig. 3).
The sediment is moderately sorted and the main components are silt (on average 69%) and clay (22%). Toward
the northwest these strips merge into the reddish-coloured
silt of the recent sediment unit.
The recent silt is widely distributed in a broad zone
along the coast stretching from northeast to southwest.
Most of the silt is poorly sorted (So > 2.5), indicating quite
unstable hydrodynamic conditions of sediment deposition.
The recent silt is dominated on average by 70% silt, similar
as in the old sedimentary units. The average contents of
clay and sand are 22% and 2%, respectively. D50 varies
from 0.018 to 0.051 mm.
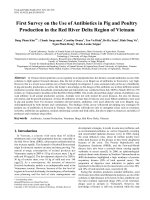
Five main sediment types could be distinguished, and a
map of the surface sediment distribution was drawn
(Fig. 3). Around the 30 m isobath in the central part of
the study area the sediment changes from silt to sandy silt
in offshore direction. The sandy silt samples in the region
usually contain abundant shell fragments and have greenish grey colour. To the contrary, sediment from the near
coastal zone has a dominant red colour. The coefficient
of cation exchange (Kt = (Na+ + K+)/(Ca2+ + Mg2+)) of
greenish sediments is always above 1 and the pH varies
between 7.2 and 8.0. These values are typical for a shallow
marine environment and confirm the conclusions of Nghi
et al. (1996) that silt, sandy silt and sand along the eastern
margin represent old sediment units of Early-Middle Holo2
cene ðQ1–2
IV Þ and Late Pleistocene ðQIII Þ.
The characteristics of the most widespread old (Q2III ,
1–2
QIV ) and recent ðQ3IV Þ sediment units are shown in Tables
2 and 3, respectively.
3.1. Sand
1–2
The old units Q2III and QIV
cover 3 large sandy areas
along the eastern margin of the study area (Fig. 3). The
old sand unit is restricted to water depths of more than
25 m. Most of the old sand unit is well sorted with an average So of 1.297. Only three samples show moderate sorting
(So up to 2.516). This sand unit contains between 90 and
100% sandy particles. The remaining part is silt. D50 is
rather variable, with a maximum of 0.713 mm.
Recent sand is distributed along the shoreline in water
depths of 3–5 m, except to the southeast of the Red River
mouth, where sand extends down to the water depth of
15 m. The recent sand is very well sorted (So = 1.100–
1.318) and consists on average for 98.5% of sandy and
1.5% of silty particles. D50 varies between 0.085 and
0.406 mm with an average of 0.135 mm, which is finer
grained than sand from the old sandy units.
Sand at the Den and Vanh shoals in front of the Red
River mouth is characterized by very good sorting
(So = 1.116–1.287) and rather uniform D50 (0.125–
0.196 mm).
3.3. Silt
3.4. Mud
Recent mud covers small patches in a water depth
between 5 and 16 m. The sediment is moderately to poorly
sorted. It consists mainly of silt (52%) and clay (44%)
with minor amounts of sand (<8%). D50 is very small
(0.005–0.011 mm).
In addition, there are a number of other sediment
types, such as sandy gravel, gravelly sand, gravelly
mud, slightly gravelly mud, muddy sand and sandy
mud, all with low frequencies. Gravelly samples were
exclusively found in connection to the old sediment units
in deep water. These sediments consist for 25–32% of
gravel, 53–70% of sand and 3–14% of silt and clay. They
are poorly sorted (So = 2.1–6.2). D50 varies from 0.05 to
0.52 mm. These types usually cover limited areas of single sampling stations, and have not been mapped in
Fig. 3.
4. Transport of recent sediments at the nearshore zone of
RRD
The mean grain-size, sorting and skewness have been
calculated using the /-scale. The procedure for determining
transport vectors has been programmed using Turbo Pascal (Duc et al., 2003). The characteristic distance is considered as the longest distance between two survey stations
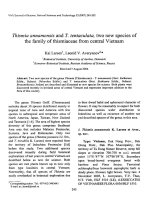
and equals to 5 km. The results (Fig. 4) show the following:
3.2. Sandy silt
4.1. River mouths
Sandy silt exists only in the old sediment units. It distributes widely at the eastern and southeastern margin of the
study area where the depth is over 25–30 m. Most samples
of this type are moderately sorted (2.5 < So < 4.0), but
The transport vectors do not have dominant directions
where the depth is less than 5 m. This may be a result of
strong variation of hydrodynamic factors at the river
562
D.M. Duc et al. / Journal of Asian Earth Sciences 29 (2007) 558–565
Fig. 3. Map of surface sediment distribution at the near shore zone of RRD.
mouths (flow, wave and tide induced currents, see van
Maren, 2004). From 5 to 10 m water depth, sediments
are mainly transported southeastward at the Ba Lat, Lach
and Day mouths, northeastward at the Tra Ly mouth and
eastward at the Thai Binh mouth.
4.2. Hai Hau coast
The coastal segment between Hai Loc and Hai Thinh
has been considered as the northern coastal segment most
severely affected by erosion. Recently, the erosional retreat
D.M. Duc et al. / Journal of Asian Earth Sciences 29 (2007) 558–565
563
Table 2
Characteristics of old surface sediment types of the nearshore zone
Type
Sand
Sandy
Silt
Silt
a
b
Parameters
Average
Max
Min
Standard deviation
Soa
1.297
0.220
99.42
0.58
0
2.982
0.044
41.40
49.78
8.82
2.756
0.013
9.03
69.04
21.93
2.516
0.713
100
9.99
0
4.878
0.062
49.45
69.26
16.54
3.531
0.016
9.94
74.05
29.05
1.118
0.120
90.01
0
0
1.296
0.020
22.80
41.31
3.64
2.305
0.010
6.67
63.00
16.36
0.16
0.10
1.78
1.78
—
0.51
0.012
6.79
6.91
3.44
0.509
0.002
1.16
4.25
4.32
D50b (mm)
Sand (%)
Silt (%)
Clay (%)
So
D50 (mm)
Sand (%)
Silt (%)
Clay (%)
So
D50 (mm)
Sand (%)
Silt (%)
Clay (%)
Number of samples
110
147
12
So is sorting coefficient.
D50 is median diameter (after Krumbein and Sloss, 1963).
Table 3
Characteristics of recent surface sediment types of the near-shore zone
Type
Parameters
Average
Max
Min
Standard deviation
Sand at Red
So
D50 (mm)
Sand (%)
Silt (%)
Clay (%)
So
D50 (mm)
Sand (%)
Silt (%)
Clay (%)
So
D50 (mm)
Sand (%)
Silt (%)
Clay (%)
So
D50 (mm)
Sand (%)
Silt (%)
Clay (%)
1.204
0.167
99.91
0.09
0
1.166
0.135
98.55
1.45
0
3.051
0.024
2.39
70.09
21.93
3.615
0.006
3.58
52.18
44.24
1.287
0.196
100
0.97
0
1.318
0.406
100
9.90
0
3.788
0.051
8.44
79.45
29.05
4.851
0.011
8.09
64.88
60.63
1.116
0.125
99.03
0
0
1.100
0.085
90.10
0
0
2.236
0.018
0
63.80
16.36
2.399
0.002
0.37
36.75
32.74
0.052
0.014
0.23
0.23
—
0.04
0.04
2.82
2.82
—
0.336
0.008
2.69
4.77
4.32
0.542
0.002
2.48
6.33
7.54
River mouth shoals
Sand
Silt
Mud
velocity can reach over 20 m/year. The coast is supplied
with sediment from the Ba Lat mouth. However, the dominant transport direction is perpendicular to the depth contours to a depth of about 25 m. Sediments are transported
along shore in southwestward direction in the coastal
waters shallower than 5 m.
The depth interval from 10 to 30 m is dominated by
southward transport. Along the offshore edge of the recent
sediment unit, the sediment is mainly transported landward. This is an artefact because here the recent sediment
consists of a very thin layer that has become mixed with
coarser, early-Middle Holocene sediments due to the sampling method.
Number of samples
49
104
159
35
5. Discussion
The old sandy sediment distributes at a water depth of
over 30 m, with some lenses of gravel locally. Gravel and
sand are composed mainly of quartz and some lateritic
lumps with various shapes. The quartz gravels are of terrestrial origin and were transported by the Late PleistoceneEarly Holocene rivers. Lateritic lumps were formed by
the erosion of Late Pleistocene ðQ2III Þ weathering surfaces
during the Holocene transgression and belong to the
Q2III -Q1IV formations. As mentioned above, greenish sandy
1–2
silt and silt belong to the units of QIV
. They were formed
in a period of rapid transgression. The narrow strips of
564
D.M. Duc et al. / Journal of Asian Earth Sciences 29 (2007) 558–565
Thai Binh mouth
Diem Dien mouth
Tra Ly mou
th
25
5 10
5
0
5
10km
Ba
Lan mouth
La
tm
ou
th
30
H
ha
ai
u
s
l
re
ho
5
e
in
30
15
15
Lach mouth
20
25
Day mouth
20
25
30
Net sedimet tranport
pathways
Fig. 4. Sketch of net sediment transport pathways.
old silt constitute evidence for the former existence of old
river channels prior to the Holocene transgression.
Sandy bars in front of the Ba Lat mouth were formed
during the regression that started at the end of the Middle
to the Late Holocene after the maximum transgression in
the Middle Holocene. The landward side of the bars is
now accreted and the offshore side is locally eroded. The
recent sediments always have a typical red colour that originates from lateritic suspended sediments of the Red River
system.
Reliable bedload sediment transport pathways obtained
by using the method of Gao and Collins (1992) can only be
used where sediments are deposited in the same period of
time. Grab samples contain a mixture of sediments from
depths ranging between 0 and 10 cm. At places where
recent sediments constitute only a thin layer, the samples
would contain both recent fine-grained sediments and
coarser-grained older sediments, causing chaotic patterns
in the transport pathways. This situation is met at the offshore edge of the Red River delta, where resulting sediment
transport pathways are mainly in landward direction.
According to Mathers and Zalasiewicz (1999), the
northern part of the Ngason-Haiphong coastal zone (from
Haiphong to the Thai Binh mouth) has a tide-dominated
morphology and the coast from the Thai Binh mouth to
the Day mouth is wave dominated. The coast from Haiphong to the Thaibinh mouth has a ratio of tidal range
(TR) to wave height (H) of more than 3, corresponding
with a tide-dominated coast (Davis and Hayes, 1984).
The remaining parts of the Ngason-Haiphong coastal zone
correspond to a mixed tide-wave-dominated coast with a
TR/H of between 1 and 3. However most of the sediments
are transported from the larger river mouths to near shore
areas. Therefore the present coasts at the Red River, Day
and Tra Ly mouths represent mixed tide-wave-dominated
coasts with strong riverine influence, in particular during
the wet season. The Hai Hau coast zone with a straight
shoreline, a dominance of longshore sediment transport
and rapid erosion behaves like a high-wave energy coast.
The sediment from the Red River is largely transported
in southern direction and does not reach the coastline of
the Hai Hau district. The completion of a large dam
D.M. Duc et al. / Journal of Asian Earth Sciences 29 (2007) 558–565
(Hoa Binh dam) in 1987 upstream of the Red River system
has led to a significant decrease in the amount of sediment
supplied in front of the Red River mouth. Therefore it is
likely that present coastal erosion in the Hai Hau area is
partly due to a decrease in sediment supplied by the Red
River mouth. Moreover, the Ngo Dong river, which was
dammed in 1955, losts its importance as a major branch
of the Red River towards the end of 19th century, when
the erosion in the Hai Hau district started. It is not clear
whether the decreased activity of this branch has been
caused by natural developments or by man-made channeling works (Vinh et al., 1996).
6. Conclusions
The main conclusions can be summarized as follows:
1. Five main surface sediment types in the Ngason-Haiphong coastal zone could be defined, namely sand,
sandy silt, silt, mud and sand at shoals. They differ from
one another in their sedimentary characteristics (So, D50,
sand, silt and clay contents). Sand and silt exist in both
old and recent sediments in the study area, but the latter
are distinct in their red colour and low contents of carbonate fragments.
2. The recent ðQ3IV Þ sandy surface sediment is deposited
along the shoreline at a depth of between 0 and 5 m,
except near the Ba Lat mouth, where sand reaches a water
depth of 15 m. Further offshore down to a depth of about
25–30 m, the sediment becomes silty with lenses of mud.
Further offshore the old surface sediments of sandy silt
1–2
ðQIV
Þ and sand ðQ2III -Q1IV Þ are widely distributed.
3. At the river mouths, the directions of net sediment transport are variable in water depths shallower than 5 m.
From 5 to 10 m water depth, sediments are mainly transported southeastward at the Ba Lat, Lach and Day
mouths, northeastward at the Tra Ly mouth and eastward at the Thai Binh mouth. At the Hai Hau erosional
shoreline, sediments are transported southwestward
alongshore in the region shallower than 5 m. The region
of depths from 10 to 30 m is specified by southward sediment transport.
565
Acknowledgements
The writers thank WOTRO (NWO, the Netherlands)
and the Vietnam Fundamental Scientific Project coded
7.8.12 who funded this research.
References
Dankers, P.J.T., 2001. Spatial and Temporal Variability of the Ba Lat
River Plume, Red River Delta, Vietnam. Unpublished Report.
Institute for Marine and Atmospheric Research Utrecht.
Davis, R.A., Hayes, M.O., 1984. What is a wave-dominated coast? Marine
Geol. 60, 313–329.
Duc, D.M., Nghi, T., Nhuan, M.T., Tien, D.M., 2003. Net sediment
transport pathways inferred from grain-size analysis. Vietnam J. Geol.
276 (5–6) (in Vietnamese).
Gao, S., Collins, M., 1990. A critique of the ‘‘McLaren Method’’ for
defining sediment transport paths - discussion. J. Sediment. Petrol. 61,
143–146.
Gao, S., Collins, M., 1992. Net sediment transport patterns inferred from
grain-size trends, based upon definition of ‘‘transport vectors’’.
Sediment. Geol. 80, 47–60.
Krumbein, W.C., Sloss, L.L., 1963. Stratigraphy and Sedimentation.
W.H. Freeman and Company, p. 660.
Mathers, S., Zalasiewicz, J., 1999. Holocene sedimentary architecture of
the Red River delta, Vietnam. J. Coastal Res. 15, 314–325.
McLaren, P., Bowles, D., 1985. The effects of sediment transport on grainsize distribution. J. Sediment. Petrol. 55, 457–470.
Nghi, T., Thanh, D.T.V., Tam, N.D., So, H.T., 1996. Establishing surface
sediment map of shallow sea (0–30 m deep) in Ngason-Haiphong Area,
scale 1: 500,000, p. 45 (in Vietnamese).
Ngoi, C.V., Nghi, T., Nhuan, M.T., Luyen, D.V., Duc, D.M., 2000.
Geodynamic characteristics of the Red River delta in the Holocene. J.
Geol. A, 40–45 (in Vietnamese).
Nhuan, M.T., Hai, T.Q., Ngoi, C.V., Manh, L.V., Vi, P.V., 1996.
Establishing environmental geological map of shallow sea (0–30 m
deep) in Ngason-Haiphong Area, scale 1: 500,000, p. 94 (in
Vietnamese).
van den Bergh, G.D., Boer, W., Schaapveld, M.A.S., Duc, D. M., van
Weering, Tj. C. E., 2007. Recent sedimentation and sediment
accumulation rates of the Ba Lat, prodelta (Red River, Viet Nam).
J. Asian. Earth. Sci. 29, 545–557.
van Maren, D.S., 2004. Morphodynamics of a cyclic prograding delta:
The Red River, Vietnam. Ph.D Dissertation, Knag/Faculty of Geosciences, University of Utrecht. Netherlands Geographical Studies,
324, pp. 167.
Vinh, T.T., Kant, G., Huan, N.N., Pruszak, Z., 1996. Sea dike erosion and
coastal retreat at Nam Ha Province, Vietnam. Coast. Eng. 40,
2820–2828.