DSpace at VNU: Fabrication and Characterization of Graphene Graphene Oxide-Based Poly(vinyl alcohol) Nanocomposite Membranes
Bạn đang xem bản rút gọn của tài liệu. Xem và tải ngay bản đầy đủ của tài liệu tại đây (1.11 MB, 6 trang )
Journal of ELECTRONIC MATERIALS
DOI: 10.1007/s11664-015-4281-8
Ó 2015 The Minerals, Metals & Materials Society
Fabrication and Characterization of Graphene/Graphene OxideBased Poly(vinyl alcohol) Nanocomposite Membranes
NGUYEN HUU HIEU,1,3 NGUYEN HUYNH BACH SON LONG,2
DANG THI MINH KIEU,1 and LY TAN NHIEM1
1.—Faculty of Chemical Engineering, Ho Chi Minh City University of Technology, 268 Ly Thuong
Kiet Street, District 10, Ho Chi Minh City, Vietnam. 2.—Faculty of Chemical and Environmental
Engineering, Lac Hong University, 10 Huynh Van Nghe, Bien Hoa City, Dong Nai Province,
Vietnam. 3.—e-mail:
Graphene (GE)- or graphene oxide (GO)-based poly(vinyl alcohol) (PVA)
nanocomposite membranes have been prepared by the solution blending
method. Raman spectra and atomic force microscopy images confirmed that
GE and GO were synthesized with average thickness of 0.901 nm and
0.997 nm, respectively. X-ray diffraction patterns indicated good exfoliation of
GE or GO in the PVA matrix. Fourier-transform infrared spectra revealed the
chemical fractions of the nanocomposite membranes. Differential scanning
calorimetry results proved that the thermal stability of the nanocomposite
membranes was enhanced compared with neat PVA membrane. Transmission
electron microscopy images revealed good dispersion of GE or GO sheets in the
PVA matrix with thickness in the range of 19 nm to 39 nm. As a result, good
compatibility between GE or GO and PVA was obtained at 0.5 wt.% filler
content.
Key words: Graphene, graphene oxide, poly(vinyl alcohol), nanocomposite,
membrane
INTRODUCTION
GE is a single layer of graphite, being found as
layers of sp2-hybridized carbon in the form of planar
hexagonal rings corresponding to sigma-type bonds.
In addition, the remaining p-orbitals form delocalized p-type bonds.1
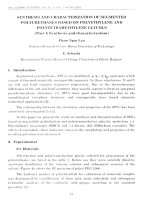
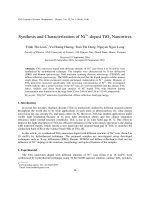
In 2004, Geim and Novoselov discovered singlelayer GE by using the scotch-tape method.1 The
structural model of single-layer GE is shown in
Fig. 1.
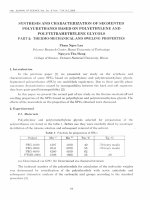
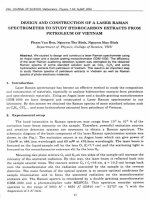
GO is produced by oxidation of graphite, being a
derivative of GE with oxygen-containing functional
groups such as hydroxyl (–OH), epoxy (–COC–),
carbonyl (–C=O), and carboxyl (–COOH).2 The
structural model of the surface and edges of GO is
presented in Fig. 2.
GE has attracted a lot of attention in recent years
because of its extraordinary physical and chemical
(Received October 5, 2015; accepted December 1, 2015)
properties. Its properties include high electrical
remarkable
conductivity
(200,000 cm2/V-s),
mechanical strength (Young’s modulus $125 GPa),
excellent thermal conductivity (5000 W/m-K), and
high specific surface area (2630 m2/g).3,4 In the case
of GO, the oxygen functional groups have been
found to be effective to enhance the chemical
interactions between GO and other compounds.5
In addition, GO sheets show increased interlayer
spacing and solubility in water compared with GE.6
GE or GO can be used as a nanofiller in a polymer
matrix to prepare nanocomposite membranes.7 The
good compatibility and dispersion of GE or GO
sheets in polymers result in enhanced characteristics of such nanocomposite membranes.8–10 In application of these nanocomposites for separation, the
barrier property of the GE or GO sheets plays an
important role in improving the membrane selectivity.11,12 Simultaneously, the mechanical and
thermal stability properties of the nanocomposite
membranes are also enhanced, resulting in
increased filtration efficiency.4,10–13
Hieu, Long, Kieu, and Nhiem
In this study, GE- or GO-based PVA membranes
were fabricated by the solution blending method.10
The effects of the GE or GO content on the
morphology and structure of the GE/PVA and GO/
PVA nanocomposite membranes were investigated
by x-ray diffraction (XRD) analysis, transmission
electron microscopy (TEM), Fourier-transform
infrared (FTIR) spectroscopy, and differential scanning calorimetry (DSC). The obtained membranes
are intended for dehydration of bioethanol solution
by pervaporation technology.
EXPERIMENTAL PROCEDURES
Materials
PVA (molecular weight 80,000, degree >98%),
sulfuric acid (98 wt.%), sodium nitrate (99 wt.%),
hydrogen peroxide (30 wt.%), and hydrazine
hydrate (35 wt.%) were purchased from Xilong
Chemical, China. Graphite (particle size <50 lm,
density 20 g/100 mL to 30 g/100 mL) was purchased
from Sigma Aldrich, Germany. Potassium permanganate (>99.5 wt.%) and ethanol (96 vol.%) were
purchased from ViNa Chemsol, Vietnam. All chemicals were used without any further purification.
Fig. 1. Structural model of GE.1
Fig. 2. Structural model of GO.2
Fabrication of Nanocomposite Membranes
GE and GO were synthesized from graphite by a
modified Hummers’ method based on our previous
study.13 According to the solution blending method,
0.65 g PVA was dissolved in deionized water
(100 mL) at 90°C. Then, 13 mL GE or GO aqueous
suspension (0.25 mg/mL) corresponding to 0.5 wt.%
(based on the weight of dry nanocomposite membrane) was dropped into the PVA solution and then
stirred at 90°C for 1 h. The mixture was ultrasonicated at 45°C for 4 h to obtain a homogeneous
suspension (GE/PVA or GO/PVA). Finally, the
obtained suspension was cast onto glass Petri plates
and dried at 90°C for 5 h. The nanocomposite
membranes are denoted 0.5GE/PVA or 0.5GO/
PVA, corresponding to the 0.5 wt.% of GE or GO.
The effect of the GE or GO content on the
characteristics of the nanocomposites was investigated using different GE or GO loadings of 1.0 wt.%,
1.5 wt.%, and 2.0 wt.%. These membranes are
denoted 1.0GE/PVA, 1.5GE/PVA, 2.0GE/PVA or
1.0GO/PVA, 1.5GO/PVA, 2.0GO/PVA for the corresponding GE or GO loadings.
Characterization
Raman spectra were recorded using micro-Raman
spectroscopy (LabRAM-HORIBA Jobin Yvon, excitation wavelength 632.8 nm). Atomic force microscopy (AFM) measurements were performed on an
AFM Nanotec Electronica (Spain) on samples made
by casting powder dispersions onto freshly cleaved
mica substrates and drying under ambient condition. XRD patterns were recorded on an Advanced
X8 Bruker machine at wavelength (k) of 0.154 nm in
the Applied Material Science Institute. FTIR spectra were obtained in the wavenumber range from
4000 cmÀ1 to 500 cmÀ1 during 64 scans on an
Alpha–E spectrometer (Bruker Optik GmbH, Ettlingen, German) in the Essential Laboratory of Chemical Engineering & Petroleum, Vietnam National
University, Ho Chi Minh City University of Technology. DSC was conducted using a Mettler Toledo
machine at linear heating rate of 40°C/min from 0°C
to 240°C in the Laboratory of Membrane Technology. TEM images were taken using a JEM-1400 at
accelerating voltage of 100 kV in the Essential
Laboratory of Nanocomposite Materials.
Fabrication and Characterization of Graphene/Graphene Oxide-Based Poly(vinyl alcohol)
Nanocomposite Membranes
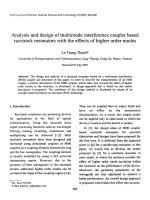
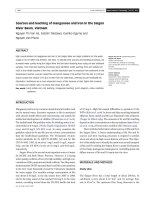
Fig. 3. Raman spectra of graphite, GO, and GE.
RESULTS AND DISCUSSION
Structure of GO and GE
Raman spectroscopy is widely used to characterize crystal structure, disorder, and defects in
graphene-based materials. The Raman spectra of
graphite, GO, and GE are shown in Fig. 3. The
characteristic G-band and D-band peaks of graphite, GO, and GE were detected at around
1580 cmÀ1 and 1370 cmÀ1, respectively. The Gband is related to vibration of sp2-bonded carbon
atoms in a two-dimensional hexagonal lattice. The
D-band is associated with vibration of disordered
sp2-bonded carbon atoms.14,15 These bands can be
used to evaluate the extent of carbon-containing
defects. The prominent D-band peak is from structural imperfections created by attachment of hydroxyl and epoxide groups on the carbon basal plane.
The intensity of the D-band is related to the size of
the in-plane sp2 domains.16 Increase of the D-band
peak intensity indicates formation of more sp2
domains.
Additionally, as seen in Fig. 3, the D/G intensity
ratio for GE is larger than for GO (1.5 for GE and
1.0 for GO). This can be explained based on the fact
that the relative intensity ratio of these peaks (ID/
IG) quantifies the degree of disorder and is inversely
proportional to the average size of the sp2 clusters.16
These results reveal that GO and GE were successfully synthesized, similar to previous works.14,15,17
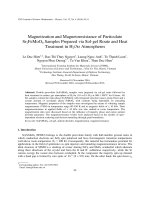
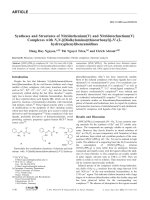
AFM images and height profiles for GO and GE
are shown in Fig. 4. Accordingly, the average
thickness of the obtained GO and GE layers was
found to be 0.901 nm and 0.997 nm, respectively.
The AFM images confirmed that GO and GE were
successfully synthesized, in agreement with previous studies ($1 nm).14,17
Dispersion of GE or GO in PVA Matrix
The XRD patterns of GE, GE/PVA, GO, and GO/
PVA membranes are shown in Fig. 5. The XRD
results indicate that the diffraction peaks for GE at
2h = 21° to 26° and for GO at 2h = 11.27° disappeared in the patterns of the nanocomposites. All
typical diffraction peaks of GE/PVA and GO/PVA
are located at 2h = 19.46° to 20°, corresponding to
that of neat PVA at 2h = 19.50°.7,18 These results
demonstrate good incorporation and dispersion of
GE or GO in the PVA matrix. Such incorporation
improves the crystallinity of the PVA, as revealed
by the increasing sharpness and width of the
diffraction peaks.19,20
On the other hand, the improvement in crystallinity for the GO/PVA was greater than for the
GE/PVA membranes. This can be explained by the
fact that the GO sheets were almost completely
dispersed in the PVA matrix through hydrogen
bonds between the oxygen-containing groups in GO
and hydroxyl groups in PVA.19,21 Good crystallinity
was achieved at 0.5 wt.% loading, corresponding to
the highest and widest peaks in the pattern of GO/
PVA. In the case of GE, the sheets of GE tend to
aggregate and stack together. Such aggregation is
attributed to the strong van der Waals interactions
between the GE sheets. The formation of hydrogen
bonds between the GE sheets and PVA matrix
through some remaining oxygenated functionalities
in GE is not strong enough to counterbalance the
attractive van der Waals forces.21,22 The appearance
of aggregated GE sheets can restrict and order the
PVA chain arrangement, causing the lower crystallinity of the GE/PVA membranes.8,19 Furthermore, the peaks became weaker with increasing GE
or GO content from 0.5 wt.% to 2 wt.%. This is due
to the fact that, the higher the filler content, the
more aggregation in the nanocomposites.22
Ultrathin sections of GE/PVA and GO/PVA membranes with 0.5% loading were observed via TEM.
The images (Figs. 6 and 7) show good dispersion of
aggregated GE or GO sheets in the PVA matrix with
average thickness from 19 nm to 39 nm.
However, the GE sheets have higher density than
those of GO due to the weak interaction between GE
and PVA. These results are also consistent with the
XRD patterns.
Hydrogen-Bonding Interactions between GE
or GO and PVA Matrix
The FTIR spectra of GE, GE/PVA, GO, and GO/
PVA are shown in Fig. 8. The spectra show the
characteristic peaks of various functionalities
including alkyl (2942 cmÀ1), carbonyl (1712 cmÀ1
and 1331 cmÀ1), and epoxy (1095 cmÀ1).14,19 The
peak located at 1658 cmÀ1 is assigned to adsorbed
water, indicating moisture intake in the membranes.12 In all the spectra, the peaks located at
3200 cmÀ1 to 3500 cmÀ1 are attributed to stretching
vibration of hydroxyl groups and hydrogen bonds.6,13
Additionally, the spectra of GE/PVA show several
small peaks located at 3200 cmÀ1 to 3500 cmÀ1 that
can be ascribed to dissociation of hydrogen bonds
Hieu, Long, Kieu, and Nhiem
Fig. 4. AFM images and height profiles of GO and GE.
Fig. 5. XRD patterns of (a) GE and GE/PVA; (b) GO and GO/PVA.
among hydroxyl groups in PVA chains. This is due to
intercalation of GE sheets, which cut off the hydrogen bonding between PVA chains, resulting in the
unstable adsorption ability of GE/PVA.10,13
In contrast, in the case of GO, there is a decrease
in the hydrogen bonding between the PVA chains
due to the presence of the GO sheets. However, the
total amount of hydrogen bonds in the GO/PVA is
still larger than for neat PVA or GE/PVA.10,18 This
can be attributed to the good dispersion and high
compatibility between GO and the PVA matrix.
Thus, the FTIR spectra of GO/PVA and neat PVA
are similar, as shown in Fig. 8b.
Thermal Properties of Membranes
The DSC results are presented in Table I. It can
be seen that the glass-transition temperature Tg of
Fabrication and Characterization of Graphene/Graphene Oxide-Based Poly(vinyl alcohol)
Nanocomposite Membranes
Fig. 6. (a) TEM image and (b) 0.5GE/PVA membrane product.
Fig. 7. (a) TEM image and (b) 0.5GO/PVA membrane product.
Fig. 8. FTIR spectra of (a) GE, GE/PVA and (b) GO, GO/PVA.
Hieu, Long, Kieu, and Nhiem
Table I. Glass-transition
membranes
Sample
PVA
0.5GO/PVA
1.0GO/PVA
1.5GO/PVA
2.0GO/PVA
temperature
Tg
of
Tg (°C)
Sample
Tg (°C)
57.34
60.42
65.53
67.15
70.34
0.5GE/PVA
1.0GE/PVA
1.5GE/PVA
2.0GE/PVA
80.27
82.31
83.68
86.70
the nanocomposite membranes increased with addition of GE or GO. These results indicated that the
thermal stability of the nanocomposites was
enhanced compared with neat PVA. These results
are in agreement with previous studies.8,13 In
addition, the Tg value for GO/PVA was lower than
for the GE/PVA nanocomposites. This can be
explained by the fact that the presence of abundant
oxygen-containing functional groups in the GO
sheets contributes to the good compatibility and
dispersion of GO in the PVA matrix. However, the
low thermal stability of these groups means that the
polymer matrix is easily destroyed. Meanwhile, the
high mechanical strength of GE leads to the
enhancement of the thermal stability of GE/PVA,
even though hydrogen bonds are not created in the
nanocomposite.3,5 Although the structure of the
PVA crystals was changed due to the presence of
GE or GO, the crystallinity was clearly improved.
The DSC results show the important role of GE or
GO in enhancing the thermal stability of the
membranes.10,11
CONCLUSIONS
GE/PVA and GO/PVA nanocomposite membranes
were prepared by the solution blending method. The
effects of GE or GO filler at 0.5 wt.%, 1 wt.%,
1.5 wt.%, and 2 wt.% loading on the characteristics
of the membranes were investigated.
XRD analysis indicated that GO was more compatible with the PVA matrix compared with GE.
TEM images showed that the filler sheets aggregated into multilayers. FTIR spectra demonstrated
that the amount of hydrogen bonds in GO/PVA was
much greater than in GE/PVA. A suitable content of
GE or GO filler to prepare nanocomposite membranes was found to be 0.5 wt.%; and the dispersion
of GO in the PVA matrix was better than that of GE.
DSC results revealed that the thermal stability of
the nanocomposite membranes was enhanced in
comparison with neat PVA membrane. In addition,
the Tg value of GE/PVA was higher than for GO/
PVA.
The results indicate that nanoscale dispersion of
GE or GO in the PVA matrix had a positive effect on
the characteristics for both nanocomposite
membranes.
ACKNOWLEDGEMENT
The authors gratefully acknowledge the financial
support from Ho Chi Minh City Department of
Science and Technology through Contract No. 336/
2013/HÐ-SKHCN.
REFERENCES
1. K.S. Novoselov, V.I. Fal, L. Colombo, P.R. Gellert, M.G.
Schwab, and K. Kim, Nature 490, 192 (2012).
2. D.R. Dreyer, S. Park, C.W. Bielawski, and R.S. Ruoff,
Chem. Soc. Rev. 39, 228 (2010).
3. V. Singh, D. Joung, L. Zhai, S. Das, S.I. Khondaker, and S.
Seal, Prog. Mater. Sci. 56, 1178 (2011).
4. C.M. Hassan and N.A. Peppas, Adv. Polym. Sci. 153, 37
(2000).
5. C. Bao, Y. Guo, L. Song, and H. Yuan, J. Mater. Chem. 21,
13942 (2011).
6. X. Yang, L. Li, S. Shang, and X.-M. Tao, Polymer 51, 3431
(2010).
7. H.-D. Huang, P.-G. Ren, J. Chen, W.-Q. Zhang, X. Ji, and
Z.-M. Li, J. Membr. Sci. 409, 156 (2012).
8. K.J. Ramalingam, N.R. Dhineshbabu, S.R. Srither, B.
Saravanakumar, R. Yuvakkumar, and V. Rajendran,
Synth. Met. 191, 113 (2014).
9. M. Han, J. Yun, H.-I. Kim, and Y.-S. Lee, J. Ind. Eng.
Chem. 18, 752 (2012).
10. A. Fahmy, M.A. Abu-Saied, E.A. Kamoun, H.F. Khalil, M.
Elsayed Youssef, A.M. Attia, and F.A. Esmail, J. Adv.
Chem. 11, 3426 (2015).
11. N.-W. Pu, C.-A. Wang, Y.-M. Liu, Y. Sung, D.-S. Wang, and
M.-D. Ger, J. Taiwan Inst. Chem. Eng. 43, 140 (2012).
12. Y. Jin, M. Jia, M. Zhang, and Q. Wen, Appl. Surf. Sci. 264,
787 (2013).
13. A. Ammar, A.M. Al-Enizi, M.A. AlMaadeed, and A. Karim,
Arab. J. Chem. (2015).
14. S. Stankovich, D.A. Dikin, R.D. Piner, K.A. Kohlhaas, A.
Kleinhammes, Y. Jia, Y. Wu, S.T. Nguyen, and R.S. Ruoff,
Carbon 45, 1558 (2007).
15. V. Loryuenyong, K. Totepvimarn, P. Eimburanapravat, W.
Boonchompoo, and A. Buasri, Adv. Mater. Sci. Eng. 2013
(2013).
16. G. Sobon, J. Sotor, J. Jagiello, R. Kozinski, M. Zdrojek, M.
Holdynski, P. Paletko, J. Boguslawski, L. Lipinska, and
K.M. Abramski, Opt. Express 20, 19463 (2012).
17. J. Zhang, H. Yang, G. Shen, P. Cheng, J. Zhang, and S.
Guo, J. Chem. Commun. 46, 1112 (2010).
18. T. Kuilla, S. Bhadra, D. Yao, N.H. Kim, S. Bose, and J.H.
Lee, Progr. Polym. Sci. 35, 1350 (2010).
19. T. Zhou, F. Chen, C. Tang, H.-W. Bai, Q. Zhang, H. Deng,
and Q. Fu, Compos. Sci. Technol. 71, 1266 (2010).
20. J. Chen, J. Huang, J. Li, X. Zhan, and C. Chen, Desalination 256, 148 (2010).
21. Q. Kang, J. Huybrechts, B. Van der Bruggen, J. Baeyens,
T. Tan, and R. Dewil, Sep. Purif. Technol. 136, 144 (2014).
22. Y. Li, R. Umer, Y.A. Samad, L. Zheng, and K. Liao, Carbon
55, 321 (2013).