DSpace at VNU: Pesticide residues in soils, sediments, and vegetables in the Red River Delta, northern Vietnam
Bạn đang xem bản rút gọn của tài liệu. Xem và tải ngay bản đầy đủ của tài liệu tại đây (203.86 KB, 9 trang )
Crop Protection 20 (2001) 897–905
Pesticide use in rice and rice–fish farms in the Mekong Delta, Vietnam
H(akan Berg*
Department for Research Cooperation (SAREC), Swedish International Development Cooperation Agency (Sida), SE-105 25 Stockholm, Sweden
Received 30 June 2000; received in revised form 5 January 2001; accepted 26 February 2001
Abstract
Pest management practices among rice and rice–fish farmers and their perception of problems related to pests and pesticides were
surveyed in the Mekong Delta. A total number of 64 different pesticides were identified during the survey. Approximately 50% were
insecticides, 25% were fungicides and 25% were herbicides. The main insecticides used were pyrethroids (42%) carbamates (23%)
and cartap (19%). Non-IPM farmers used twice as many pesticides as IPM farmers. Their application frequency and the amount of
active ingredient used were 2–3 times higher per crop, as compared to IPM farmers. During the last three years IPM farmers
estimated that they had decreased the amount of pesticides used by approximately 65%, while non-IPM farmers said that they had
increased the amount of pesticide used by 40%. Also, farmers growing fish in their rice fields used less pesticide than farmers
growing only rice, as pesticides adversely affect cultures of fish. Taking a long-term perspective integrated rice–fish farming with
IPM practices provides a sustainable alternative to intensive rice mono-cropping, both from an economic as well as an ecological
point of view. # 2001 Elsevier Science Ltd. All rights reserved.
Keywords: IPM; Rice–fish farming; Integrated agriculture; Pesticides; Mekong Delta; Aquaculture
1. Introduction
Production of rice has been intensified in Vietnam, to
meet the increasing food demand. Rice is planted on 7
million ha, which is more than 60% of the total farmed
area. 27.6 million tonnes were produced in 1997, having
increased by about 5% per year since 1990 (Anonymous, 1997). The intensified farming systems and
expanded area of rice has transformed Vietnam from
an importer of rice in 1989 to one of the top rice
exporters in 1997 (Anonymous, 1996, 1997). With these
changes, the amount of pesticides used increased from
20 000 tonnes in, for example, 1990 to 30 000 tonnes in
1994 (Quyen et al., 1995; Noda et al., 1998; Dung et al.,
1999).
The increased reliance on pesticides in rice production
has, in some areas, proved to be unsustainable and cost
ineffective due to pesticide-induced outbreaks of insect
pests, development of pesticide resistant pests, rising
cost of pesticide use, and the negative effects of pesticide
use on human health and the environment (Heong et al.,
1995; Pingali and Roger, 1995; Settle et al., 1996; Pingali
*Tel.:+ 46-8-698-5298; fax: +46-8-698-5656.
E-mail address: (H. Berg).
and Gerpacio, 1997). Prolonged misuse of pesticides
and fertilizers over the years has also halted the
development of inland fisheries and aquaculture (Moulton, 1973; Cagauan and Arce, 1992; Halwarth, 1995;
Abdullah et al., 1997).
In an attempt to reduce pesticide use, important
changes have taken place in strategic approaches to
plant protection. Integrated Pest Management (IPM)
methods have brought ecological principles and social
scientific perspectives into traditional crop management.
These ecology-based pest control methods have resulted
in markedly improved rice farming systems, which are
not only higher yielding but also more sustainable
(Stone, 1992; Settle et al., 1996; Noda et al., 1998; Huan
et al., 1999). In addition to this, increased adoption of
rice–fish farming, with fish as a natural control agent of
pest organisms, provides a promising alternative for
further developing ecological sound management strategies of the rice field environment (Cagauan, 1995a;
Dela Cruz, 1994; Halwarth, 1995, 1998).
This paper reports a survey of pest management
practices among rice farmers in the Mekong Delta, and
their perception of problems related to pests and
pesticides. The influence from the IPM programs is
evaluated by comparing pesticide use patterns of
0261-2194/01/$ - see front matter # 2001 Elsevier Science Ltd. All rights reserved.
PII: S 0 2 6 1 - 2 1 9 4 ( 0 1 ) 0 0 0 3 9 - 4
898
H. Berg / Crop Protection 20 (2001) 897–905
farmers with findings from earlier studies and by comparing the attitude and pest management strategies adopted
among non-IPM and IPM farmers in the area. The study
also addresses the extent to which integrated rice–fish
farming could encourage farmers to start with integrated
pest management practices and vice versa. A healthy
environment is a prerequisite for successful fish farming,
which should provide rice–fish farmers with strong
incentives to adopt integrated pest management strategies.
2. Methods
Use of pesticides among rice and rice–fish farmers in
the Mekong Delta, was analysed by interviews with 120
farmers from three different districts in the Can Tho and
Tien Giang provinces during the spring of 1999 (Fig. 1
and Table 1). All three districts are situated in major rice
producing areas of the Mekong Delta.
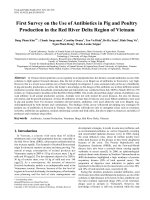
Fig. 1. Can Tho and Tien Giang are major rice producing provinces in
the Mekong Delta. Farmers were interviewed in the districts of Cai Be,
Go Cong Tay and O man.
Table 1
Some charactaristics of Go Cong Tay, Cai Be and O man in 1998a
Tien Giang
Area of district (ha)
Population size
Number of farmers
Number of rice farmers
Area of ricefields (ha)
Number of rice-fish farmers
Area of rice-fish farms (ha)
Crops per year
Yield of rice (ton)
Can Tho
Go Cong Tay
Cai Be
O mon
25 745
158 183
33 043
30 596
13 746
50
15
3
143 076
40 107
287 243
48 000
31 538
19 980
1500
1200
3
318 400
54 856
281 535
56 807
42 600
38 111
4500
4500
2–3
450 000
a
Pers. com. of Subplant Protection Department in Tien Giang
(My Tho).
2.1. Study area
The Vietnamese Mekong Delta covers an area of
39 000 km2, and is the most important agricultural
region in Vietnam (Fig. 1). Covering only 12% of
Vietnam’s total land area, it supplies half of the national
rice output (Noda et al., 1998). Approximately 400 000
ha of the Mekong Delta is suitable for freshwater
aquaculture, but less than 10% of the area is used for
this purpose (Halwarth, 1995; Duong et al., 1998) (cf.
Table 1). The climate is characterised as tropical semiequatorial with a mean temperature of 278C. The mean
annual rainfall is 1600 mm and approximately 90% of
the rain comes during the rainy season in May to
October (Xuan and Matsui, 1998).
The districts of Go Cong Tay (N 108400 , E 1068700 ),
and Cai Be (N 108300 , E 1068) represent two different
rice producing areas in the Tien Giang province (Fig. 1).
The area around Cai Be has a very good irrigation
system consisting of a network of many canals and
natural rivers (Ha, 1997). The first rice crop is from
November to February, the second crop from February
to May and the third crop is from May to August
(Ha, 1997).
Go Cong Tay lies in an area that is relatively higher
and has a much poorer irrigation system as compared to
the first area. The first rice crop is from November to
February, the second crop from May to August and the
third crop is from August to November (Ha, 1997).
The O mon district (N 108100 , E 1058600 ), which lies
in the Can Tho province, is also representative for the
irrigated rice areas of the Mekong Delta, in aspects of both
physical environment and productivity (Lai, 1998) (Fig. 1).
Rice is cultivated in the dry and wet seasons in double rice
system and in the dry, spring–summer and wet seasons in
the triple rice system. The rice yield is 4–5 tonnes per
hectare and crop for all three districts (Table 1).
2.2. Field sampling
In each district approximately 40 rice farmers were
interviewed. These farmers were categorised into four
groups: Rice (R) and rice–fish farmers (RF) without
IPM-methods and rice (RIPM) and rice–fish farmers
(RFIPM) with IPM methods. IPM farmers were
identified with the help of local Plant Protection staff,
as farmers who had attended Farmers Field Schools and
that applied some form of IPM methods. Each group
consisted of approximately ten farmers. As less than
10% of all farmers grow rice and fish in their field or
apply IPM methods these farmers were, thus, overrepresented in the study (Duong et al., 1998; Heong
et al., 1998; Huan et al., 1999) (cf. Table 1). In all
districts interviews were conducted with farmers who
had two or three crops per year, as these are the systems
with the heaviest use of pesticides.
899
H. Berg / Crop Protection 20 (2001) 897–905
A questionnaire in English was pre-tested by interviewing three farmers (not included in the study). After
this some changes were made in the questionnaire,
and tested again on an additional seven farmers.
Some minor changes were made before translating the
questionnaire into Vietnamese. The interviews were
conducted in co-operation with local extension officers
from each district, trained in agriculture and aquaculture. Before the interviews were conducted the
extension officers were informed on how to use the
questionnaire and smaller changes were made to fit
the local conditions in each district.
When finished, the questionnaires were checked and
translated into English by co-ordinators at regional
research institutes. Additional information was also
collected at extension offices and plant protection
stations in the districts. The data were analysed by
dividing the farmers into the four different categories
(R, RF, RFIPM, RIPM) in each district. If the answers
between districts were similar, they were aggregated into
the same category. Differences between categories were
investigated using analysis of variance (ANOVA) onefactor analysis.
3. Result
During the survey a total of 64 different pesticides
were identified. Approximately 50% were insecticides,
25% were fungicides and 25% were herbicides. Small
amounts of different rodenticides were also found
(Table 2).
The most common pesticide was validamycin, followed closely by two other fungicides, propiconazole
and hexaconazol (Table 2). The most common insecticides were fenobucarb, cartap and lambdacyhalothrin
(Table 2). Among the herbicides fenoxaprop-P-ethyl,
2,4D, pretilachlor and fenclorim were the most popular
(Table 2).
Rice farmers use the greater range of pesticides, while
rice–fish farmers with IPM use the least number of
pesticides (Table 3). In general, non-IPM farmers use
almost twice as many different pesticides as compared to
farmers applying IPM methods. Especially, the number
of insecticides used by non-IPM farmers was much
higher compared to IPM farmers (Table 3).
A majority of the farmers (>80%) thought that
pesticides are a problem for their health (Table 4, Points
4 and 5). The most common answer, is that they feel
tired after spraying. Other symptoms of health effects
are ‘‘hot’’ skin, dizzyness or headaches (Table 4, Point
6). Almost all farmers (85–100%) regarded insecticides
as the most problematic pesticide (Table 4, Point 7). In
Cai Be, lambdacyhalothrin, fenobucarb and delthamethrin were mentioned and in O man farmers were
concerned about endosulfan and carbofuran. Despite
Table 2
The 20 most common pesticides used by rice and rice–fish farmers in
Tien Giang and Can Tho provinces in 1999a
Pesticide
formulation
Active
ingredient
Fungicides (16)
Validacin
Tilt
Anvil
Fuji-one
Rovral
Bonanza
Validamycin A
Propiconazol
Hexaconazol
Isoprothiolane
Iprodione
Cyprocozol
9.6
8.4
8.0
4.4
3.8
1.9
Herbicides (15)
2, 4 D
Sofit
Tiller’s
4.1
3.9
3.6
Whip’s
Sirius
Cantanil
2, 4 D
Pretilachlor, Fenclorim
Fenoxaprop-P-Ethyl,
2,4 D, MCPA
Fenoxaprop-P-Ethyl
Pyrazosulfuron Ethyl
Butachlor, Propanil
Bassa
Padan
Karate
Decis
Applaud
Fastac
Regent
Trebon
Fenobucarb
Cartap hydrochloride
Lambdacyhalothrin
Delthametrin
Buprofezin, Isoprocarb
Alpha-cypermethrin
Fipronil
Etofenprox
Insecticides (33)
% use by
farmers
Others
Total (64)
a
2.6
2.2
1.9
6.0
4.4
3.8
3.6
3.4
2.4
2.2
2.0
18
100
Figures in brackets give the total number of pesticides found.
Table 3
Average number of different pesticides, used per farmer from Cai Be,
Go Cong Tay and O man in the Mekong Delta in 1999
Fungicides
Herbicides
Insecticides
Total
R
RF
RFIPM
RIPM
2.8
1.5
2.9
7.2
1.7
0.9
2.5
5.1
1.8
0.7
0.7
3.2
1.9
0.9
0.8
3.7
this, less than half of the farmers seem to take any action
to protect themselves from the pesticides (Point 8 in
Table 4), and it is possible that the hot climate decreases
the farmers willingness to wear any protective clothing.
Protection using, a mask or cloth over the face, are most
common among rice–fish IPM farmers (Point 8* in
Table 4).
The attitude to environmental effects from pesticides,
is less uniform among farmers. Generally, non-IPM rice
farmers seem to be quite unaware or unconcerned about
the environmental drawbacks of pesticides. The main
methods (>90%) used by these farmers to control pests
involve application of pesticides (Point 1 of Table 4).
The majority (80–100%) of the farmers have learned
how to use pesticides from other farmers or pesticide
retailers (Point 2 of Table 4). Some of these have a very
900
H. Berg / Crop Protection 20 (2001) 897–905
Table 4
Answers (% of famers) related to pests, pest control methods and their
effects among rice and rice-fish farmers in the Mekong Delta 1999
R
RF
RF IPM R IPM
1. Which methods do you use to control pests?
Pesticide
94
93
IPM
3
7
Resistant rice
3
0
varieties
No. answers
31
29
2. Where did you learn how to use
From plant protection staff
From other
farmers
TGa
From pesticide
shop/retailer
No. answers
the pesticide?
0
18
55
36
9
35
49
16
33
49
100
93
59
46
0
7
41
36
0
0
29
28
28
29
3. How often do you see plant protection staff (times/yr)?
average
1
2
6
stdv
1.1
2.1
3.8
4. Any problems related to pesticides that is important?
Cost of pesticide
53
34
19
Health effects
33
45
48
Environment
14
21
33
effects
No. answers
36
29
42
5. Have the pesticides been a problem for your health?
Yes
87
82
84
No
13
18
10
Do not know
0
0
6
No. answers
31
28
31
6. Kind of health problem from pesticide spraying?
Get tired
52
65
52
TG
Feel hot and
14
10
19
itchy
Ca
Feel dizzy
20
15
19
C
Get headache
14
10
10
No. answers
21
20
21
7. Which pesticides are a problem for your health?
Fungicides
3
0
Herbicides
0
8
Insecticides
97
92
No. answers
29
26
12
0
88
16
8. Do you use any protection when spraying?
Yes
33
37
No
67
63
No. answers
30
27
8*. % of yes Carrying a mask
10
20
9. Can pesticides have a negative effect on the yield
Yes
12
42
No
84
50
Do not know
4
8
No. answers
25
24
9*. If yes,
Pesticides are
100
50
why?
toxic to fish
Natural feed for
0
19
9
6.4
21
42
37
52
89
11
0
28
84
11
5
0
19
11
5
84
19
59
41
29
47
41
59
29
25
40
60
0
30
48
32
64
5
22
50
42
30
Table 4 (Continued)
R
the fish decrease
Fish growth
decrease
No. answers
RF
RF IPM R IPM
0
31
10
20
2
16
21
10
10. Do you know any natural enemies to pests in your field?
Yes
3
26
100
No
93
70
0
Do not know
3
4
0
No. answers
30
23
29
96
4
0
26
11. Which natural enemies do you know?
Spider
50
Beetle
50
Dragon fly
0
No. answers
2
67
33
0
3
38
36
26
47
12. What effect can pesticides have
Kill natural
enemies to pests
No effect
No idea
No. answers
4
74
27
41
35
24
37
on natural enemies to pests?
3
22
74
79
0
97
31
23
3
31
13. Can pesticides increase pests problems in your field?
If yes,
Increased no. of
15
19
37
how?
resistent insect
Decreased no. of
0
3
54
natural enemies
No
85
78
9
No. answers
27
27
35
14. How do you decide to spray?
According to
field survey
TG
Scheduled sprays
C
According to
other farmers
Other
No. answers
21
0
29
41
56
3
39
25
31
70
74
71
4
44
25
0
3
0
12
0
28
0
36
27
33
14
34
13
14
87
86
0
0
31
29
15. How do you select pesticide for pest control?
Pesticide that
91
78
can kill all pest
Pesticide that kill
3
11
only target pest
According to
6
11
other farmers
No. answers
31
27
16. Do you make changes in the ricefield before applying pesticides?
Yes
45
63
55
33
No
55
37
45
67
16*.% of yes Decrease water
78
75
92
71
level in ricefield
No. answers
20
19
22
21
?
17. Have you changed your use of pesticides during
Yes increased
93
65
use
Yes decreased
7
12
use
No
0
23
No. answers
29
26
the last 3 yr?
3
0
87
100
10
31
0
29
H. Berg / Crop Protection 20 (2001) 897–905
Table 4 (Continued)
R
RF
RF IPM R IPM
18. Which pesticides have increased/decreased most?
Increase Insecticide
50
70
Fungicide
28
17
Herbicide
18
0
Decrease Insecticide
4
13
Fungicide
0
0
Herbicide
0
0
No. answers
40
23
19. Why did you change your use of pesticides?
Increase Problem with
78
100
resistant pests
Increased
22
0
number of pest
Decrease Use IPM
0
0
No. answers
9
5
20. Which are the most problematic pests?
Diseases
25
Insects
75
Rats
0
Weeds
0
No. answers
36
21
69
10
0
29
3
0
0
65
16
16
31
0
0
0
70
9
21
33
0
0
0
0
100
8
100
8
40
50
7
3
30
55
31
10
4
29
24
44
56
41
21. Do you apply IPM? (if yes give example)
No insecticides
}
}
the first 40.days
Adjust pesticide
}
}
use to pest
infestation
Limit pesticide
}
}
use
No. answers
}
}
20
15
25
27
22. Would you like to start with IPM?
Yes
32
No
68
No. answers
28
63
37
24
}
}
}
}
}
}
38
44
18
57
31
12
49
31
20
16
51
59
23. Reason for applying/start with IPM?
Lower cost
43
Protect health
43
Protect the
14
environment
No. answers
14
a
TG refers to answers from farmers in TienGiang and C to farmers
in Can Tho.
poor knowledge of the use and properties of pesticides,
and widespread gaps in the knowledge of farmers and
unfavourable attitudes of farmers toward natural
methods of pest management have probably continued
to encourage pesticide use and misuse.
Most of the non-IPM rice farmers (84%) thought that
pesticides have no negative effect on the yield from their
fields (Point 9 of Table 4). Only a few knew about
natural enemies to pests (Point 10 of Table 4)and
consequently most were not aware that pesticides can
901
decrease the number of natural enemies (Point 12 of
Table 4) and thus increase the number of pests in their
field (Point 13 of Table 4). In 1994 farmers in Long An
were asked if they thought that killing of natural
enemies can cause more pest problems (Heong et al.,
1998). Only 27% of the farmers agreed to this statement.
After an information campaign about negative effects of
insecticides, approximately 80% of the farmers agreed
to this statement, implying that farmers had developed
stronger beliefs that a selective spraying of insecticides is
possible and can save money, protect the health and the
environment (Heong et al., 1998).
The ongoing IPM programme further shows that
improved ecological knowledge is an important tool for
changing farmers’ perception of pests and their management, resulting in increased understanding of natural
control mechanisms in the rice field ecosystem and, thus,
reduced use of pesticides (Points 10, 11 and 19 of
Table 4). IPM farmers receive comparatively large
support from the plant protection services on how to
use pesticides (Point 2 of Table 4) and meet local
extension officers much more frequently than non-IPM
farmers (Point 3 of Table 4). This not only helps them to
restrict their use of pesticides but probably also increases
their knowledge about negative side effects from
pesticides.
The majority of the IPM farmers (>70%), for
example, thought that pesticides can have a negative
effect on natural enemies of pests (Point 12 of Table 4)
and increase the number of pests in their fields (Point 13
of Table 4). Many IPM farmers are also aware that
pesticides may lead to pests that are resistant to
pesticides (Point 13 of Table 4). As a consequence, the
majority of the IPM farmers (>70%) base their decision
to spray on field observations and adjust their pesticide
applications according to the pest infestation level in the
rice field (Points 14 and 21 of Table 4). They also try to
use pesticides that only kill the target organisms (Point
15 of Table 4)and avoid using insecticides during the
first 40 days (Point 21 of Table 4), as earlier sprays can
increase pest problems in the field (Heong et al., 1998)
(Table 4, Fig. 2). In contrast, 80–90% of the non-IPM
farmers use brand spectrum pesticides (Point 15 of
Table 4). The majority of these farmers also applied
pesticides according to scheduled sprays, implying that
they sprayed whether or not pests were present. As a
consequence, non-IPM farmers apply pesticides more
frequently than IPM farmers. Non-IPM rice farmers,
for example, apply insecticides 3.2 times per crop on an
average and up to 8 times in extreme cases including
applications during the first 40 days (Fig. 2), while IPM
farmers only apply insecticides 0.6 times per crop
(Fig. 3, Table 5). Also, the amount of active ingredient
(a.i), applied per crop, is higher for non-IPM farmers
compared to IPM farmers (Table 6). This is not only
because the number of applications is higher (Table 5),
902
H. Berg / Crop Protection 20 (2001) 897–905
Table 6
Average dose (kg a.i./ha) of pesticides on the first rice crop among
farmers from Cai Be, Go Cong Tay and O man in the Mekong Delta in
1999
R
Fungicides
Herbicides
Insecticides
Total
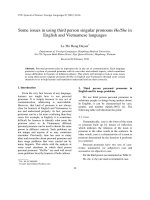
Fig. 2. Number of days between sowing and the first application of
insecticides among IPM and non-IPM farmers from Cai Be, Go Cong
Tay and O man in the Mekong Delta in 1999.
average
stdv
average
stdv
average
stdv
average
stdv
a
0.55
0.55
0.31a
0.27
0.93a
1.16
1.80a
1.22
RF
RFIPM
RIPM
0.29
0.45
0.20a
0.26
0.54b
0.53
1.04
0.73
0.27
0.45
0.17
0.30
0.13c
0.33
0.57
0.58
0.26
0.40
0.14
0.22
0.20b,c
0.50
0.60
0.66
Superscript letters in columns R, RF, RFIPM and RIPM denote
significant difference among farmers. Means that do not share the
same letter are significantly different (P50:05).
Table 7
Average number of pesticide applications on the first rice crop among
farmers from Tien Giang in 1994 (Ha, 1997) and 1999
1994
Fungicides
Herbicides
Insecticides
Total
1999
R
RIPM
R
RIPM
1.6
0.9
3.2
5.7
1.2
0.8
1.5
3.5
3.7
0.8
3.7
8.2
3.0
0.6
0.4
4.0
Fig. 3. Number of insecticide applications on the first rice crop among
IPM and non-IPM farmers from Cai Be, Go Cong Tay and O man in
the Mekong Delta in 1999.
Table 5
Average number of pesticide applications (no/ricefield) on the first rice
crop among farmers from Cai Be, Go Cong Tay and O man in the
Mekong Delta in 1999
R
Fungicides
Herbicides
Insecticides
Total
average
stdv
average
stdv
average
stdv
average
stdv
a
3.2
1.4
0.9
0.6
3.1a
1.5
7.2a
2.3
RF
RFIPM
RIPM
2.1
1.7
0.8
0.7
3.2a
2.0
6.1a
2.7
1.8
1.1
0.7
0.8
0.6
0.8
3.1
1.4
2.5
1.8
0.6
0.5
0.6
0.9
3.7
1.7
Superscript letters in columns R, RF, RFIPM and RIPM denote
significant difference among farmers. Means that do not share the
same letter are significantly different (P50:05).
but also because non-IPM farmers use a higher dose per
application compared to IPM farmers.
4. Discussion
The results from this study clearly show that IPM
farmers use much less pesticides than non-IPM farmers
do. Also, farmers growing fish in their rice field tend to
use less pesticides than farmers growing only rice, as
pesticides have a negative effect on aquaculture activities. Based on these results it is argued that rice farming,
integrated with fish and IPM practices in the long-term
provide an economic as well as ecologically sustainable
alternative to intensive rice mono-cropping.
Compared to 1994, the number of applications of
insecticides per rice crop in the Tien Giang province has
increased slightly among non-IPM farmers, but decreased threefold among IPM farmers (Table 7). The
number of fungicide applications has more than
doubled, while the number of herbicide applications
remains almost the same for both IPM and non-IPM
farmers (Table 7). In total, the number of applications
of pesticides has increased, especially among non-IPM
farmers, as compared to 1994.
During the last three years most (90%) non-IPM
farmers said that they had increased their use of
pesticides, mainly insecticides, by approximately 40%
(Table 4 (Points 17 and 18) and Table 8). This should be
compared to IPM farmers, where the majority (90–
100%) said that they had decreased their use of
pesticides, mainly insecticides, by 65% (Table 4 (Points
17 and 18) and Table 8). The most common reason for
the increased use of pesticides among non-IPM farmers
was that they experienced an increased number of
H. Berg / Crop Protection 20 (2001) 897–905
Table 8
Experience (number of years since starting with IPM methods) and its
effect on pesticide use and income among farmers in Cai Be, Go Cong
Tay and O man in the Mekong Delta in 1999
Cai be
Years of experience in IPM
stdv
Changed use of pesticides during
the last 3 yr (cf. Table 4, Pt. 17)
Average decrease for IPM
farmers (%)
stdv
Average increase for non-IPM
farmers (%)
stdv
Changed income since IPM
Percentage (number)
farmers with increase
Avarage increase in
income (%)
stdv
4.6a
1.4
Go Cong
Tay
O mon
4.0a,b
1.5
3.4b
1.4
85.0a
63.8b
40.2c
7.7
52.5a
20.6
41.9b
20.9
29.3c
12.7
15.9
13.2
100 (20)
100 (20)
86 (19)
18.8a
12.6b
6.5c
2.6
3.5
4.0
Superscript letters in the last 3 columns denote significant difference
among farmers. Means that do not share the same letter are
significantly different (P50:05).
Table 9
Main insecticides (in % applications) used by rice and rice–fish farmers
in the Mekong Delta 1992, 1997 (Huan et al., 1999) and 1999a
Insecticides
1992
1997
1999
Organochlorines
Organophosphates
Pyrethroids
Carbamates
Cartap
Phenylpyrazole
Others
1
43.9
14.7
32.1
6.5
n.a.
1.8
0.4
29.8
42
9.1
8.9
n.a.
9.8
1.6
2.8
41.6
23.0
19.2
4.1
7.7
a
n.a.}not analysed.
pesticide resistant insects in their fields (Point 19 of
Table 4), which is a well known consequence of the
overuse of pesticides (Pingali and Gerpacio, 1997; Settle
et al., 1996). As a result of the increased resistance,
farmers must find new pesticides. This, in turn, could
explain the comparatively large number of different
pesticides used by non-IPM farmers (Table 3). Due to a
lack of knowledge about these new chemicals and with
greater market liberalisation, there has been a tendency
towards the application of cheaper and sometimes more
hazardous pesticides with less conformity to the guidelines issued by the plant protection department (Quyen
et al., 1995).
Compared to insecticide use patterns in the Mekong
Delta in the 1992 and 1997 seasons (Huan et al., 1999)
the use of organophosphates has decreased while there
has been an increase in the use of pyrethroids,
carbamates and other active ingredients such as cartap
903
and phenylpyrazole (Table 9). These changes have
probably had an adverse impact on both human health
and the environment. Cagauan (1995b), for example,
ranked synthetic pyrethoids as more toxic to fish than
organophosphates, while carbamates were ranked as less
toxic to fish. Thus, although the overall impact from the
changed insecticide use patterns is difficult to assess,
these will most likely have a large impact on the shaping
of future farming systems (e.g. rice–fish farming) in the
Mekong Delta.
Due to their intense use of pesticides many non-IPM
farmers have become concerned about the high cost of
pesticides (Point 4 of Table 4) and production costs is a
strong incentive for the farmer to start with IPM (Point
23 of Table 4). Similar to the results of Heong et al.
(1998), the most important reason for farmers to
apply IPM, and thus reduce their pesticide use, is
savings in costs followed by reduction in health risks
and less pollution to the environment (Point 23 of Table
4). Thus, from the farmers point of view decreased use
of pesticides makes not only ecological sense but,
probably more important, also economic sense. On an
average, IPM farmers estimated that after applying
IPM, their income had increased by 13%. The largest
increase was found in Cai Be (19%), which coincided
with the largest decrease in pesticide use (Table 8).
Similarly, the smallest increase was found in O mon
(6.5%), where pesticide use had decreased the least
(Table 8). Thus, in the case of implementation of IPM,
economic incentives ‘‘pave the way’’ for ecologically
sound strategies.
In the perspective of increased economic benefits
based on improved ecological management, rice–fish
farming provides an interesting option for further
encouraging the adoption of integrated pest management in the Mekong Delta. There are many arguments
for fish farmers to reduce their use of pesticide.
Decreased pesticide use enhances fish farming practices
and the fish, in turn, can act as a natural control agent of
pest organisms (Cagauan, 1995a; Dela Cruz, 1994;
Halwarth, 1995).
In rice monoculture, the chance of pests reaching a
population level which economically justifies control
action is usually low (Halwarth, 1998). For a farmer
who stocks fish in his field, there is also a trade-off
between prevention of losses due to pests and the loss of
fish that may incur due to pesticides. Consequently, the
loss of fish has to be considered as an additional cost of
pest control (Waibel, 1992). Thus, the potential income
from fish shifts the economic threshold for applying
pesticides to a level which is even less likely to be
reached by pests (Halwarth, 1998). If costs associated
to health and environmental effects also are accounted
for by the farmer, his willingness to use pesticides
will decrease even further (Waibel, 1992). Rice–fish
farmers therefore tend to use less pesticides than
904
H. Berg / Crop Protection 20 (2001) 897–905
rice farmers (cf. Tables 5–7) and may increase their
income not only from decreased cost of pesticides, but
also from increased yield of fish. With savings on
pesticides and earnings from fish sales, it is no surprise
that twice as many rice–fish farmers wanted to take up
IPM methods compared to rice farmers (Point 22 of
Table 4).
Rice–fish farmers were more aware of the benefits
from a healthy rice field ecosystem than farmers growing
only rice. In all questions related to the environment, for
example, farmers culturing fish show a higher environmental awareness than do rice farmers (Table 4, Points
4, 9, 9*, 10 and 12). This is probably because farmers
culturing fish must pay attention not only to the rice
plant, but also to the whole rice field ecosystem to
succeed with their farming practices. This increases their
ecological understanding of the rice field ecosystem and
thus also their insight into potential negative side effects
of pesticides on non-target organisms. For example,
compared to rice farmers there were more rice–fish
farmers, who thought that pesticide could have a
negative effect on the yield from their field (Point 9 of
Table 4). Not only did the farmers think that the fish
growth and survival could be negatively affected, but
also that the natural food for the fish would decrease
(Point 9* of Table 4). Understanding that the fish is a
part of and, thus, depends on the whole rice field
ecosystem is a good incentive for the farmer to apply
ecologically sound pest control methods. This in turn
generates further insight into the complex interactions in
the rice field ecosystem, on which integrated pest
management strategies could be built. Many rice–fish
farmers have actually adopted integrated pest management strategies without being part of any integrated pest
management program. For example, non-IPM rice–fish
farmers make the first application of insecticides 40 days
after transplanting the rice plant, which is almost ten
days later compared to non-IPM rice farmers (cf.
Fig. 2). They also often decrease the water in their field
before applying pesticides (Point 16 of Table 4) and keep
it low for a longer period compared to rice farmers.
Also, from an IPM point of view, fish culture and rice
farming can be complementary activities because it has
been shown that fish in some cases reduce pest
populations (Halwarth, 1995, 1998). Evidence from the
FAO IPM Intercountry Program shows that, through
IPM and rice–fish farming practices, the number of
pesticide applications in rice can be reduced from 4.5 to
0.5 (Waibel, 1992). In this study rice–fish farmers with
IPM methods used the lowest number of different
pesticides (Table 3), used the lowest dose (Table 6) and
applied pesticides less frequently compared to the other
farmers (Table 5).
As mentioned earlier, this not only reduces costs but
also eliminates an important constraint in the adoption
of fish farming. An unpolluted environment is a
prerequisite for successful fish farming and the high
use of pesticides associated with the adoption of high
yielding rice varieties has been considered as a constraint
in the adoption integrated agriculture and aquaculture
in South-East Asia (Rudolfo and Arsenia, 1988;
Cagauan and Arce, 1992; Halwarth, 1995; Abdullah
et al., 1997). Therefore training in IPM for many
farmers participating in the regional programme in
Bangladesh, Indonesia, or Vietnam has been an entry
point to rice–fish farming (Halwarth, 1998). Fish farming activities would in turn probably motivate the
farmer to continue with IPM.
In conclusion, increased pressure to maintain high
levels of rice output for consumption and export has
resulted in increased use of pesticides on rice fields in the
Mekong Delta. The continued high use of pesticides is a
problem for farmers health and the environment. It is
also a constraint in the development of inland fisheries
and aquaculture. In order to minimise further damage,
alternative or redesigned methods of pest control must
be further implemented in the Mekong Delta. The IPM
program is an alternative pest and weed control
mechanism that is eco-friendly and facilitates natural
production yields. It enhances ecological awareness
among rice farmers and has probably broad and longlasting benefits compared to traditional plant protection
strategies, especially if integrated with aquaculture . The
use of fish in integrated pest management of rice fields
provides a promising alternative for further developing
ecologically sound management strategies of the rice
field environment.
Acknowledgements
This study was done with financial support from the
Swedish international development cooperation agency
(SIDA). Practical support was given by a number of
institutions in Southern Vietnam. Special thanks are
due to Mr. Ngoc Ngo Van, Dr. Nguyen Van Tu and
Dr. Bui Catch Tuyen at the University of Agriculture
and Forestry, Dr. Nguyen Thanh Phoung at the
Can Tho University and Dr. Hao, Dr. Zsigmond
Jeney and Mr. Nguyen Minh Thanh at the Research
Institute for Aquaculture No. 2. The author is also
grateful to a number of people working at the extension offices in Tien Giang and Can Tho, and to
all the farmers who patiently took part in the study.
Valuable comments were provided by two anonymous
referees.
References
Abdullah, A.R., Bajet, C.M., Matin, M.A., Nhan, D.D., Sulaiman,
A.H., 1997. Ecotoxicology of pesticides in the tropical paddy field
ecosystem. Environ. Toxicol. Chem. 16, 59–70.
H. Berg / Crop Protection 20 (2001) 897–905
Anonymous, 1996. Statistical Data of Agriculture, Forestry and
Fishery, 1985–1995. Statistical Publishing House, Hanoi.
Anonymous, 1997. Statistical Yearbook, 1997. Statistical Publishing
House, Hanoi.
Cagauan, A.G., 1995a. Overview of the potential roles of pisciculture
on pest and desease control and nutrient management in ricefields.
In: Symoens, J.J., Micha, J.C. (Eds.), The Management of
Integrated Freshwater Agro-Piscicultural Ecosystem in Tropical
Areas. Royal Academy of Overseas Science, Brussels, pp. 203–244.
Cagauan, A.G., 1995b. The impact of pesticides on ricefield vertebrates
with emphasis on fish. In: Pingali, P.L., Roger, P.A. (Eds.), Impact
of Pesticides on Farmer Health and the Rice Environment. Kluwer
Academic Publishers, Dordrecht, pp. 203–248.
Cagauan, A.G., Arce, R.G., 1992. Overview of pesticide use in rice–
fish farming in Southeast Asia. In: dela Cruz, C.R., Lightfoot, C.,
Costa-Pierce, B.A., Carangal, V.R., Bimbao, M.P. (Eds.), Rice–fish
Research and Development in Asia. International Center for
Living Aquatic Resources Management, Manila, Philippines, pp.
217–244.
Dela Cruz, C.R., 1994. Role of fish in enhancing ricefield ecology and
integrated pest management. ICLARM Conference Proceedings 43,
International Center for Living Aquatic Resources Management,
Manila.
Dung, N.H., Thien, T.C., Hong, V.H., Loc, N.T., Minh, D.V., Thau,
T.D., Nguyen, H.T.L., Phong, N.T., Son, T.T., 1999. Impact of
agro-chemical use on productivity and health in Vietnam. Economy
and environment program in South East Asia (EEPSA) Research
Report series. 1–65.
Ha, D.T., 1997. Pesticide productivity and efficiency of rice farmers in
alternative pest management practices in the Mekong Delta of
Vietnam. Ph.D. Dissertation, University of the Philippines Los
Banos, Laguna, Philippines.
Halwarth, M., 1995. Fish as biocontrol agents in rice. The potential of
common carp Cyprinus carpio and Nile tilapia Oreochromis niloticus.
Tropical Agroecology, Vol. 8. Hoenheim University, Weikersheim.
Halwarth, M., 1998. Trends in rice–fish farming. FAO Aquacult.
Newsletter 18, 3–11.
Heong, K.L., Cuc, N.T.T., Binh, N., Fujisaka, S., Bottrell, D.G.,
1995. Reducing early-season insecticide applications through
farmer’s experiment in Vietnam. In: Denning, G.L., Xuan,
V.T. (Eds.), Vietnam and IRRI: a Partnership in Rice Research.
International Rice Research Institute (IRRI), Manila, pp.
217–222.
905
Heong, K.L., Escalada, M.M., Huan, N.H., Mai, V., 1998. Use of
communication media in changing rice farmers pest management in
the Mekong Delta, Vietnam. Crop Prot. 17, 413–425.
Huan, N.H., Mai, V., Escalada, M.M., Heong, K.L., 1999. Changes in
rice farmer’s pest management in the Mekong Delta, Vietnam. Crop
Prot. 18, 557–563.
Lai, N.X., 1998. Classification of peasant economic systems: a case
study in O Mon, Can Tho provinces, Vietnam. In: Xuan, V.-T.,
Matsui, S. (Eds.), Development of Farming Systems in the Mekong
Delta of Vietnam. JIRCAS, CTU and CLRRI, Ho Chi Minh
Publishing House, Ho Chi Minh, pp. 147–180.
Moulton, T.P., 1973. More rice and less fish}some problems of the
‘‘Green Revolution’’ Australian Natural History. 17.
Noda, T., Loc, N.T., Van Du, P., 1998. Rice pest management in
the Mekong Delta. In: Xuan, V.-T., Matsui, S. (Eds.), Development
of Farming Systems in the Mekong Delta of Vietnam. JIRCAS,
CTU & CLRRI, Ho Chi Minh Publishing House, Ho Chi Minh,
pp. 271–287.
Pingali, P.L., Gerpacio, R.V., 1997. Living with reduced insecticide use
for tropical rice in Asia. Food policy 22, 107–118.
Pingali, P.L., Roger, P.A., 1995. Impact of Pesticides on Farmer
Health and the Rice Environment. Natural Resources Management
and Policy. Kluwer Academic Publishers, Dordrecht.
Quyen, P.B., Nhan, D.D., San, N.V., 1995. Environmental pollution in
Vietnam: analytical estimation and environmental priorities. Trends
Anal. Chem. 14, 383–388.
Rudolfo, G.A., Arsenia, G.C., 1988. Overview of insecticide use in
rice–fish farming in South East Asia. Paper presented at the rice–fish
farming workshop in Ubon, Thailand.
Settle, W.H., Ariawan, H., Astuti, E.T., Cahyana, W., Hakim, A.L.,
Hindayana, D., Lestari, A.S., Sartanto, P., 1996. Managing tropical
rice pests through conservation of generalist natural enemies and
alternative prey. Ecology 77, 1975–1988.
Stone, R., 1992. Researchers score victory over pesticide-and pests-in
Asia. Science 256, 1272–1273.
Waibel, H., 1992. Comparative economics of pesticide use in rice and
rice–fish farming. In: dela Cruz, C.R., Lightfoot, C., Costa-Pierce,
B.A., Carangal, V.R., Bimbao, M.P. (Eds.), Rice–fish Research and
Development in Asia. International Center for Living Aquatic
Resources Management, Manila, Philippines, pp. 245–254.
Xuan, V.-T., Matsui, S., 1998. Development of Farming Systems in the
Mekong Delta of Vietnam. JIRCAS, CTU & CLRRI, Ho Chi Minh
Publishing House, Ho Chi Minh.