DSpace at VNU: A PRELIMINARY STUDY ON THE SEPARATION OF NATURAL AND SYNTHETIC EMERALDS USING VIBRATIONAL SPECTROSCOPY
Bạn đang xem bản rút gọn của tài liệu. Xem và tải ngay bản đầy đủ của tài liệu tại đây (363.01 KB, 7 trang )
NOTES & NEW TECHNIQUES
A PRELIMINARY STUDY ON THE SEPARATION OF
NATURAL AND SYNTHETIC EMERALDS USING
VIBRATIONAL SPECTROSCOPY
Le Thi-Thu Huong, Wolfgang Hofmeister, Tobias Häger, Stefanos Karampelas, and Nguyen Duc-Trung Kien
More than 300 natural and synthetic emeralds
from various sources were examined with
Raman spectroscopy. Of this set, 36 KBr pellets
of different samples were also examined with
FTIR spectroscopy. In many cases, the presence
or absence of specific Raman and FTIR bands,
and the exact position of apparent maxima, are
correlated to the weight percentage of silicon
and/or alkali. This can help determine whether
an emerald is natural or synthetic.
exclusively (Huong et al., 2011), and some hydrothermal synthetic beryl that contains a small amount of
alkalis and can show a weak type II water Raman signal as well.
This article presents some additional differences
that could be used to distinguish between natural
and synthetic emeralds. These features, mostly generated by silicon- and/or alkali-related vibrations, include a Raman band at about 1070 cm–1 (Adams and
Gardner, 1974) and an FTIR band around 1200 cm–1
(Aurisicchio et al., 1994) and its shoulder at about
1140 cm–1.
BACKGROUND
See end of article for About the Authors.
GEMS & GEMOLOGY, Vol. 50, No. 4, pp. 287–292,
/>© 2014 Gemological Institute of America
Beryl—Be3Al2Si6O18—has a structure composed of
six-membered rings of [SiO4]4– tetrahedra. The silicate
rings are aligned precisely over one another, forming
open channels parallel to the c-axis of the crystal
(Huong et al., 2010). The diameter of the channels
has the capacity to hold large ions and molecules
such as alkalis (Na+, K+) and water (Goldman et al.,
1978; Aines and Rossman, 1984). Alkalis act as
charge compensators for the substitution of main elements such as Al3+ and Be2+. The ideal composition
of the main elements to match the exact stoichiometry of beryl is 67.0 wt.% SiO2, 18.9 wt.% Al2O3 , and
14.1 wt.% BeO. In beryl, Al3+ in octahedral sites and
Be2+ in tetrahedral sites are commonly substituted
with other elements including Cr3+, V3+, Fe3+, Fe2+,
Mg2+, Mn2+, Be2+, and Li+. Additionally, charge compensation by alkalis (including Cs, Rb, K, and Na)
and water in the ring channels diminishes the weight
% of Si in the formula. These additions affect the silicon-related vibrational signals.
Because growers of synthetic beryl follow the
exact stoichiometric formula, unlike nature, some
differences in silicon-related vibrations would be expected. Therefore, Raman and FTIR spectroscopy
could provide valuable information for assessing the
origin of emeralds (figure 1).
NOTES & NEW TECHNIQUES
GEMS & GEMOLOGY
B
oth vibrational Raman and FTIR spectroscopy
have been widely applied in identifying synthetic
and natural beryl (Wood and Nassau, 1968; Schmetzer and Kiefert, 1990; Huong et al., 2010). These
methods are used to characterize the water molecules present in the beryl channel sites, known as
type I and type II water molecules. Type I water molecules occur independently of alkalis, while type II
are associated with nearby alkalis. In most natural
beryl, Raman bands arising from both types are visible, though some natural beryls with relatively low
alkali present weak type II–related bands. Most hydrothermal synthetic samples display the Raman signal of type I water (the type II signal is barely visible
in most cases). Neither band is visible in flux-grown
synthetic beryl, which has no water in its structure
(Schmetzer and Kiefert, 1990). These methods are not
effective in cases such as relatively low-alkali natural
beryl, where the type I water band is observed almost
WINTER 2014
287
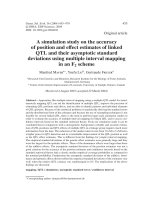
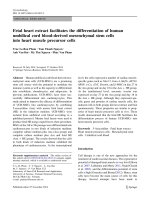
Figure 1. Representative
samples from this study
include faceted synthetic emeralds (Biron,
0.61 ct, 5.5 × 4.6 mm)
and natural emeralds
(Zambia, 0.48 ct, 6.5 ×
2.3 mm). Photos by
Nguyen Duc-Trung Kien.
MATERIAL AND METHODS
ple mixed with 200 mg of KBr). Peak analysis of both
Raman and FTIR results was performed with an
OriginLab Origin 7.5 professional software package,
and the peaks were fitted using a Gauss-Lorentz
function.
Chemical analysis of the same 36 samples was
carried out with electron microprobe for Si and laser
ablation–inductively coupled plasma–mass spectrometry (LA-ICP-MS) for all other elements studied.
Microprobe analyses were performed with a JEOL
JXA 8900RL instrument equipped with wavelengthdispersive spectrometers, using 20 kV acceleration
voltage and a 20 nA filament current. Silicon was analyzed by microprobe, with wollastonite used as the
We collected 326 natural and synthetic emerald
samples for Raman analysis. The natural samples
consisted of 260 crystals obtained directly from
mines in Brazil (20 from Santa Terezinha and 15
each from Carnaíba, Capoeirana, Itabira, and Socotó); Colombia (30 from Chivor); Austria (10 from
Habachtal); Russia (10 from the Ural Mountains);
Madagascar (30 from Mananjary); South Africa (30
from Transvaal); Zambia (30 from Kafubu); Nigeria
(30 from Gwantu); and China (10 from Malipo). The
66 faceted synthetic emeralds consisted of hydrothermally grown (15 Tairus and 10 Biron) and
flux-grown (20 Gilson, 20 Chatham, and 1 Lennix)
samples provided by the producers.
Raman spectra from 200 to 1200 cm–1 were collected with a Jobin Yvon (Horiba) LabRam HR 800
spectrometer equipped with an Olympus BX41 optical microscope and a Si-based CCD (charge-coupled
device) detector. All samples (except the faceted ones)
were polished on two sides, oriented parallel to the caxis. They were polished with corundum paste to obtain a smooth surface and ultrasonically cleaned with
acetone. The instrumentation used an Ar+ ion laser
(514 nm emission), a grating with 1800 grooves/mm,
and a slit width of 100 mm. These parameters, and
the optical path length of the spectrometer, yielded a
spectral resolution of 0.8 cm–1. The spectral acquisition time was set at 240 seconds for all measurements, and sample orientation was carefully
controlled. The electric vector of the polarized laser
beam was always parallel to the c-axis.
For FTIR measurements, we chose 36 samples (27
natural emeralds from various sources and 9 synthetics from different producers; see table 1). FTIR spectra were recorded in the 400–1400 cm–1 range by a
PerkinElmer 1725X FTIR spectrometer with 100
scans and 4 cm–1 spectral resolution using the KBr
pellet method (2 mg of powder drilled from each sam-
standard. For most elements, including silicon, the
detection limit for wavelength-dispersive (WD) spectrometers is between 30 and 300 parts per million
(ppm). The precision depends on the number of X-ray
counts from the standard and sample and the reproducibility of the WD spectrometer mechanisms. The
highest obtainable precision is about 0.5%.
288
GEMS & GEMOLOGY
NOTES & NEW TECHNIQUES
In Brief
• The presence or absence of Raman and FTIR bands,
and the exact position of apparent maxima, often correspond to the silicon and/or alkali content in natural
and synthetic emerald.
• The Raman band in synthetic emerald samples shows
an apparent maximum at 1067–1066 cm–1 and FWHM
between 11 and 14 cm–1. In natural samples, the apparent maximum ranges from 1068 to 1072 cm–1 and
FWHM varies from 12 to 26 cm–1.
• The FTIR band in synthetic emeralds shows an apparent maximum at about 1200–1207 cm–1, while natural
samples show an apparent maximum at about
1171–1203 cm–1.
WINTER 2014
RAMAN SPECTRA
onds, a dwell time of 10 milliseconds per isotope, a
100 µm crater diameter, and five laser spots averaged
for each sample. Silicon (determined with the microprobe) was used as the internal standard. Data reduction was carried out using Glitter software. The
amount of material ablated in laser sampling varied
in each spot analysis. Consequently, the detection
limits were different for each spot and were calculated for each acquisition. Detection limits for the
analyzed elements ranged between 0.0001 and 0.5
ppm. For trace elements such as Ta, La, Nb, and Y,
the detection limit was 0.0001 ppm. The detection
limit was 0.01 ppm for minor elements such as alkalis and 0.5 ppm for main elements, including Be and
Al. Analyses were calibrated using the NIST 612
glass standard. BCR-2G glass was also measured as a
reference material.
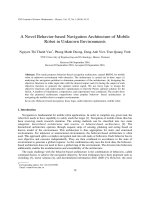
Synthetic (Biron)
INTENSITY (a.u.)
Natural (Zambia)
1060
1080
1100
1120
RAMAN SHIFT (cm–1)
Figure 2. The Raman peak of a representative natural
sample is at a higher wavenumber than that of a representative synthetic emerald sample.
RESULTS AND DISCUSSION
LA-ICP-MS quantitative analysis for all elements
except Si (including Li, Be, B, Na, Mg, Al, P, K, Ca,
Sc, Ti, V, Cr, Mn, Fe, Co, Ni, Ga, Ge, Rb, Sr, Y, Zr,
Nb, Mo, Cs, Ba, La, and Ta) was conducted using an
Agilent 7500ce ICP-MS in pulse-counting mode. Ablation was performed with a New Wave Research
UP-213 Nd:YAG laser ablation system, using a pulse
repetition rate of 10 Hz, an ablation time of 60 sec-
The Raman Peak at Approximately 1070 cm–1. Earlier studies attributed this peak to either Si-O
stretching (e.g., Adams and Gardner, 1974; Charoy et
al., 1996) or Be-O stretching in the beryl structure
(e.g., Kim et al., 1995; Moroz et al., 2000). Recent results have shown that this peak is mainly due to SiO stretching (Huong, 2008).
Figure 2 presents Raman spectra from 1050 to 1120
cm–1 for a hydrothermal synthetic emerald (Biron) and
a natural emerald (Kafubu, Zambia). The exact posi-
Colombia (Ch)
68
Nigeria (Gw)
China (Ma)
Brazil (ST)
Brazil (So)
Brazil (Cap)
Brazil (Cnb)
66
Si (wt%)
Brazil (Ita)
Russia (Ur)
Austria (Hbt)
Madagascar (Man)
Zambia (Kf)
64
South Africa (Tr)
30
Syn. flux (Lennix)
62
1068
Peak Po
s
NOTES & NEW TECHNIQUES
15
1070
ition (c
m –1)
1072
10
FW
HM
(
20
cm –1
)
Syn. flux (Gilson)
25
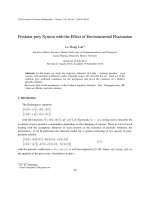
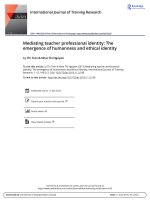
Figure 3. This diagram
shows the correlation
among FWHM, Raman
shift (peak position),
and Si (wt.%). Higher
Raman shifts and
FWHM values correspond to a lower wt.%
of Si.
Syn. flux (Chatham)
Syn. hyd. (Biron)
Syn. hyd. (Tairus)
GEMS & GEMOLOGY
WINTER 2014
289
68
Colombia (Ch)
Nigeria (Gw)
China (Ma)
67
Brazil (ST)
Brazil (So)
Brazil (Cap)
Brazil (Cnb)
66
Si (wt%)
Brazil (Ita)
Russia (Ur)
Austria (Hbt)
65
Madagascar (Man)
Zambia (Kf)
South Africa (Tr)
Syn. flux (Lennix)
64
Syn. flux (Gilson)
Syn. flux (Chatham)
Syn. hyd. (Biron)
63
62
-0.2
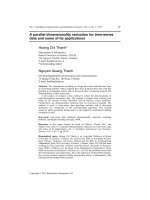
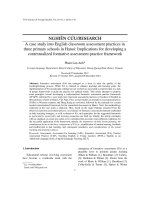
Figure 4. This diagram
shows the correlation
between silicon and alkali (Li+Na+K+Rb+Cs)
weight percentage
(wt.%) in natural and
synthetic samples. Samples with lower wt.% of
Si show higher alkali
wt.%.
Syn. hyd. (Tairus)
0.0
0.2
0.4
0.6
0.8
1.0
1.2
1.4
1.6
1.8
2.0
Alkali (Li+Na+K+Rb+Cs) (wt%)
tion and shape of the observed peaks differ. For the
synthetic sample, the apparent maximum is situated
at around 1067.5 cm–1, with a full width at half maximum (FWHM) of 12 cm–1. The apparent maximum for
the synthetic samples is positioned at 1067.0–1068.0
cm–1, and the FWHM varies between 11 and 14 cm–1.
There is no variation between the different growth
methods (hydrothermal vs. flux) or manufacturers regarding this peak (figure 3). The natural sample presented in figure 2 shows an apparent maximum at
approximately 1070 cm–1 and a FWHM of 18 cm–1. In
the natural samples, the apparent maximum ranged
from 1068 to 1072 cm–1 and FWHM varied between
12 and 26 cm–1 (with no clear difference among geographic origins; figure 3). The variation in the exact
position (shifting) and shape (broadening) of this peak
is probably due to the presence of at least two different
bands; the peak’s position and shape are linked to the
relative intensities of these bands. Peak position and
FWHM show overlap between some natural and synthetic samples (when the apparent maxima overlap at
1068 cm–1 and the FWHM at 12–14 cm–1). Thus, only
the natural samples have presented peak maxima
above 1068 cm–1 with a FWHM >15 cm–1, and only
synthetic emeralds have maxima at 1067 cm–1 with a
FWHM of 11 cm–1. When they are not within overlap
ranges, peak position and FWHM can help identify
natural and synthetic emerald.
Correlation diagrams of chemical composition
data, 1070 cm–1 Si-related Raman peak positions, and
FWHMs showed that the Si-O band broadened and
shifted to higher wavenumbers when the Si wt.% de-
creased (figure 3). The shifting and broadening of the
peak probably result from chemical substitution.
In figure 4, the correlation between Si and alkali
ion weight percentages is observed; samples with
lower than stoichiometric Si show high alkali wt.%.
As silicon is the main element in the beryl structure,
only a relatively significant decrease of silicon wt.%
(i.e., a relatively significant increase of alkali wt.%)
causes a detectable change in the Raman band properties. When the wt.% of silicon (as well as the sum
of alkalis) is significantly different (for example, up to
3 wt.% variance between natural and synthetic samples), the difference in band properties can be observed. When the silicon wt.% is more similar
(around 1 wt.% variance among natural samples; i.e.,
“low” alkali wt.%), the difference in band properties
is not visible. In “high-alkali” emeralds (>1.5% alkali
content), this band shifts at about 1069–1072 cm–1
(FWHM of 16–26 cm–1). In “low-alkali” emeralds
with <0.5% alkali content (e.g., Nigerian and Colombian) and in synthetic samples with <1.5% alkali content, these bands shift at about 1068–1070 cm–1
(FWHM of 12–18 cm–1) and 1067–1068 cm–1 (FWHM
of 11–14 cm–1), respectively.
290
GEMS & GEMOLOGY
NOTES & NEW TECHNIQUES
The 1200 cm–1 FTIR Absorption Band and Its Shoulder. This band was attributed to Si-O stretching in
the beryl structure (Aurisicchio et al., 1994). Figure
5 presents the FTIR absorption spectra of a synthetic
emerald (flux-grown, Gilson) and a natural emerald
(Ural Mountains, Russia) from 400 to 1600 cm–1 (see
inset from 1100 to 1300 cm–1).
WINTER 2014
TABLE 1. Chemical data of natural and synthetic
emeralds by electron microprobe (silicon content)
and LA-ICP-MS (alkali content).
Total alkalis
Li+Na+K+Rb+Cs
(wt.%)
Natural
Colombia/Chivor 1
65.272±0.333
0.330±0.024
Colombia/Chivor 2
66.134±0.081
0.355±0.030
Colombia/Chivor 3
65.609±0.392
0.521±0.041
Colombia/Chivor 4
65.921±0.312
0.683±0.031
Colombia/Chivor 5
65.306±0.284
0.405±0.053
Nigeria/Gwantu 1
66.254±0.168
0.208±0.021
Nigeria/Gwantu 2
66.188±0.056
0.142±0.018
Nigeria/Gwantu 3
64.986±0.409
0.230±0.041
Nigeria/Gwantu 4
65.755±0.220
0.208±0.035
Nigeria/Gwantu 5
65.820±0.081
0.238±0.052
China/Malipo 1
63.521±0.302
0.966±0.062
China/Malipo 2
63.914±0.472
1.116±0.036
Brazil/Santa Terezinha
63.245±0.221
1.591±0.041
Brazil/Socotó
64.306±0.162
1.809±0.032
Brazil/Capoeirana
64.109±0.093
1.657±0.081
Brazil/Carnaíba
64.287±0.178
1.819±0.032
Brazil/Itabira
63.410±0.254
0.914±0.011
Russia/Ural 1
63.823±0.213
1.760±0.070
Russia/Ural 2
64.521±0.243
1.850±0.021
Austria/Habachtal 1
64.470±0.151
1.567±0.072
Austria/Habachtal 2
62.719±0.083
1.585±0.045
Madagascar/Mananjary 1
63.554±0.412
1.116±0.017
Madagascar/Mananjary 2
64.209±0.244
1.629±0.029
Zambia/Kafubu 1
64.228±0.109
1.552±0.006
Zambia/Kafubu 2
63.523±0.372
1.611±0.012
South Africa/Transvaal 1
63.723±0.251
1.701±0.017
South Africa/Transvaal 2
63.178±0.222
1.872±0.045
Figure 5. The FTIR weak absorption band (see inset)
at around 1140 cm–1 is seen in natural samples with
high alkali content but not in synthetic samples. The
presence of this shoulder has not been reported by
previous studies. Other bands between 400 and 1100
cm–1 have been reported and assigned to the bondings
of main elements (i.e., Si, Al, and Be). The FTIR absorption spectra were acquired on KBr pellets of powdered emeralds.
FTIR SPECTRA
Ural
Gilson
1100
Synthetic (hydrothermal)
Biron 1
66.710±0.360
0.166±0.011
Biron 2
66.650±0.163
0.142±0.014
Tairus 1
66.489±0.214
0.067±0.009
Tairus 2
66.783±0.202
0.052±0.014
1200
1300
ABSORBANCE
Silicon
(wt.%)
Source
All synthetic samples showed an apparent maximum at around 1200 to 1207 cm–1, while natural
emeralds showed an apparent maximum at about
1171 to 1203 cm–1. This peak appears to consist of
more than one band, and its exact position and shape
are linked to the relative intensities of these bands. An
overlap of the apparent maxima was observed with
some low-alkali natural and synthetic samples from
1200 to 1203 cm–1. In addition, all high-alkali emeralds
displayed a shoulder at about 1140 cm–1. The shoulder
has not been reported in previous studies. Among lowalkali samples, this shoulder could be seen in Colombian samples (Chivor) but not in Nigerian emeralds.
Its exact position is also linked to the main peak position. The shoulder was not observed in any of the synthetic samples (again, see figure 5).
Correlating chemical data showed that the presence of the shoulder was also related to alkali content. In the samples with high alkali ion content, the
Synthetic (flux)
Gilson 1
66.391±0.101
0.041±0.003
Gilson 2
66.524±0.323
0.049±0.010
Chatham 1
66.830±0.272
0.171±0.019
Chatham 2
66.591±0.130
0.112±0.012
Lennix 1
NOTES & NEW TECHNIQUES
66.233±0.164
400
600
800
1000
1200
1400
1600
WAVENUMBER (cm–1)
0.033±0.005
GEMS & GEMOLOGY
WINTER 2014
291
shoulder at 1140 cm–1 was distinct. Moreover, the apparent maximum of the peak at 1200 cm–1 shifted to
lower wavenumbers. In samples with low alkali content, particularly synthetic samples, the shoulder disappeared and the apparent maximum at 1200 cm–1
shifted toward higher wavenumbers.
CONCLUSION
Natural and synthetic emeralds can sometimes be
distinguished by the apparent maxima and FWHM of
the silicon- and alkali-related Raman peak at 1070
cm–1. Using FTIR spectroscopy on KBr pellets of powdered samples, the distinction can sometimes be
made based on the silicon-related peak at 1200 cm–1,
as well as a shoulder, possibly linked to alkali con-
ABOUT THE AUTHORS
Dr. Le Thi-Thu Huong () is a lecturer in mineralogy and gemology at the Hanoi University of Science (Vietnam
National University). Dr. Hofmeister is the dean of the Faculty of
Chemistry, Pharmacy and Geosciences, and head of the Centre
for Gemstone Research, at Johannes Gutenberg University in
Mainz, Germany. He is also head of the Institute of Gemstone Research in Idar-Oberstein, Germany. Dr. Häger is senior scientist at
the Centre for Gemstone Research at Johannes Gutenberg Uni-
tent. Synthetic samples showed the Raman peak with
apparent maxima from 1067 to 1068 cm–1 (FWHM of
11–14 cm–1) and FTIR apparent maxima from 1200 to
1207 cm–1. In natural emeralds, the Raman band displayed the band in the same range, but with apparent
maxima from 1068 to 1072 cm–1, FWHM varying between 12 and 26 cm–1, and the FTIR band positioned
from 1171 to 1203 cm–1. All natural samples with high
alkali content display a shoulder at 1140 cm–1, while
synthetic emeralds do not. Low-alkali natural samples
from Colombia (Chivor) present this shoulder, but
Nigerian emeralds do not. For more precise conclusions, a larger number of samples—namely synthetics
with higher alkali content (>0.2%) and natural emeralds with lower alkali (<0.2%)—must be investigated.
versity, lecturer in the Gemstone and Jewellery Design Department at the University for Applied Sciences in Idar-Oberstein, and
managing director of the Institute of Gemstone Research in IdarOberstein. Dr. Karampelas is a research scientist at the Gübelin
Gem Lab in Lucerne, Switzerland. Dr. Nguyen Duc-Trung Kien is
a scientist at the Advanced Institute for Science and Technology,
Hanoi University of Science and Technology.
REFERENCES
Adams D.M., Gardner I.R. (1974) Single-crystal vibrational spectra
of beryl and dioptase. Journal of the Chemical Society, Dalton
Transactions, Vol. 1974, No. 14, pp. 1502–1505, />10.1039/dt9740001502.
Aines R.D., Rossman G.R. (1984) The high temperature behavior
of water and carbon dioxide in cordierite and beryl. American
Mineralogist, Vol. 69, No. 3–4, pp. 319–327.
Aurisicchio C., Grubessi O., Zecchini P. (1994) Infrared spectroscopy and crystal chemistry of the beryl group. The Canadian Mineralogist, Vol. 32, No. 1, pp. 55–64.
Charoy B., de Donato P., Barres O., Pinto-Coelho C. (1996) Channel occupancy in an alkali-poor beryl from Serra Branca (Goias,
Brazil): Spectroscopic characterization. American Mineralogist,
Vol. 81, No. 3–4, pp. 395–403.
Goldman D.S., Rossman G.R., Parkin K.M. (1978). Channel constituents in beryl. Physics and Chemistry of Minerals, Vol. 3,
No. 3, pp. 225–235.
Huong L.T.T. (2008) Microscopic, chemical and spectroscopic investigations on emeralds of various origins. PhD thesis, University of Mainz (Germany), 112 pp.
Huong L.T.T., Häger T., Hofmeister W. (2010) Confocal microRaman spectroscopy: A powerful tool to identify natural and syn-
thetic emerald. G&G, Vol. 46, No. 1, pp. 36–41, />10.5741/GEMS.46.1.36.
Huong L.T.T., Hofmeister W., Häger T., Khoi N.N., Nhung N.T.,
Atichat W., Arnond V.P. (2011) Aquamarine from the Thuong
Xuan district, Thanh Hoa province, Vietnam. G&G, Vol. 47,
No. 1, pp. 42–48, />Kim C., Bell M.I., McKeown D.A. (1995) Vibrational analysis of beryl
(Be3Al2Si6O18) and its constituent ring (Si6O18). Physica B: Condensed Matter, Vol. 205, No. 2, pp. 193–208, />10.1016/0921-4526(94)00290-C.
Moroz I., Roth M., Boudeulle M., Panczer G. (2000) Raman microspectroscopy and fluorescence of emeralds from various deposits. Journal of Raman Spectroscopy, Vol. 31, No. 6, pp.
485–490, />3C485::AID-JRS561%3E3.0.CO;2-M.
Schmetzer K., Kiefert L. (1990) Water in beryl: A contribution to
the separability of natural and synthetic emeralds by infrared
spectroscopy. Journal of Gemmology, Vol. 22, No. 4, pp. 215–
223.
Wood D.L., Nassau K. (1968) The characterization of beryl and
emerald by visible and infrared absorption spectroscopy. American Mineralogist, Vol. 53, No. 5/6, pp. 777–800.
292
GEMS & GEMOLOGY
NOTES & NEW TECHNIQUES
WINTER 2014
Copyright of Gems & Gemology is the property of Gemological Institute of America and its
content may not be copied or emailed to multiple sites or posted to a listserv without the
copyright holder's express written permission. However, users may print, download, or email
articles for individual use.