DSpace at VNU: Application of nitrogen-doped TiO2 nano-tubes in dye-sensitized solar cells
Bạn đang xem bản rút gọn của tài liệu. Xem và tải ngay bản đầy đủ của tài liệu tại đây (921.03 KB, 19 trang )
Accepted Manuscript
Title: Application of Nitrogen-doped TiO2 nano-tubes in
Dye-sensitized solar cells
Author: Vy Anh Tran Trieu Thinh Truong Thu Anh Pham
Phan Trang Ngoc Nguyen Tuan Van Huynh Antonio Agresti
Sara Pescetelli Tien Khoa Le Aldo Di Carlo Torben Lund
So-Nhu Le Phuong Tuyet Nguyen
PII:
DOI:
Reference:
S0169-4332(16)32853-7
/>APSUSC 34672
To appear in:
APSUSC
Received date:
Revised date:
Accepted date:
21-10-2016
13-11-2016
15-12-2016
Please cite this article as: Vy Anh Tran, Trieu Thinh Truong, Thu Anh Pham Phan,
Trang Ngoc Nguyen, Tuan Van Huynh, Antonio Agresti, Sara Pescetelli, Tien Khoa
Le, Aldo Di Carlo, Torben Lund, So-Nhu Le, Phuong Tuyet Nguyen, Application of
Nitrogen-doped TiO2 nano-tubes in Dye-sensitized solar cells, Applied Surface Science
/>This is a PDF file of an unedited manuscript that has been accepted for publication.
As a service to our customers we are providing this early version of the manuscript.
The manuscript will undergo copyediting, typesetting, and review of the resulting proof
before it is published in its final form. Please note that during the production process
errors may be discovered which could affect the content, and all legal disclaimers that
apply to the journal pertain.
Application of Nitrogen-doped TiO2 nano-tubes in Dye-sensitized solar cells
Vy Anh Trana, Trieu Thinh Truonga, Thu Anh Pham Phana, Trang Ngoc Nguyena, Tuan Van
Huynhb, Antonio Agrestic, Sara Pescetellic, Tien Khoa Lea, Aldo Di Carloc, Torben Lundd,
So-Nhu Lea, Phuong Tuyet Nguyena*
a
Faculty of Chemistry, University of Science, Vietnam National University, Ho Chi Minh City, Vietnam.
Faculty of Physics and Engineering Physics, University of Science, Vietnam National University, Ho Chi Minh
City, Vietnam.
c
CHOSE (Centre for Hybrid and Organic Solar Energy), Department of Electronic Engineering, University of
Rome Tor Vergata, Italy.
d
Department of Science and Environment, Roskilde University, DK-4000, Denmark.
b
Graphical abstract
Highlights
N-doped TiO2 nanotubes are synthesized by alkaline hydrothermal and reflux method
Formation of TiO2 nanotube morphology and anatase phase is shown by TEM, XRD, Raman
Coordination of NH4+ via Ti─O─NH4+ or H4N+─Ti─O bonds is indicated by FT-IR and XPS
Blocking effect of N-doped toward electron transfer on TiO2 anode is studied by CV
N-doped TiO2 improved DSC performance up to 30-40% mainly due to an increase in Jsc
Abstract
Our research aimed to improve the overall energy conversion efficiency of DSCs by applying nitrogen-doped
TiO2 nano-tubes (N-TNT) for the preparation of DSCs photo-anodes. The none-doped TiO2 nano-tubes (TNTs)
were synthesized by alkaline hydrothermal treatment of Degussa P25 TiO2 particles in 10M NaOH. The nanotubes were N-doped by reflux in various concentrations of NH4NO3. The effects of nitrogen doping on the
structure, morphology, and crystallography of N-TNT were analyzed by transmission electron microscopy
(TEM), infrared spectroscopy (IR), Raman spectroscopy, and X-ray photoelectron spectra (XPS). DSCs
fabricated with doped N-TNT and TNT was characterized by J-V measurements. Results showed that nitrogen
doping significantly enhanced the efficiency of N-TNT cells, reaching the optimum value (η = 7.36%) with 2M
nitrogen dopant, compared to η = 4.75% of TNT cells. The high efficiency of the N-TNT cells was attributed to
increased current density due to the reduction of dark current in the DSCs.
Keywords: Dye-sensitized solar cell, TiO2 nano-tubes, N-doped TiO2, TiO2 surface modification, dark current.
1. Introduction
In the last decade, the dye-sensitized solar cell (DSC) has extensively been studied all over the world because of
its significantly lower manufacturing cost in contrast to other solar devices such as silicon cells [1-3]. However,
the light to electricity conversion efficiency of DSCs are still too low compared with silicon solar cells and need
to be improved [3]. Dark current, which is the recombination of the injected electrons from the TiO2 semi-
conductor to the oxidized dye or oxidized form of the mediator in the electrolyte, is one of factors limiting the
efficiency of DSCs. Dark current thus should be minimized in order for the performance of DSCs to improve.
Many groups have applied different methodologies to enhance the efficiency of DSCs, such as preparation of
photo-anodes from various nano-structured materials (nano-particles, nano-wires, nano-fibers and nano-tubes)
[4, 5]. Another approach is to modify the TiO2 surface using metals or non-metal elements [6-8]. C. Kim et
al.[6] reported that Cr-doped TiO2 photo-anodes decreased the dark current in DSCs. They obtained an energy
conversion efficiency of 8.4% in Cr-doped TiO2 DSCs incomparison with 7.1% in non-doped DSCs. In 2010,
M. Grätzel et al.[7] modified TiO2 photo-anodes by doping it with Nb. The DSCs with the dopant concentration
of 0.5 M achieved an increase in the energy conversion efficiency from 7.4 to 8.1%. They attributed this
improvement to the retardation of the electron back reaction to tri-iodide. Investigations by T. Ma et al. [9] have
shown that the efficiencies of DSCs using N-doped TiO2 electrodes have been significantly improved by 44%
and 17% compared to commercial TiO2 P25 and pure anatase TiO2 electrodes, respectively. They used dry and
wet methods with ammonia and nitrogen flow as nitrogen dopants to synthesize the nano-particles for the
preparation of N-doped TiO2 electrodes. Differently, H. Y. Kim et al.[5] used an electro-spinning process and a
hydrothermal method to synthesize N-doped TiO2 nano-fibers with urea as nitrogen dopant. Their N-doped TiO2
nano-fibers achieved an energy conversion efficiency of 4.7%, markedly higher than the efficiency of 1.6%
obtained from DSCs prepared with none-doped nano-fibers. Both T. Ma and H. Y. Kim proposed that the
improvement in photovoltaic performance was due to the enhanced electron injection, longer electron lifetime,
and the retardation of the charge recombination. However, both studies did not investigate the influence of
various dopant concentrations and optimum conditions of product synthesis were not reported. Moreover, the
presence of doped Nitrogen in the TiO2 was not identified clearly. Differently to the aforementioned work, we
have introduced NH4NO3 as a new nitrogen dopant at various concentrations, ranging from 0 to 3 M, to
synthesize N-doped TiO2 nano-tubes. By combination of alkaline hydrothermal treatment of Degussa P25 TiO2
particles followed by reflux of the synthesized nano-tubes in aqueous solutions of NH4NO3, we have
successfully synthesized N-doped nanotubes TiO2 according to the synthetic scheme illustrated in Scheme 1.
The morphology, TiO2 phases and N-doping of the nano-tubes after undergoing the synthetic steps in Figure 1
were characterized by transmission electron microscopy (TEM), infrared spectroscopy (IR), Raman
spectroscopy and X-ray photoelectron spectra (XPS). Cyclic voltammetry (CV) was used to measure the
electrode kinetics between the N-doped TiO2 photo-anodes and 1,4-dicyanophthalene to determine the charge
resistance and electron life times in the TNT and N-TNT DSC. Our results showed that N-TNT significantly
enhanced the performance of the DSCs. Our data suggest that this improvement is due to a reduced dark current
and longer electron life-time in the photo-anode TiO2 layer. Optimum NH4NO3 dopant concentration of 2M was
found to produce the highest performing DSCs.
2. Experimental section
2.1 Preparation of TNT and N-TNT powder
The alkaline hydrothermal treatment was utilized to prepare the TNT. About 2.0 g of Degussa P25 TiO2 were
dispersed in sodium hydroxide solution (10M) and ultra-sonicated for 30 min. The nano-particles develop first
into Titanate sheets followed by rolling into nano-tubes [10]. The alkaline was transferred to a 70mL stainless
steel autoclave container, tightly sealed, and heated at 140 0C for 18 h. Finally, the mixture was filtered by filter
papers and repeatedly washed with distilled water until the pH of the solution was 7. The N-TNT and TNT were
prepared by reflux method as follows. The nano-tubes obtained from the first step were dispersed in an aqueous
NH4NO3 solution at various concentrations of 0, 0.5, 1, 2, and 3 M followed by 3 hours reflux. Finally, the solid
was filtered by filter papers and repeatedly washed with distilled water until constant pH was achieved, and then
was dried at 1000C for 24 h. The obtained powders were labeled as follows: TNT powder (TO), N-doped TNT
0.5M (NTO-0.5), N-doped TNT 1M (NTO-1), N-doped TNT 2M (NTO-2), N-doped TNT 3M (NTO-3).
2.2 Preparation of TNT and N-TNT pastes
A mixture of polyethylene glycol (PEG) (Merck, average MW of 200,000 g/mol), terpinol (Fluka), ethyl
cellulose 10% (Fluka) and Triton X-405 (DOW) were added to 0.4 g of N-doped or none-doped TNT in
absolute ethanol. The solution was simultaneously stirred and ultra-sonicated for 6 h, followed by stirring for 96
h. Finally, the solvent was slowly evaporated by rotary evaporation. The obtained pastes were named as follows:
TNT paste (PTO), N-doped TNT 0.5M (PNTO-0.5), N-doped TNT 1M (PNTO-1), N-doped TNT 2M (PNTO2), N-doped TNT 3M (PNTO-3).
2.3 Characterization of the nano-tubes
The surface structure and morphology of the TNT and N-TNT were studied by transmission electron
microscopy (TEM, JEM-1400 (Japan)). The crystalline phases of the TNTs electrodes were analyzed by X-ray
diffraction (XRD-d8 Advance) at a scanning rate of 2.250/min from 2θ = 200 to 800. To determine the presence
of nitrogen, the Fourier transmission infrared spectroscopy (FTIR) measurements were performed in
transmission mode (Bruker Tensor 37). The surface area of N-TNT was measured by a BET (Brunauer-EmmettTeller) analysis performed on a Quantachrome Instrument version 11.0 with an outgas time of 1 h.
Raman spectra were performed using a Jobin-Yvon-Horiba micro-Raman system (LabRAM ARAMIS)
equipped with Ar + ion laser (514 nm) as the excitation source. The Horiba micro-spectrometer was coupled with
a confocal microscope that allows the spatial resolution of the sample through a detector pinhole aperture. The
cut-off from the notch filters in the spectrometer is less than 100 cm -1. The laser light reached the sample surface
at normal incidence by means of ultra-long working distance (50X) objective with 10.5 mm focal distance. The
scattered radiation was collected in a backscattering geometry [11]. Subtraction of the fluorescence background
on the Raman spectra was performed by a polynomial fitting, while spectral de-convolution was carried out by
nonlinear least-squares fitting of the Raman peaks to a mixture of Lorentzian and Gaussian line shapes,
providing the peak position, width, height, and integrated intensity of each Raman band. The spectrometer is
equipped with a diffraction grating of 1800 lines/mm coupled to a CCD camera.
To characterize the surface atomic composition and chemical environment of elements at the surface of TNT, Xray photoelectron spectra (XPS) was obtained by a Kratos Axis Ultra-DLD spectrometer (Kratos Analytical Ltd,
UK) equipped with a hemispherical analyzer and a microfocussed (analysis area was 300 × 700 μm2)
monochromatized radiation Al Kα line (1486.6 eV) operating at 150 W. The spectrometer pass energy was set
to 160 eV for survey spectrum and to 20 eV for high resolution spectra of the elements of interest. Surface
charging was minimized using an electron flood gun. All the binding energies were referenced to the C 1s peak
at 285.0 eV originating from the surface carbon contamination. A nonlinear Shirley-type background [12] was
used to analyse core peaks. The quantification of surface composition was based on Scofield’s relative
sensitivity factors [13].
2.4 Cyclic voltammetry
The conductive glass plates (Pilkington – 8Ωcm-2) were cleaned with ethanol and were dried at 100 °C. A layer
of TNT or N-TNT paste with a circular surface area of 0.38 cm2 (d = 6.1 mm) was doctor bladed on the
conducting side of the glass substrate.. The plates were sintered for 30 min at 500°C. Electrodes used for CV
were carefully covered with Kapton polyimide tape (DuPont, USA) on the bare FTO areas surrounding the
active electrode area. The electrodes were used as working electrodes in a standard three-electrode
electrochemical setup in combination with a VersaSTAT3-100 potentiostate (Princeton Applied Research) to
obtain cyclic voltammograms of 1,4-dicyanonaphthalene (0.5 mM) in acetonitrile with tetrabutylammonium
tetrafluoroborate (0.1 M) as supporting electrolyte [14].
2.5 Fabrication of dye-sensitized solar cells (DSC)
The FTO conducting glass (Solaronix, sheet resistance: 8 Ω/cm 2) was first cleaned in a detergent solution, and
then rinsed with distilled water and ethanol. The FTO glass plates were immersed in a 40 mM aqueous TiCl4
solution at 70oC for 30 min and washed with distilled water. The prepared TiO2 paste was coated onto the FTO
glass with the area of 0.25 cm2 by doctor blading. Then the thin film was sintered at 500oC for 30 min. After
that, the TiO2 electrode was immersed into a dye solution consisting of 0.5 mM ruthenium 535 bis-TBA (N719,
Solaronix) in methanol at room temperature for 24 h. The dye-adsorbed TiO2 electrodes were rinsed with
methanol and dried in an argon flow.
A counter electrode was formed on the opposite glass plate prepared by spreading Pt-catalyst T/SP (Solaronix)
by doctor blading. The counter electrode was sintered 30 min at 450 oC. The two glass substrates were
assembled into a cell using the polymeric sealant Surlyn ® 1707 (DupontTM). Finally, the cell was filled with the
electrolyte comprised of 0.05 M I2, 0.1 M LiI, 0.6 M tetrabutylammonium iodide, and 0.5 M 4-tertbutylpyridine in 3-methoxypropionitrile, and the filling holes were sealed with Surlyn®. Each experiment
produced 5 to 7 DSCs.
2.6 J-V characterization of DSC
Photovoltaic measurements of DSCs were performed under the solar simulator AM 1.5 (100 mWcm -2) using a
450-W xenon lamp and a power source calibrated with amorphous-Si standard. DSCs were masked with a 0.25
cm2 active area of the anode electrode. The current–voltage (J–V) characteristic of the cell was analyzed using a
model 2400 digital source meter (Keithley, USA). The method includes applying an external bias under the
given illumination conditions and measuring the generated photocurrent.
3. Results and discussions
3.1 Morphologies of TNT and N-TNT
The morphologies of the TNT, N-TNT powder and paste were characterized by transmission electron
microscopy (TEM). As shown in Figure 1, all the nanocrystal TNT, N-TNT tubes before and after paste
fabrication are of equal size with diameters of 7-10 nm. As seen from Figure 1, the concentration of the
NH4NO3 dopant did not influence the diameters of the nano-tubes. The lengths of the N-doped tubes, however(Figure 1b, 1c and 1d) had nano-tubes with shorter length compared to the TNT, most likely resulted from the
refluxing process The PNTO-2 sample consists of TiO2 in its anatase phase as described later, and the BET
surface area was found to be 496 m2g-1. The surface area of PNTO-2 was higher than normal surface area of
TiO2 nano-tubes of 300 – 350 m2g-1 [15].
3.2 FTIR analysis
The FTIR spectra of TO and NTO-2 are showed on Figure 2. Consistent with previous reports of other groups,
our result showed the stretching vibration of the hydroxyl groups from 3000 to 3600 cm-1 , the bending vibration
of adsorbed H2O molecules 1600 cm-1 [5, 9, 16]. The spectrum of NTO-2 showed a strong peak at 1400cm-1
which may be assigned to the NH4+dopant ion [17] while the peak is absent in TO. These data clearly showed
that the nano-tubes were nitrogen doped by the NH4NO3 reflux treatment by coordination of NH4+ ion on the
surface of TiO2.
3.3 Raman analysis
Raman spectroscopy was used to investigate the phase transformation of the titanium dioxide after the
hydrothermal base and NH4NO3 treatments shown in Scheme 1 and to verify the effect of nitrogen doping after
the calcination process. As expected, Raman spectrum acquired on calcinated undoped PTO sample (Figure 3A)
greatly differs from the pure anatase spectrum carried out on calcinated doped samples (Figure 3B).
In particular, Raman spectrum of the calcinated PTO sample (Figure 3A) showed nine bands that can be
attributed to sodium trititanate, Na2Ti3O7, as the major phase for temperatures up to 500°C [16]. The band at 143
cm-1, 195 cm-1 and 380 cm-1 can be confidently ascribed to the Eg(1), Eg(2) and B1g(1) vibrations of TiO2 anatase
[18]. The presence of anatase bands is not expected for pure Na 2Ti3O7 nanotubes and can be explained by
considering the effect of washing steps with deionized water and/or the effect of refluxing process in pure water
after the hydrothermal treatment. In fact, as detailed by E. Morgado Jr. and co-.worker [19], titanate nanotubes
synthesized by hydrothermal treatment (TiO2 powder dispersed in 10 M sodium hydroxide solution) consisted
of a trititanate structure with general formula Na xH2−xTi3O7·nH2O, where 0
first, suspended with deionized water, and again filtered and washed repeatedly until pH of the filtrate is near 7–
8. Thus, since we applied the same nanotubes fabrication procedure, the ion exchange of interlayer Na + cations
with H+ ions during the washing step can likely support the Na1.2H0.8Ti3O7·0.8H2O structure for the PTO
sample.
A similar effect was reported by A. Gajovic et al. [16] when hydrochloric acid (HCl) is gradually added to the
trititanate nanotube suspension (the authors prevent the exchange of Na + ions with H+ ions from water by using
pure ethanol during the washing step). The author investigated the Raman spectra of nanotubes differing each
other in the N(Na)/N(Ti) ratio. In particular they reported Raman band values for the H1.3Na0.7Ti3O7nH2O
spectrum that are in very good agreement with those reported in Figure 3A by confirming the protonated form
of TNT. Consequently, due to the protonated form of TNT, the presence of anatase phase can be confidently
ascribed to a very small amount of nanotubes transformed to anatase structure during the processes of ion
exchange as already described by ref [13].
In fact, the higher is the amount of Na+ cations replaced by H+ ions the more instable is the trititanate phase and
the lower is the sintering temperature to form anatase phase [19]. Furthermore Nian and co-worker [20]
demonstrated that during the refluxing process nucleation and crystallization of TiO2 would be expected after
the nanotube destruction; the crystal growth might also be governed by kinetics, rather than thermodynamics,
thus leading to the formation of the metastable anatase. That can further explain the presence of a little amount
of TiO2 anatase phase for the undoped nanotubes due to the refluxing process in pure water. Following with the
description of Raman spectrum reported in Figure 3A, the band at 284 cm-1, 448 cm-1 and 671 cm-1 were
assigned to Ti–O [21] Ti–O–Ti [22] and Ti–O–Na [23] vibrations respectively.
Moreover, the two bands at higher wavenumber (823 cm -1, 917 cm-1) were assigned at the covalent Ti–O–H
vibration and Ti–O–Na vibrations in the interlayer regions of the nanotubes walls [22, 23] respectively. On the
other hand, the band at 548 cm-1 can be imputed to a residual TiO2 II phase indicating that some of TiO2 II were
not transformed completely into nanotubes [16]. Thus we can conclude that calcinated none-doped samples
exhibited the Na1.2H0.8Ti3O7·0.8H2O nanotube structure by confirming the TEM images reported in Figure 2.
The Raman spectra of sintered N-TNT obtained by using different doping concentration during the refluxing
stage are reported in Figure 4B. All the spectra exhibit the typical features of TiO2 anatase phase at 146 (Eg(1)),
196 (Eg(2)), 396 (B1g(1)), 514 (B1g(2)/A1g), and 641 (Eg(3)) cm-1, in agreement with the frequencies reported in
literature [24], by testifying that no structural change has been made in the materials since the typical rutile
peaks are absent.
The N-doping onto TNT is clearly observed by a broadening of the main anatase bands and in a blue shift of the
Eg(1) mode as magnified in the inset of Figure 3B. In fact, as extensively reported in literature [25-28] the
introduction of dopant atoms generates oxygen vacancies that will disturb the Ti–O–Ti bond resulting in the
shifting of the Eg(1) peak towards higher wavenumbers. In particular the higher is the doping concentration the
larger is the Raman blue shift of the Eg(1) peak that moves from 144.9 cm-1 for PNTO-0.5 up to 146.8 cm-1 for
PNTO-3.
Furthermore, the different molar concentration of NH4NO3 produced a different deformation of the spectra in the
400-800 cm-1 region, leading to an increase in the signal of minima between them, as previously observed in
literature [25, 29, 30].
The effect was particularly evident when 2M concentration of dopant was used during the refluxing process by
suggesting more efficient nitrogen doping of TNT. In fact, since the charge transfer process in DSCs from dye
molecules to titania has been already demonstrated to deform TiO2 anatase spectrum [31-33], a marked
enhancement of the minima signal in the anatase Raman spectrum can be confidently ascribed to a modification
of electronic level of TiO2, due to the nitrogen doping of the surface. During the refluxing process, the ion
exchange of interlayer Na+ cations with NH4+ creates a favorite starting point for the titanate nanotube to be
transformed into anatase TiO2 nanotubes as demonstrated by the Raman spectrum of calcinated N-doped
samples shown below. In particular, for complete DSCs employing N-TNT 2M photo-electrode, the modified
electronic TiO2 structure results a reduced dark current, due to a decreased back electron-transfer efficiency
from the TiO2 conduction band and the electrolyte redox potential of the I-/I3- couple, by increasing the overall
short current density JSC.
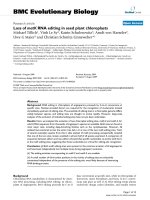
3.4 XPS analysis
The relative concentration and chemical environment of N, O, Ti and C atoms on the surface of the materials
were monitored by XPS (Table 1).
The high resolution scan of the C region showed that the C 1s core peaks corresponding to the surface
contamination carbon could be de-convoluted into three peaks. These are the main peak at 285.0 eV associated
with C–C or C–H bonds, the peak at 286.6 eV with C–O bonds and the peak at 290.0 eV with O=C–O bonds.
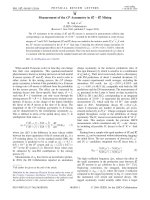
As shown in Figure 4a, due to spin-orbit coupling, the Ti 2p spectrum of two samples consists of two Ti 2p
components, Ti 2p3/2 and Ti 2p1/2, followed by charge-transfer satellite peaks at ~13 eV above the 2p3/2 peak
position. It could be observed that the Ti 2p3/2 peaks show a slight deformation, which can be decomposed into
two peaks, a main peak at around 458.7 eV, characteristic of Ti 4+ ions in TiO2 [34, 35] and a minor peak at
around 457.0 eV attributed to Ti3+ [36, 37]. The calculation of Ti3+2p3/2/Ti4+2p3/2 (Ti3+/Ti4+) atomic ratios
clearly demonstrated the increase of Ti3+ amount on the surface (Ti3+/Ti4+ = 0.026 for TiO2 and Ti3+/Ti4+ = 0.036
for N-TiO2) when TiO2 was doped with Nitrogen (NTO-2). Figure 4b exhibits the asymmetric N 1s core peak of
NTO-2 sample which can be de-convoluted into two components. The first component (NI) at 399.9 eV was
assigned to the substitutional nitrogen atom replacing one O atom of the TiO 2 lattice [38], forming the N-Ti-O
structure [39]. The second component (NII) at 402.6 eV corresponded to NH4+ ions on the TiO2 surface [40].
The appearance of these peaks confirmed that TNTs were successfully doped by N in our study.
The O 1s core peaks (Figure 4c) of TO and NTO-2 showed an asymmetric peak which can be decomposed into
a main peak (OI) at ~ 530.3 eV, assigned to oxygen atoms of TiO2 lattice, and various minor peaks at higher
binding energies. The first minor peak (OII) at 531.7 eV was attributed to the oxygen vacancies-Ti3+ surface
state [41], which is also supported by the presence of Ti3+ 2p3/2 peak in our samples.
Table 1 clearly shows the increase of atomic OII percentage with the increase of Ti3+ amount. This proves that
Ti3+ ions on our sample surface exist in the form of oxygen vacancies-Ti3+ states [42]. The second minor peak
(OIII) at ~ 532.8 eV was assigned to the surface hydroxyl groups [43]. Based on the percentage calculations, it
was also observed that N doping can enhance the surface hydroxyl groups on TNT. Furthermore, a weak O 1s
peak at 535.6 eV for TO, which may assigned to some C-O bounds, was also found.
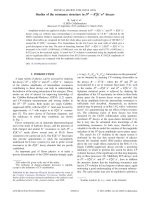
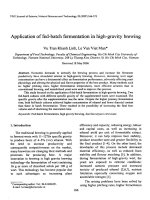
3.5 X-ray diffraction
In order to study the crystal structure of the hydrothermally treated and N-doped refluxed nano-tubes, XRD
analysis was carried out. Fig.5 shows four patterns of TiO2 after sintered at 4500C for 30 min: None-doped
TNTs powder and paste (TO and PTO), N-TNTs 2M powder and paste (NTO-2 and PNTO-2).
Results show that the reflux process with water and sintering at 4500C have not developed anatase phase (TO,
PTO), but the reflux process with NH4NO3 solution and sintering at 4500C have developed anatase phase (NTO,
PNTO-2) with high crystallinity. It is concluded that the chemical composition of the refluxing solution can be
impacted on the crystallization of TNT of six different cells produced with non-doped and N-doped TiO2 with
various concentrations of N-dopant.
The first component (NI) at 399.9 eV was assigned to the substitutional nitrogen atom replacing one O atom of
the TiO2 lattice [38], forming the N-Ti-O structure [39]. The second component (NII) at 402.6 eV corresponded
to NH4+ ions on the TiO2 surface [40]. The appearance of these peaks confirmed that TNTs were successfully
doped by N in our study.
3.6 Cyclic voltammetry measurement
We have recently developed a method to evaluate the blocking effect of coating layers on TiO2 electrodes by
cyclic voltammetry[14, 44]. A probe molecule 1,4-dicyanonaphthalene (DCN) is chose which has a redox
potential more negative than the conduction band of the TiO2 semiconductor and therefore allows relative fast
electrode kinetics between DCN and an unblocked TiO2 electrode.
Figure 6 shows the cyclic voltammogram of 1,4-dicyanonaphthalene (DCN) the working electrodes produced by
PTO, PNTO-0.5, PNTO-1 and PNTO-2. The reversible CV of DCN was obtained by electron transfer on the
surface of untreated TiO2 electrodes. The effect of N-doping of the TNT surface was clearly demonstrated by
the reduction of the DCN CV peak currents. The peak currents were reduced significantly as nitrogen dopant
concentration increased from 0.5 to 1 M, and the CV signal completely disappeared when this concentration
reached 2 M. The elimination of the CV signal of DCN shows that the electrode kinetics somehow has been
blocked by the N-doping of the TNT surface.
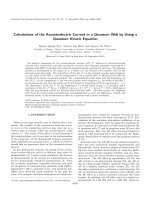
3.1 Photovoltaic performance
DSCs were prepared with photo anodes fabricated with pastes of TNT and N-TNT. The cell performance of
DSCs with TNT and N-TNT with various concentrations of N-dopant was reported in Table 2, and the J-V
curves of five selected cells were shown in Figure 7.
As seen from Table 2 and Figure 7 the effect of N-doping is mainly reflected in the short current density (Jsc).
Values of the Jsc increased gradually from the PTO cell with non N-doping to cells prepared with TNT paste
with 2M NH4NO3 N-doping. However, as the NH4NO3 concentration reached 3 M (PNTO-3), the Jsc value was
reduced. This might be due to the decrease of dye loading on the surface of TiO2 when the concentration of
doped-N was high. Even though the CV of PNTO-1 showed a reduction of dark current compared to PNTO-0.5
(Fig. 6), but the value of Jsc of the cells with PNTO-1 and PNTO-0.5 was not much different. The modification
of TiO2 surface with low concentration of doped-N (0.5 M) might help to increase the dye loading and to
decrease dye aggregation [44], therefore the electron injection of the cells was enhanced. This effect might
explain the equal Jsc values of PNTO-1 and PNTO-0.5 DSC devices.
Among the N-TNT cells, the PNTO-2 had the highest efficiency of 7.36% (Voc = 0.70 V, Jsc = 19.29 mA.cm-2,
FF = 54.9%) while the efficiency of undoped PTO cells was clearly smaller 4.75 % (Voc = 0.71 V, Jsc = 10.36
mA.cm-2, FF = 64.8%). It is worth noting that the overall efficiency was improved about 40% due to a 40%
increase in current, while open circuit voltage (Voc) and fill factor (FF) parameters were nearly unaffected by the
N-doping. The enhancement of Jsc might be explained by an enhanced electron injection to the TNT conduction
band and reduction of the back electron transfer to I3-, with the result that the electron lifetime of the injected
electrons into TNT is increased. The increase of electron injection rate may be explained by formation of a NH4+
layer on the TNT surface which lower the level of the conduction band and enhance the injection rate from the
excited state of the dye equivalent to the well-known Li+ electrolyte effect in DSCs [45]. The enhanced electron
injection to the TiO2 conduction band and reduction of the back electron transfer to I3- are exactly the factors
that improve VOC, which is not observed. This might be attributed to the NH4+ layer, whose positive charge
lower the conduction band edge level of TNT, which may compromise the aforementioned factors.
4.
Conclusions
We have introduced NH4NO3 as a new dopant to synthesize nitrogen doped TiO2 nanotubes. The synthesis
involved a strong alkaline hydrothermal treatment of Degussa P25 TiO2 nanoparticles followed by reflux of the
formed nano tubes in various aqueous (0-3 M) solutions of NH4NO3. The final product was characterized by
TEM, XRD and Raman measurements which showed the formation of a TiO2 product with nano-tube
morphology and anatase phase. The FT-IR and XPS analysis indicated furthermore that nitrogen was doped into
the outer layers of the TiO2 crystal structure by the coordination of NH4+ via Ti─O─NH4+ or H4N+─Ti─O
bonds. The application of photo anodes prepared with N-doped TNTs significantly improved the DSC
performance with up to 30-40%, mainly due to an increase in Jsc. With 2 M N-dopant DSCs η = 7.36%
compared to η = 4.75% for DSCs with no dopant. This efficiency improvement in N-doped TTNT cells could be
attributed to the reduction of dark current and to the enhancement of electron injection efficiency in the DSCs.
Acknowlegments
The authors would like to thank Vietnam National University – Ho Chi Minh City for the grant HS2014-18-01.
The authors are grateful to The World Academy of Sciences (TWAS) for instrumental funding 14-176
RG/CHE/AS_I.
References
[1]
A. Hagfeldt, G. Boschloo, L. Sun, L. Kloo, H. Pettersson, Chemical Reviews 110 (2010) 6595-6663.
[2]
B. O'Regan, M. Gratzel, Nature 353 (1991) 737-740.
[3]
L.M. Peter, The Journal of Physical Chemistry Letters 2 (2011) 1861-1867.
[4]
Q. Zhang, G. Cao, Nano Today 6 (2011) 91-109.
[5]
M. Motlak, M.S. Akhtar, N.A.M. Barakat, A.M. Hamza, O.B. Yang, H.Y. Kim, Electrochimica Acta
115 (2014) 493-498.
[6]
C. Kim, K.-S. Kim, H.Y. Kim, Y.S. Han, Journal of Materials Chemistry 18 (2008) 5809-5814.
[7]
A.K. Chandiran, F. Sauvage, M. Casas-Cabanas, P. Comte, S.M. Zakeeruddin, M. Graetzel, The
Journal of Physical Chemistry C 114 (2010) 15849-15856.
[8]
K.H. Ko, Y.C. Lee, Y.J. Jung, Journal of Colloid and Interface Science 283 (2005) 482-487.
[9]
W. Guo, L. Wu, Z. Chen, G. Boschloo, A. Hagfeldt, T. Ma, J. Photochem. Photobiol., A 219 (2011)
180-187.
[10]
N. Liu, X. Chen, J. Zhang, J.W. Schwank, Catalysis Today 225 (2014) 34-51.
[11]
A. Agresti, L. Cinà, S. Pescetelli, B. Taheri, A. Di Carlo, Vibrational Spectroscopy 84 (2016) 106117.
[12]
D.A. Shirley, Physical Review B 5 (1972) 4709-4714.
[13]
J.H. Scofield, Journal of Electron Spectroscopy and Related Phenomena 8 (1976) 129-137.
[14]
T. Lund, P.T. Nguyen, T. Ruhland, Journal of Electroanalytical Chemistry 758 (2015) 85-92.
[15]
T. Sekino, Synthesis and Applications of Titanium Oxide Nanotubes, Springer Berlin Heidelberg,
Berlin, Heidelberg, 2010.
[16]
A. Gajović, I. Friščić, M. Plodinec, D. Iveković, Journal of Molecular Structure 924–926 (2009) 183191.
[17]
S. Petit, D. Righi, J. Madejová, A. Decarreau, Clay Minerals 34 (1999) 543--543.
[18]
T. Ohsaka, F. Izumi, Y. Fujiki, Journal of Raman Spectroscopy 7 (1978) 321-324.
[19]
E. Morgado, M.A.S. de Abreu, O.R.C. Pravia, B.A. Marinkovic, P.M. Jardim, F.C. Rizzo, A.S.
Araújo, Solid State Sciences 8 (2006) 888-900.
[20]
J.-N. Nian, H. Teng, The Journal of Physical Chemistry B 110 (2006) 4193-4198.
[21]
L. Qian, Z.-L. Du, S.-Y. Yang, Z.-S. Jin, Journal of Molecular Structure 749 (2005) 103-107.
[22]
D.V. Bavykin, J.M. Friedrich, A.A. Lapkin, F.C. Walsh, Chemistry of Materials 18 (2006) 1124-1129.
[23]
M.A. Cortés-Jácome, G. Ferrat-Torres, L.F.F. Ortiz, C. Angeles-Chávez, E. López-Salinas, J. Escobar,
M.L. Mosqueira, J.A. Toledo-Antonio, Catalysis Today 126 (2007) 248-255.
[24]
T. Gao, H. Fjellvåg, P. Norby, Inorganic Chemistry 48 (2009) 1423-1432.
[25]
B. Choudhury, M. Dey, A. Choudhury, Int. Nano Lett. 3 (2013) 25.
[26]
D. Nassoko, Y.-F. Li, H. Wang, J.-L. Li, Y.-Z. Li, Y. Yu, Journal of Alloys and Compounds 540
(2012) 228-235.
[27]
K. Siuzdak, M. Szkoda, M. Sawczak, A. Lisowska-Oleksiak, New J. Chem. 39 (2015) 2741-2751.
[28]
S.A. Bakar, G. Byzynski, C. Ribeiro, Journal of Alloys and Compounds 666 (2016) 38-49.
[29]
R. Quesada-Cabrera, C. Sotelo-Vazquez, J.A. Darr, I.P. Parkin, Appl. Catal. B: Environ. 160–161
(2014) 582-588.
[30]
A.M. Abdullah, N.J. Al-Thani, K. Tawbi, H. Al-Kandari, Arabian J. Chem. 9 (2016) 229-237.
[31]
A. Agresti, S. Pescetelli, A. Quatela, S. Mastroianni, T.M. Brown, A. Reale, C.A. Bignozzi, S.
Caramori, A. Di Carlo, RSC Advances 4 (2014) 12366-12375.
[32]
A. Agresti, S. Pescetelli, E. Gatto, M. Venanzi, A. Di Carlo, Journal of Power Sources 287 (2015) 8795.
[33]
C. Pérez León, L. Kador, B. Peng, M. Thelakkat, The Journal of Physical Chemistry B 110 (2006)
8723-8730.
[34]
M.G. Faba, D. Gonbeau, G. Pfister-Guillouzo, Journal of Electron Spectroscopy and Related
Phenomena 73 (1995) 65-80.
[35]
M.C. Biesinger, L.W.M. Lau, A.R. Gerson, R.S.C. Smart, Applied Surface Science 257 (2010) 887898.
[36]
R. Gouttebaron, D. Cornelissen, R. Snyders, J.P. Dauchot, M. Wautelet, M. Hecq, Surf. Interface
Anal. 30 (2000) 527-530.
[37]
J.T. Mayer, U. Diebold, T.E. Madey, E. Garfunkel, J. Electron. Spectrosc. Relat. Phenom. 73 (1995)
1-11.
[38]
Y.N. Huo, Y. Jin, J. Zhu, H.X. Li, Appl Catal B. 89 (2009) 543-550.
[39]
M. Sathish, B. Viswanathan, R.P. Viswanath, C.S. Gopinath, Chem. Mater. 17 (2005) 6349-6353.
[40]
C. Guimon, A. Zouiten, A. Boreave, G. Pfister-Guillouzo, P. Schulz, F. Fitoussi, C. Quet, Journal of
the Chemical Society, Faraday Transactions 90 (1994) 3461-3467.
[41]
Y. Yu, K. Wu, D. Wang, Appl. Phys. Lett. 99 (2011) 192104.
[42]
X. Zhang, H. Tian, X. Wang, G. Xue, Z. Tian, J. Zhang, S. Yuan, T. Yu, Z. Zou, Mater. Lett. 100
(2013) 51-53.
[43]
J. Zhu, J. Yang, Z.-F. Bian, J. Ren, Y.-M. Liu, Y. Cao, H.-X. Li, H.-Y. He, K.-N. Fan, Appl. Catal. B:
Environ. 76 (2007) 82-91.
[44]
P.T. Nguyen, V.S. Nguyen, T.A.P. Phan, T.N.V. Le, D.M. Le, D.D. Le, V.A. Tran, T.V. Huynh, T.
Lund, Applied Surface Science 392 (2017) 441-447.
[45]
R. Katoh, M. Kasuya, S. Kodate, A. Furube, N. Fuke, N. Koide, The Journal of Physical Chemistry C
113 (2009) 20738-20744.
Fig. 1 TEM images of the TNT and N-TNT powder and paste: (a) TO; (b) NTO-0.5; (c) NTO-1; (d) NTO-2, (e) PNTO-2, (f)
NTO-3.
Fig. 2 Infrared spectrum of TO, NTO-0.5, NTO-1, NTO-2 and NTO-3.
Fig. 3 A) Raman spectrum of none-doped sample PTO after the final calcination step in Figure 1. B) Raman spectra of the
N-doped samples PNTO-0.5, PNTO-1, PNTO-2, PNTO-3 after the final calcination process. The inset shows the position of
Eg(1) anatase band at 144.9 cm-1, 145.6 cm-1, 146.5 cm-1, 146.8 cm-1 for PNTO-0.5, PNTO-1, PNTO-2, PNTO-3 samples
respectively.
Ti 2p
Relative intensity (a.u.)
a
Ti
4+
2p3/2
Ti
3+
2p3/2
2p1/2
Sat
NTO-2
TO
470
465
460
455
Binding energy (eV)
N 1s
b
Relative intensity (a.u.)
NII
NI
NTO-2
405
400
395
Binding energy (eV)
O 1s
c
Relative intensity (a.u.)
OI
OII
OIII
NTO-2
OIV
TO
539
538
537
536
535
534
533
532
531
530
529
Binding energy (eV)
Fig. 4 The XPS analysis of Ti 2p (a); N 1s (b) and O 1s (c) of the sample NTO-2 compared to the sample TO.
Intensity (a.u.)
PNTO-2
NTO-2
PTO
TO
Anatase
H2Ti3O7
20
30
40
o
2 ( )
50
60
70
Fig. 5 XRD of the TNT powder and paste (TO and PTO) and N-TNT-2M powder and paste (NTO-2 and PNTO-2) after
sintering at 450 oC for 30 min
Fig. 6 CV of DCN (1 mM) in acetonitrile with Bu4NBF4 (0.1 M) as supporting electrolyte. And Ag/AgCl as pseudo
reference electrode. Working electrodes where prepared of TNT doped with various concentration of N from 0 to 2 M on
FTO substrate.
Fig. 7 The J–V characteristics of DSCs produced with the TNT (PTO) and N-TNT electrodes (PNTO-0.5, PNTO-1,
PNTO-2, PNTO-3) (light intensity of 1000 W.m-2 and illumination area of 0. 25 cm2).
Scheme 1 The synthetic scheme of N-TNT.
Table 1. XPS data of the TNT and N-TNT
C 1s
Ti4+
Ti3+
O1s
2p3/2-
2p3/2
I
O1s
O1s
O1s
N1s
II
III
IV
I
N1s
Ti3+/Ti4+
II
2p1/2
TO
B.E1.
285.0
286.6
290.0
eV
457.2
530.3
531.7
533.0
535.6
2.17
0.026
464.5
%
12.67
2.16
1.48
22.63
0.37
50.83
5.46
2.22
NTO-
B.E1.
285.0
286.4
288.6
458.5-
457.0
530.1
531.4
532.8
399.9
402.6
2
eV
0.45
35.21
6.74
8.63
0.74
0.44
%
1
458.7-
464.3
19.12
Binding Energy
6.66
1.48
20.53
0.036
Table 2. The photovoltaic performance of DSCs with TNT and N-TNT at various concentrations of N-dopant.
Each line of value presented the average performance of two individual cells in the same plate. For each series
of experiments, data of three plates was shown in the table. The bold values were selected to show their J-V
curves in Figure 7.
Concentration of
Jsc
Voc
Fill factor
mA. cm-2
V
%
%
10.29
0.72
63.4
4.67
10.20
0.71
64.7
4.68
10.36
0.71
64.8
4.75
15.25
0.70
54.9
5.89
15.16
0.70
56.1
5.93
15.31
0.69
56.6
6.00
15.53
0.68
55.9
5.92
15.61
0.68
54.8
5.84
15.63
0.70
56.7
6.17
19.29
0.70
54.9
7.36
19.63
0.69
54.0
7.30
19.95
0.69
53.0
7.24
15.11
0.69
56.5
5.90
15.10
0.69
57.3
6.00
15.19
0.69
57.4
6.02
N-dopant
M
0
0.5
1
2
3