DSpace at VNU: Synthesis and Characterization of Ce-Doped Y3Al5O12 (YAG:Ce) Nanopowders Used for Solid-State Lighting
Bạn đang xem bản rút gọn của tài liệu. Xem và tải ngay bản đầy đủ của tài liệu tại đây (1.1 MB, 8 trang )
Hindawi Publishing Corporation
Journal of Nanomaterials
Volume 2014, Article ID 571920, 7 pages
/>
Research Article
Synthesis and Characterization of Ce-Doped Y3Al5O12 (YAG:Ce)
Nanopowders Used for Solid-State Lighting
Do Ngoc Chung,1 Do Ngoc Hieu,1 Tran Thi Thao,1
Vo-Van Truong,2 and Nguyen Nang Dinh1
1
University of Engineering and Technology, Vietnam National University, Hanoi, 144 Xuan Thuy Road, Cau Giay District,
Hanoi 10000, Vietnam
2
Department of Physics, Concordia University, 1455 de Maisonneuve Boulevard W, Montreal, QC, Canada H3G 1M8
Correspondence should be addressed to Nguyen Nang Dinh;
Received 10 December 2013; Revised 5 May 2014; Accepted 6 May 2014; Published 25 May 2014
Academic Editor: Prashant Kumar
Copyright © 2014 Do Ngoc Chung et al. This is an open access article distributed under the Creative Commons Attribution License,
which permits unrestricted use, distribution, and reproduction in any medium, provided the original work is properly cited.
Nano-Ce-doped Y3 Al5 O12 (YAG:Ce) powders were synthesized by using a sol-gel low temperature combustion method, followed by
thermal annealing. The annealing temperature for enriching nanoparticles was optimized and found to be 1000∘ C. The process for
enriching uniform nanoparticles of YAG:Ce powder was carried out by using the nanosteam technique (NST). The nanoparticles
obtained from this NST treatment had a size in the range of 9–20 nm. Measurements of the photoluminescence spectra of the
dispersed YAG:Ce nanoparticles solutions showed a blue shift in the photoemission with a value of ca. 10 nm in the green region.
WLEDs made from the blue LED chip coated with the nano-YAG:Ce + MEH-PPV composite epoxy exhibit white light with a broad
band luminescent spectrum and a high color rending index (CRI). The photoluminescence spectra of the YAG:Ce nanoparticles
showed a potential application of the prepared nanostructured YAG:Ce phosphor not only in energy-efficient solid-state lighting,
but also in optoelectronic devices, including organic composite solar cells. In addition, it is suggested that NST can be applied for
the enrichment of uniform inorganic nanoparticles.
1. Introduction
Research and applications of solid-state lighting (SSL) have
grown exponentially in the world since the discovery of
InGaN fabrication process by Nakamura et al. [1]. The
rapid development of white light-emitting diodes (WLED)
over the last few years has opened new opportunities in
the general illumination market [2, 3]. Moreover, the SSL
consumes less electricity and does not cause much pollution,
the development of the SSL devices can be seen as a valuable
contribution in the maintenance of environment. The efficiency of commercialized WLEDs is now around 80 lm/W,
which is comparable with that of fluorescent lamps. There
are several approaches to fabricate white LED, for instance,
by using a blue or UV LED to excite some phosphors to give
white light [4]. The ability to obtain different color correlated
temperature (CCT) and high color rendering index (CRI) of
WLED gives new features to this kind of light sources.
It is known that Y3 Al5 O12 - (YAG-) based materials are
commonly used as a host material in various solid-state lasers.
Rare earth elements such as neodymium and erbium can be
doped into YAG as active laser ions, yielding YAG:Nd and
YAG:Er lasers, respectively. Recently, YAGs have also been
developed for energy-efficient SSL [5]. For this, Ce is doped in
YAG (YAG:Ce) and this material is used to cover the InGaNLED chips to get white light from WLED. Under blue light
excitation of the LED chips, YAG:Ce phosphor emits a broad
spectrum from 500 to 650 nm, due to the 5d-4f transition of
Ce3+ ion [6]. This is the reason why YAG:Ce phosphor has
extensive application in WLEDs.
There are many methods used for the preparation of the
YAG powder with a high crystallinity, a large luminous power,
and a small particle size, such as methods using solid-state
reaction [7–10], coprecipitation, [11–13] and sol-gel process
[14]. As Yan et al. reported in [15], YAG:Ce with nanoparticles
may be prepared by a sol-gel low temperature combustion
2
method (shortly called LTC). Recently, we have also synthesized YAG:Ce by this method. However, the LTC-synthesized
YAG:Ce powder product usually contained particles with a
size ranging from a few to hundreds of nanometers. With
the aim of preparing a solution of nano-YAG:Ce particles
one can use a traditional technique, the so-called “water
dispersion technique” (WDT) using either ultrasonic or
magnetic stirring. This method is simple; however, it will be
seen in Section 3 that the WDT-dispersion solution exhibits
an incomplete separation of nanoparticles from the larger size
particles.
The size and shape of powders influence the flow and
compaction properties. Larger, more spherical particles will
typically flow more easily than smaller or high aspect ratio
particles. Smaller particles dissolve more quickly and lead
to higher suspension viscosities than larger ones. In order
to measure the particles size with the LB550 machine, it
is necessary to dissolve the YAG:Ce powder in a solution.
However, when the YAG:Ce powder is dispersed in a solution,
particles usually cluster in aggregates. This results in a
large error in the determined size of the particles. The size
measured by LBP550 is much larger than the real particle size.
That is true because when the YAG:Ce powder is dispersed in
solution or air, the nanoparticles will coalesce due the effect
of nanoparticle interactions. The coalescence of nanoparticles
leads to reducing potential of particles, as reported elsewhere
[16].
With the aim of producing nano-YAG:Ce phosphor
powder, a dispersion solution with uniform nanoparticles of
the YAG:Ce was prepared by using a nanosteam technique
(NST). In this work, we present the results on the process
of the nanoparticles enrichment from the LTC-prepared
YAG:Ce powder and characterization of the size distribution of nanoparticles by using a dynamic light scattering
particle size analyzer combined with the NST treatment.
Finally, the nano-YAG:Ce powder was used with a conjugate polymer Poly[2-methoxy-5-(2 -ethyl-hexyloxy)-1,4phenylene vinylene] (MEH-PPV) to prepare the nanocomposite coating for WLEDs as solid-state lighting (SSL).
The crystalline structure, surface morphology, and photoluminescent properties of YAG:Ce powders and emission
spectra of the WLEDs were also studied.
2. Experimental
2.1. Preparation of the YAG:Ce Phosphor Powder. Nanocrystalline YAG and YAG:Ce (with a Ce concentration of 2 wt%)
powders were prepared by the LTC method, following the
process as reported elsewhere [15, 17]. High purity chemicals
were used: Y2 O3 , HNO3 , Ce(NO3 )3 ⋅6H2 O, Al(NO3 )3 ⋅9H2 O,
C6 H8 O7 ⋅H2 O, and ammonia (NH3 ⋅H2 O).
The YAG:Ce powder with a composition corresponding
to the chemical stoichiometry formula of Y3 Al5 O12 :Ce was
synthesized from the above mentioned precursor materials.
Y2 O3 was dissolved in a hot nitric acid in a three-neck
flask and prepared solution. The solution was agitated for
2 hours at temperature of 60∘ C–65∘ C in nitrogen gas. Then
the solution was added with aluminum nitrate and cerium
Journal of Nanomaterials
nitrate to get the bright yellow solution. In the next step,
citric acid (C6 H8 O7 ⋅H2 O) was added in the bright yellow
solution. Citric acid was dissolved in this solution by half the
mole of the total metal ions. The pH value of the solution
was modulated to 8, and a gel was obtained in 60 min by
immersing the solution in a water bath at 80∘ C. Then the
gels were dried to obtain canary xerogel. The xerogel was put
into a muffle stove and a combustion reaction occurred at
245∘ C for 20 min, and the spumous powder was obtained.
The calcination was conducted at 700∘ C with a heating rate
of 2∘ C/min and kept for 300 min; then, the temperature was
increased to different holding temperatures (800, 1000, and
1200∘ C) at a rate of 10∘ C/min for a fixed holding time of
120 min in nitrogen gas.
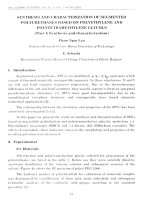
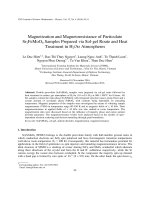
2.2. Set-Up of the Nanosteam Technique System. In order to
enrich YAG-Ce nanoparticles in a water solution as well as to
improve the precision of the measurement of the particle size
on the LB-550 machine, we set up a system using the NST
method as shown in the following diagram (Figure 1).
The YAG:Ce powder was put in air column pots at the
bottom. Clean air is blown in the air column pot, making
the YAG:Ce nanopowder separated from the powder form in
steam. The steam will move in to water pots by pump. After a
certain period, the solution taken from the water pot (3) was
used for the particle size distribution measurements on the
LB550 machine. In this system, both the height of air column
pots and the pumping pressure play an important role; they
affect the particles’ separation of the powder that is obtained
in the solution pot (3). From our experiments, the optimum
parameters of the air column height and the pressure for
the NST process were found to be of 30 cm and 250 mbar,
respectively. Nanopowder of YAG:Ce was then collected from
the column and reannealed at 450∘ C for 2 h. This powder
was further used for characterization and preparation of
nanocomposites that were coated onto a blue LED chip to get
the solid-state lighting lamp.
To compare the NST with the WDT method regarding
particles dispersion, we also dispersed 5 g of the YAG:Ce
powders in a 100 mL capacity glass with 80 mL of distilled
water by using both the ultrasonic and magnetic stirring.
The time for each stirring lasted for over 10 h. The dispersion
solution was left to be immovable for 5 hours; then, 30 mL
from the top of the dispersion solution level was taken for
further measurements.
We used dynamic light scattering technique for the
determination of the particle size of YAG:Ce powder. The
DLS is based on the Brownian motion of particles and the
Doppler effect [18]; it can be applied to determine the particle
size distribution over a range from 1 nm to 6 𝜇m. A sample
particle (or droplet), exposed to laser light, diffuses light
with a changed frequency. This frequency change compared
to the original light varies directly with the velocity of
moving particles. By analyzing the frequency change, one
can obtain the distribution of the particle size of samples. A
“HORIBA-LB550” instrument offers the possibility to control
these parameters in real time. The viscosity issue becomes
even more critical as the analyzed sample concentration is
increased.
Journal of Nanomaterials
3
LB-550
Clean air
(2)
(1)
(4)
(3)
Figure 1: Schematic diagram for measuring YAG:Ce nanoparticle size by LB-550 with nanosteam technique: air column pots (1), gas pipe
(2), water pots (3), and vacuum pump (4).
coating YAG:Ce + MEH-PPV solution onto glass or quartz
substrates.
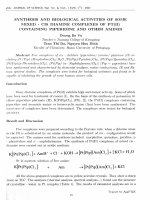
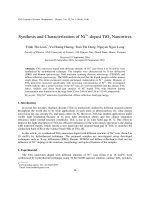
Phosphor
composite
Plastic lens
Bond wire
Anode
lead
Cathode
lead
Heat sink
LED chip
Reflective cup
Figure 2: Scheme of a WLED made from a composite of nanoYAG:Ce and conjugate polymer MEH-PPV (YAG:Ce + MEH-PPV).
The average thickness of the phosphor composite layer is ∼700 𝜇m.
2.3. Preparation of WLED for Solid-State Lighting. To prepare
nanocomposite, the YAG:Ce nanopowder was mixed with
the MEH-PPV according to a volume ratio of 10 : 1. For this,
the pure MEH-PPV solution was prepared by dissolving the
MEH-PPV powder in toluene solvent with a ratio of 1 mg
of MEH-PPV powder in 2 mL toluene. The nano-YAG:Ce
powder in the MEH-PPV solution was mixed in a liquid
transparent epoxy. The obtained composite epoxy was then
coated onto the blue LED chip, followed by annealing at 150∘ C
to get WLED, as shown in Figure 2. For the investigation
of spectroscopic properties, some samples were made by
2.4. Characterization Techniques. X-ray diffraction (XRD)
was used for analyzing the crystalline phases in the samples.
The XRD patterns were obtained from a Bruker X-ray diffractometer “D8 Advance.” The morphology characterization of
the samples was carried out on a Hitachi scanning electron microscope “S4800-NIHE” (FE-SEM). The distribution
of the size of YAG:Ce particles was analyzed by using a
HORIBA dynamic light scattering particle size analyzer “LB550.” The absorption and photoluminescent spectra of the
composite films were recorded on JASCO “UV/VIS/NIR
spectrophotometer V-570” and a HORIBA high resolution
FLuoroMax-4 spectrofluorometer “Microspec-235b,” respectively. The electroluminescence characterizations were measured by using an integrating sphere equipped with a calibrated spectrophotometer–“LCS 100” (LED measurement
System).
The blue InGaN-LED chip used in this research is the
high power 1 W LED chip with the emission peak at 455 nm
(with the die size around 1100 𝜇m × 1100 𝜇m, as can be seen
elsewhere [12]). The green YAG:ce phosphor and MEH-PPV
polymer hybrid composite were dropped onto the surface
area between the top of the LED chip to convert a part of blue
light into green and red lights.
Journal of Nanomaterials
20
30
40
50
36
40
44
842
640
840
444
532
540
422
220
321
400
32
PL intensity (a.u.)
Intensity (a.u.)
420
4
60
70
80
2𝜃 (deg)
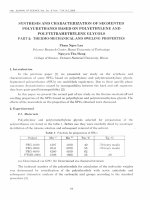
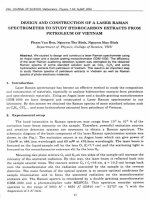
Figure 3: XRD patterns of samples at 1000∘ C annealing temperatures. The insertion is XRD of the collected nanopowder.
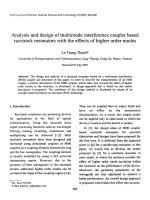
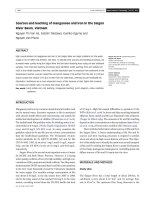
400
500
600
Wavelength (nm)
700
800
Figure 4: Photoluminescence of YAG:Ce at 442 nm excitation
wavelength.
3. Results and Discussion
3.1. Crystalline Structures and Photoluminescent Property.
The XRD patterns of a typical YAG:Ce prepared by the LTC
method are shown in Figure 3. All the peaks revealed in the
patterns are consistent with the characteristic peaks of the
bulk YAG crystal (pdf card no. 12005-21-9). In the insertion,
a part of the XRD patterns (viz., the peaks of the (420), (422),
and (540) diffraction crystalline planes) for the nanopowder
collected from the water pot is shown. The XRD patterns
indicate a well-crystallized YAG sample. The Ce-doping did
not affect the crystalline structure, showing the substitution
doping of Ce atoms in the YAG lattice. The CeO2 phase did
not appear in the XRD patterns. For as-prepared YAG:Ce
samples, the fact that all the XRD peaks are strong and
sharp proves that the majority of the sample volume contains
macrocrystallites.
After the NST treatment, the collected powder from the
YAG volume exhibits nanostructured characteristics. This is
confirmed by the fact that the XRD peak width became much
larger. To determine the particle size (𝜏), we used Scherrer’s
formula [19]:
𝜏=
0.9𝜆
,
𝛽 ⋅ cos 𝜃
(1)
where 𝜆 is the X-ray wavelength used, 𝛽 is the full width at
half maximum in radians, and 𝜃 is the Bragg angle of the
considered diffraction peak. The average value of the particles
calculated from XRD peaks was found to be 20 nm.
Emission intensity is one of the key parameters for the
application of the YAG:Ce powder. Figure 3 shows a typical
PL spectrum of the YAG:Ce powder prepared by the LTC
method at an annealing temperature of 1200∘ C and a Ce
concentration of 2 wt%. The PL curve in Figure 4 shows the
characteristic 4f → 5d transitions of Ce3+ in YAG:Ce crystals
under excitation in the blue region around 442 nm. The PL
spectrum of the YAG:Ce powder exhibits a broad maximum
in the green region centered at 520 nm. This is one of the
desired properties of the YAG phosphor that can be used for
energy-efficient solid-state lighting.
3.2. Nanosize Properties of YAG:Ce. Figure 5 shows the
FE-SEM images of YAG:Ce powder annealed at low
temperature (700∘ C), middle temperature (1000∘ C),
and high temperature (1200∘ C). From this figure one
can see that the particle size of the YAG:Ce powder
increased with the annealing temperature. Moreover, it
is clearly seen that, for the sample annealed at 1000∘ C,
there are many smaller particles which are attached to
the surface of a number of large particles (Figure 5(b)).
This phenomenon was observed also for the sample annealed
at low temperature (Figure 5(a)) but not observed for
the high annealing temperature sample (Figure 5(c)).
Indeed, the size of such small particles can be evaluated
on the FE-SEM micrographs, and it is from approximately
10 nm to 20 nm. With the calcination temperature increased
to 1200∘ C, the grain size grew to a few micrometers (1–3 𝜇m).
The DLS measurement results for the particle size distribution from the WDT-dispersed solution are shown in
Figure 6(a). The particle distribution shown in this figure
indicates that, for the sample annealed at 700∘ C, particles
have a size ranging from 0.2 to 3.3 𝜇m; among them, a large
number of particles are 0.5 𝜇m and 3.2 𝜇m in size (see two
peaks in “1” of Figure 6(a)). For the samples annealed at
1000∘ C and 1200∘ C, larger particles are observed and their
size is in the range from 0.6 to 3.3 𝜇m and 1.0 to 3.3 𝜇m,
respectively (see “2” and “3” in Figure 6(a)). This indicates
that for, the YAG:Ce synthesis, the annealing temperature
strongly affected the growth of the particle size. The particle size of YAG:Ce annealed at 1200∘ C is much larger
in comparison with samples annealed at 700 and 1000∘ C.
The smallest particle size is about 1 𝜇m. These particle size
distribution pictures do not reflect what was observed in the
SEM micrographs: from the particle size distribution curves
no nanoparticles were observed. This means that by the WDT
Journal of Nanomaterials
5
100 nm
100 nm
(a)
200 nm
(b)
(c)
Figure 5: FE-SEM images of YAG:Ce powders annealed for 5 h at 700∘ C (a), 1000∘ C (b), and 1200∘ C (c).
1
1
2
2
3
3
0.1971
0.766
Particle size (𝜇m)
2.9763
(a)
0.0044
0.0171
0.0066 0.2586
Particle size (𝜇m)
1.0045
3.9045
(b)
Figure 6: Particle size distribution obtained by DLS method for YAG:Ce dispersed solutions for the samples annealed at 700∘ C (1), 1000∘ C
(2), and 1200∘ C (3) using WDT (a) and NST (b) techniques for the dispersion.
method it is impossible to completely disperse (or separate)
the nanoparticles from the large particles.
The measurement results of the particle size distribution
from the NST dispersed solution are plotted in Figure 6(b).
From this figure, one can see that almost all particles in the
solution obtained from the sample annealed at 700∘ C are
nanocrystalline. Their size varies from 4 to 17 nm. Whereas
for the sample annealed at 1000∘ C, the dispersed particles
have a size ranging from 8.7 nm to 20 nm, and for the sample
annealed at 1200∘ C, there are no observed nanoparticles in
the NST dispersion solution.
From the results obtained on the YAG:Ce powder dispersion, one can note that the YAG:Ce nanoparticles formed
during the LTC synthesis were completely dispersed due
to the NST method, whereas by the WDT method only a
small part of the nanoparticles can be separated from the
microclusters. This is in agreement with what was observed
in the SEM micrographs.
The photoluminescence of the solution containing the
YAG-Ce nanoparticles was also investigated. Indeed, the
nanoparticle effect on the PL was observed when the dispersion solution was used as a target for photoluminescence measurements. In Figure 7, two PL curves are shown
corresponding to two solutions with the NST treatment
durations of 30 min and 60 min, respectively. The powder
used for the NST treatment was taken from a YAG:Ce
6
Journal of Nanomaterials
Intensity (a.u.)
PL intensity (a.u.)
(2)
(4)
(1)
(2)
(1)
(3)
400
500
400
600
Wavelength (nm)
700
Figure 7: Photoluminescence of nano-YAG:Ce particles solutions
with the NST treatment of 30 min (1) and 60 min (2) at 442 nm
excited wavelength.
500
Absorption
Emission
PL intensity (a.u.)
400
300
2
1
200
100
0
400
500
600
700
450
500
800
800
Wavelength (nm)
Figure 8: Absorption (1) and emission (2) spectra of the MEH-PPV
film. The thickness 𝑑 = 200 nm.
sample annealed at 1000∘ C. The excitation wavelength used
for the PL measurements was 442 nm. Compared with the
PL of the YAG:Ce powder (see Figure 4), the PL curves of
nano-YAG:Ce particles solution have a similar shape. The
spectra are also broad, expanding from 470 nm to 750 nm.
The fact that the PL intensity increased with the increase
of the treatment time proved that the dispersion solution
became much enriched with YAG:Ce nanoparticles. The peak
of both the two PL spectra was found to be of ca. 510 nm.
This value is slightly (10 nm) smaller than the PL peak
wavelength value (520 nm) of the PL spectra for the YAG:Ce
powder (see Figure 4). This blue shift can be explained by the
nanosize effect in the PL emission for the semiconducting
nanoparticles and/or quantum dots [20, 21].
550
600
650
Wavelength (nm)
700
750
800
Figure 9: Emission spectra of components of WLEDs made from
nanocomposite: blue LED (curve 1), MEH-PPV (curve 2), YAG:Ce
nanopowder (curve 3), and the total spectrum of the blue LED,
nanocomposite “YAG:Ce + MEH-PPV” (curve 4).
3.3. Spectra of WLED. The absorption and photoluminescence spectra of MEH-PPV film were plotted in Figure 8.
From this figure one can see that the MEH-PPV film has an
absorption peak at 480 nm and two emission peaks at 570 nm
and 640 nm. This is consistent with the reporting results on
MEH-PPV films deposited by spin coating for preparation of
OLED [22]. Thus, a blue LED chip can be used for exciting
luminescence of the MEH-PPV.
In Figure 9, the electroluminescence spectra of a blue
LED, photoluminescence spectra of YAG:Ce, and MEH-PPV
polymer are presented. From this figure one can expect
that the light emitted from three components as the blue
LED chip, YAG:Ce green phosphor, and MEH-PPV yellow
polymer could exhibit the white light with a broad band
luminescent spectrum and a high color rending index (CRI).
Especially, with the use of YAG:Ce + MEH-PPV hybrid composite, the spectral region is enhanced around the wavelength
of 521 nm. This is due to the contribution of the emission of
the nano-YAG:Ce phosphor. The increase of the intensity of
the 521 nm peak enables the CRI increase. In addition, similar
to the other quantum dots like CdSe, ZnSe, and so forth, the
nano YAG:Ce particles possessing such a strong PL property
can be used for biomarkers, pigments in printing, and organic
and inorganic hybrid solar cells.
4. Conclusion
The nano-YAG:Ce powder was prepared by a sol-gel low temperature combustion method, followed by thermal annealing.
The optimal annealing temperature of the sample used for
enriching nanoparticles solution by using the NST method
was found to be of 1000∘ C. By NST treatments, uniform
YAG:Ce nanoparticles of 9–20 nm have been collected and
mixed with MEH-PPV conjugated polymer to get nanocomposites. WLEDs made from the blue LED chip coated with the
nano-YAG:Ce + MEH-PPV composite epoxy exhibit white
Journal of Nanomaterials
light with a broad band luminescent spectrum and a high
color rending index (CRI).
The photoluminescence spectra of the YAG:Ce nanoparticles showed a potential application of the prepared nanostructured YAG:Ce phosphor not only in energy-efficient
solid-state lighting, but also in optoelectronic devices, including organic composite solar cells.
Conflict of Interests
The authors declare that there is no conflict of interests
regarding the publication of this paper.
Acknowledgments
This research is funded by Vietnam National Foundation
for Science and Technology (NAFOSTED) under Grant no.
“103.02-2013.39.” Infrastructure and equipment provided for
YAG:Ce synthesis, XRD patterns, and NST treatments were
made possible in the VNU project on “Nanotechnology
and Application” in the period 2010–2013 supported by the
Vietnamese Government.
References
[1] S. Nakamura, T. Mukai, and M. Senoh, “Candela-class highbrightness InGaN/AlGaN double-heterostructure blue-lightemitting diodes,” Applied Physics Letters, vol. 64, no. 13, pp.
1687–1689, 1994.
[2] M. Yamada, T. Mitani, Y. Narukawa et al., “InGaN based nearultraviolet and blue-light-emitting diodes with high external
quantum efficiency using a patterned sapphire substrate and a
mesh electrode,” Japanese Journal of Applied Physics, vol. 41, pp.
L1431–L1433, 2002.
[3] N.-C. Chen, C.-M. Lin, Y.-K. Yang, C. Shen, T.-W. Wang, and
M.-C. Wu, “Measurement of junction temperature in a nitride
light-emitting diode,” Japanese Journal of Applied Physics, vol.
47, no. 12, pp. 8779–8782, 2008.
[4] S. Muthu, F. J. P. Schuurmans, and M. D. Pashley, “Red, green,
and blue LEDs for white light illumination,” IEEE Journal on
Selected Topics in Quantum Electronics, vol. 8, no. 2, pp. 333–338,
2002.
[5] Y. Shimizu, “Development of White LED light source,” Rare
Earth, vol. 40, pp. 150–151, 2002.
[6] H. S. Jang and D. Y. Jeon, “Yellow-emitting Sr3 SiO5 :Ce3+ ,Li+
phosphor for white-light-emitting diodes and yellow-lightemitting diodes,” Applied Physics Letters, vol. 90, no. 4, Article
ID 041906, 2007.
[7] Y. X. Pan, M. M. Wu, and Q. Su, “Tailored photoluminescence of
YAG:Ce phosphor through various methods,” Journal of Physics
and Chemistry of Solids, vol. 65, pp. 845–850, 2004.
[8] J.-G. Li, T. Ikegami, J.-H. Lee, T. Mori, and Y. Yajima, “Coprecipitation synthesis and sintering of yttrium aluminum
garnet (YAG) powders: the effect of precipitant,” Journal of the
European Ceramic Society, vol. 20, no. 14-15, pp. 2395–2405,
2000.
[9] J. S. Abell, I. R. Harris, B. Cockayne, and B. Lent, “An investigation of phase stability in the Y2 O3 -Al2 O3 system,” Journal of
Materials Science, vol. 9, no. 4, pp. 527–537, 1974.
7
[10] Q. Zhang and F. Saito, “Mechanochemical solid reaction of
yttrium oxide with alumina leading to the synthesis of yttrium
aluminum garnet,” Powder Technology, vol. 129, no. 1–3, pp. 86–
91, 2003.
[11] J. Su, Q. L. Zhang, C. J. Gu et al., “Preparation and characterization of Y3 Al5 O12 (YAG) nano-powder by co-precipitation
method,” Materials Research Bulletin, vol. 40, no. 8, pp. 1279–
1285, 2005.
[12] Z. H. Wang, L. Gao, and K. Niihara, “Synthesis of nanoscale
yttrium aluminium garnet powder by the co-precipitation
method,” Materials Science and Engineering, vol. A288, pp. 1–4,
2000.
[13] C. J. Liu, R. M. Yu, Z. W. Xu, J. Cai, X. H. Yan, and X. T.
Luo, “Crystallization, morphology and luminescent properties
of YAG:Ce3+ phosphor powder prepared by polyacrylamide gel
method,” Transactions of Nonferrous Metals Society of China,
vol. 17, no. 5, pp. 1093–1099, 2007.
[14] M. Veith, S. Mathur, A. Kareiva, M. Jilavi, M. Zimmer, and V.
Huch, “Low temperature synthesis of nanocrystalline Y3 Al5 O12
(YAG) and Ce- doped Y3 Al5 O12 via different sol-gel methods,”
Journal of Materials Chemistry, vol. 9, no. 12, pp. 3069–3079,
1999.
[15] X. H. Yan, S. S. Zheng, R. M. Yu et al., “Preparation of YAG:Ce3+
phosphor by sol-gel low temperature combustion method and
its luminescent properties,” Transactions of Nonferrous Metals
Society of China, vol. 18, no. 3, pp. 648–653, 2008.
[16] S. K. Brar and M. Verma, “Measurement of nanoparticles by
light-scattering techniques,” Trends in Analytical Chemistry, vol.
30, no. 1, pp. 4–17, 2011.
[17] D. N. Chung, N. N. Dinh, D. N. Hieu, and P. H. Duong, “Synthesis of cerium-doped yttrium aluminum garnet nanopowder
low-temperature reaction combustion method,” VNU Journal of
Science, Mathematics—Physics, vol. 2, pp. 53–60, 2013.
[18] W. B. Russel, “Brownian motion of small particles suspended in
liquids,” Annual Review of Fluid Mechanics, vol. 13, pp. 425–455,
1981.
[19] B. D. Cullity, Elements of X-Ray Diffraction, Addison, Wesley
Publishing Company, Reading, Mass, USA, 2nd edition, 1978.
[20] U. Woggon, Optical Properties of Semiconductor Quantum Dots,
vol. 136 of Springer Tract in Modern Physics, Springer, Berlin,
Germany, 2013.
[21] A. Wolcott, D. Gerion, M. Visconte et al., “Silica-coated CdTe
quantum dots functionalized with thiols for bioconjugation to
IgG proteins,” Journal of Physical Chemistry B, vol. 110, no. 11,
pp. 5779–5789, 2006.
[22] N. N. Dinh, L. H. Chi, T. T. Chung Thuy, T. Q. Trung, and V.V. Truong, “Enhancement of current-voltage characteristics of
multilayer organic light emitting diodes by using nanostructured composite films,” Journal of Applied Physics, vol. 105, no.
9, Article ID 093518, 5 pages, 2009.
Copyright of Journal of Nanomaterials is the property of Hindawi Publishing Corporation and
its content may not be copied or emailed to multiple sites or posted to a listserv without the
copyright holder's express written permission. However, users may print, download, or email
articles for individual use.