DSpace at VNU: Pesticide residues in soils, sediments, and vegetables in the Red River Delta, northern Vietnam
Bạn đang xem bản rút gọn của tài liệu. Xem và tải ngay bản đầy đủ của tài liệu tại đây (399.29 KB, 13 trang )
Environ Monit Assess (2010) 169:285–297
DOI 10.1007/s10661-009-1170-8
Pesticide residues in soils, sediments, and vegetables
in the Red River Delta, northern Vietnam
Takuro Nishina · Chu Ngoc Kien ·
Nguyen Van Noi · Ha Minh Ngoc · Chul-Sa Kim ·
¯ o¯ Iwasaki
Sota Tanaka · Koz
Received: 22 April 2009 / Accepted: 19 August 2009 / Published online: 16 September 2009
© Springer Science + Business Media B.V. 2009
Abstract This study assessed pesticide residues
in soils, sediments, and vegetables in the Xuan
Khe and Hop Ly communes located along the
Chau Giang River in the Red River Delta,
northern Vietnam. Samples were collected from
agricultural areas within and outside of embankments built to prevent flooding. In Xuan Khe,
the soils outside of the embankment were more
clayey with higher organic matter contents compared with the inside, due to selective deposition during river flooding. Many of the soils
contained significant amounts of pesticides including dichlorodiphenyltrichloroethane (DDT),
dicofol, isoprothiolane, and metalaxyl although
their levels were below the maximum allowable concentration set by the Vietnamese gov-
ernment. The spectrum of DDT derivatives
found suggested that the source of DDTs
was not contaminated dicofol. Soils in Hop
Ly resembled soils in Xuan Khe but were
relatively sandy; one field showed appreciable contents of DDT derivatives. The ratios
of (p, p -dichlorodiphenyldichloroethylene + p, p dichlorodiphenyldichloroethane)/ DDT in the
surface and subsurface soils in Hop Ly were
0.34 and 0.57, suggesting that the DDTs originated from recent application. Pesticide residues
in soils were not likely to translocate into vegetable crops, except for metalaxyl. High concentrations of cypermethrins in kohlrabi leaves could
be ascribed to foliar deposition.
Keywords Pesticide residues · DDTs ·
Red River Delta · Flooding · Soils · Vegetables
T. Nishina · C.-S. Kim · K. Iwasaki (B)
Faculty of Agriculture, Kochi University, B200,
Monobe, Nankoku, Kochi 783-8502, Japan
e-mail:
C. N. Kien
United Graduate School of Agricultural Sciences,
Ehime University, Ehime 790-8566, Japan
N. V. Noi · H. M. Ngoc
Faculty of Chemistry, Hanoi University of Science,
Hanoi, Vietnam
S. Tanaka
Graduate School of Kuroshio Science,
Kochi University, Kochi, 783-8502, Japan
Introduction
In Asian developing countries, much attention
has been paid to pollution by pesticide residues
in agricultural environments since proper regulations were implemented and the phase-out
of highly toxic pesticides commenced in the
1980s and 1990s (Thao et al. 1993; Gong et al.
2004; Kim and Smith 2001; Bishnu et al. 2008).
Integrated Pest Management (IPM) programs
were implemented by Food and Agriculture
286
Organization (FAO) and other organizations in
the 1990s (Pontius et al. 2000; Winarto 2004).
In Vietnam, these IPM programs improved the
knowledge of local farmers about pesticide use
significantly, resulting in the reduction of pesticide application rates and a plunge in the total
consumption of pesticides in this country (Berg
2001; FAOSTAT 2008). However, few studies
have been conducted on the residues of currently
used pesticides. Khanh et al. (2006) reported that
the overuse of pesticides for weeding is still a serious problem in Vietnam, causing environmental
pollution, unsafe agricultural products, and human health hazards. Therefore, the fate of pesticides remaining in the environment should be
monitored to improve the safety of agricultural
products.
In general, soils in river deltas are extraordinarily fertile, resulting in extensive agricultural activities. In deltas, the soil texture can be
expected to change from coarser to finer with increasing distance from the river due to translocation and sedimentation during flooding (Leet and
Judson 1960). Several surveys of residual pesticides have been conducted in the Red River Delta
(Nhan et al. 1998; Toan et al. 2007) and Mekong
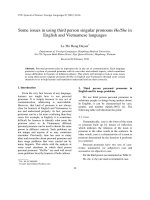
Fig. 1 The location of
sampling sites Hop Ly
and Xuan Khe, Vietnam
Environ Monit Assess (2010) 169:285–297
River Delta (Minh et al. 2007b). Although these
researches revealed that organochlorine pesticides were present in river sediments and in
agricultural and industrial soils, they did not compare the pesticide status of farm lands in terms
of the soil texture and its dependence on the
distance from rivers. In this study, we focused on
pesticide residues in agricultural soils of the Red
River Delta, the second largest agricultural area in
Vietnam. The aims of this study are (1) to evaluate
the pesticide status of soils on farm lands within
and outside the flooding area of the Red River and
(2) to understand vertical and horizontal movements of pesticides to better understand their fate
in this agricultural environment.
Materials and methods
Study area
This study was conducted in the Xuan Khe (XK;
20◦ 31 474 N, 106◦ 7 319 E) and Hop Ly (HL;
20◦ 36 678 N, 105◦ 59 311 E) communes in the Ha
Nam Province, northern Vietnam, located along
the Chau Giang River, one of the tributaries of the
Environ Monit Assess (2010) 169:285–297
Red River (Fig. 1). The surroundings of the Red
River and its tributaries are flooded annually in
the rainy season of every year. Elevated embankments were constructed in the two communes in
the late 1950s to prevent flood damages to residential and agricultural areas. The embankments
divide the communal areas into a flooded (F) area
and an area rarely affected by floods (nonflooded
(NF) area). The study region is characterized by
a monsoonal climate with distinct summer (May
to September) and winter (mid-November to midMarch) seasons and two transitional seasons including spring (mid-March to the end of April)
and autumn (October to mid-November). The
annual average temperature ranges from 23◦ C to
24◦ C. The average precipitation is approximately
1,900 mm (Ha Nam People’s Committee 2004).
Agricultural activities are based on the rotation
of lowland rice and vegetable cultivation. Rice
plants are cropped twice a year from February to
June and from July to October, followed by vegetable cropping from the end of October to late
February. Common vegetables planted in the area
are cabbage (Brassica oleracea L. var. capitata),
corn (Zea mays L.), cucumber (Cucumis sativus),
kohlrabi (B. oleracea var. gongylodes), and
soybean (Glycine max). Farmers usually apply
insecticides to vegetables when harmful insects
or disease symptoms occur. Generally, insecticides are applied more intensively to crops for
human consumption such as cabbage and cucumber than to corn which is used as livestock
feed.
Sampling
Field surveys and sample collection were conducted in November 2006 and November 2007.
In 2006, soil samples were collected from several
agricultural fields in XK and HL to study soil
characteristics and pesticide residue contents and
the possible effects of the embankments. Then,
in 2007, samples of soils, sediments, and vegetables were collected from XK to understand
pesticide movements. Soil samples were collected
from nine and seven fields in the F and NF areas,
respectively, of Xuan Khe and from three and
four fields in the F and NF areas, respectively, of
Hop Ly (Table 1). Each field was divided equally
287
into four quarters and surface (0–5 cm) and subsurface (20–25 cm) soil samples were collected at
the centers of the quarters. Immediately after the
four samples of equal weight were collected, they
were thoroughly mixed to obtain one composite
sample. Soil profiles were characterized at XKF8 and XK-NF10. In addition, sediments were
sampled using an Ekman dredge from irrigation
canals and the river. Soil and sediment samples
were stored in amber glass bottles. As shown in
Table 1, vegetable samples were collected from
12 selected fields. Vegetables (eight cabbages, 20
ears of corn, 50 cucumbers, eight kohlrabi, and 100
soybean pods with beans) were harvested near the
center of the quarters, and equal portions of each
subsample were taken to obtain approximately
1 kg of representative samples from each field.
The samples were wrapped in Teflon sheets and
immediately frozen in a refrigerator at −30◦ C.
Then, all samples were exported to Japan while
being kept frozen at −30◦ C. In Japan, the soil
samples were air-dried in a room and restored at
−30◦ C.
Physico-chemical properties of soils
and sediments
Soil particle size distributions were determined
with a pipette method (Gee and Bauder 1986).
The electric conductivity (EC) and pH (H2 O)
were determined using an EC and pH meter (pH/COND METER D-54, Horiba, Kyoto,
Japan) with a soil-to-water ratio of 1:5 (w/v). Exchangeable bases (Na+ , K+ , Mg2+ , Ca2+ ) were
extracted with 1 mol L−1 ammonium acetate at
pH 7.0, and the contents were determined using an atomic absorption spectrometer (AA-6800
Shimadzu, Kyoto, Japan). After removing ex−1
cess NH+
4 , the soil was extracted with 100 g L
NaCl solution, and the supernatant was used to
determine the cation exchange capacity (CEC)
with the Kjeldahl distillation and titration method
(Rhoades 1982). The content of total carbon was
analyzed by a CN analyzer (Microcorder JM10,
J Science Lab, Kyoto, Japan). The total carbon
value was converted to organic matter contents
by multiplying the value by 1.724 (Nelson and
Sommers 1982).
288
Table 1 List of soil,
vegetable, and sediment
samples collected from
Xuan Khe and Hop Ly in
the Ha Nam Province,
northern Vietnam
This survey was
conducted in 2006 and
2007. In the two
communes Xuan Khe and
Hop Ly, only soil samples
were collected in 2006. In
2007, soil, sediment, and
vegetable samples were
collected only in XK
F flooded area type, NF
nonflooded area type, XK
Xuan Khe, HL Hop Ly,
Y year when the soil and
vegetable samples were
collected in XK and HL
Environ Monit Assess (2010) 169:285–297
Locations
Crops
Xuan Khe
Flooded area (upland fields)
XK-F1
XK-F2
XK-F5
XK-F7
XK-F8
XK-F9
XK-F14
XK-F15
XK-F16
Sediments
XK-FS3
XK-FS4
Nonflooded area (upland fields)
XK-NF3
XK-NF4
XK-NF6
XK-NF10
XK-NF11
XK-NF12
XK-NF13
Sediments
XK-NFS1
XK-NFS2
Hop Ly
Flooded area (upland fields)
HL-F1
HL-F2
HL-F3
Nonflooded area (upland fields)
HL-NF4
HL-NF5
HL-NF6
HL-NF7
Simultaneous analysis of pesticides
Pesticides in soil, sediment, and vegetable samples
were screened following the method by Yabuta
et al. (2002) with some modifications. In the case
of soil and sediment samples, 10-g air-dried samples were extracted twice with 30 and 20 mL
acetonitrile by shaking for 1 h. The solution was
filtered using a glass filter (Glass microfiber filters GF/B, Whatman, Maidstone, England) and
16 mL water was added. Then, the extract was
passed through a C18 cartridge. After adding
7 mL 2 mol L−1 phosphate buffer saturated with
Corn
Kohlrabi
Corn
Cabbage
Corn
Kohlrabi
Cucumber
Cabbage
Soybean
Field size (a)
72.0
1.35
72.0
0.60
2.38
0.98
0.30
1.50
2.00
Soils
2006
2007
Y
Y
Y
Y
Y
Vegetables
2007
Y
Y
Y
Y
Y
Y
Y
Y
Y
Y
Y
Y
Y
Y
Soybean
Cucumber
Corn
Corn
Kohlrabi
Soybean
Cucumber
3.12
1.98
3.42
3.20
0.20
0.60
3.12
Y
Y
Y
Y
Y
Y
Y
Y
Y
Y
Y
Y
Y
Kohlrabi
Lettuce
Corn
1.68
2.00
4.00
Y
Y
Y
Cabbage
Corn
Lettuce
Corn
8.60
2.40
1.00
3.84
Y
Y
Y
Y
NaCl (pH 7.5), the extract was separated in a
separatory funnel containing 8.0 g NaCl. The acetonitrile layer obtained was concentrated using
a rotary evaporator and dried under a gentle
stream of nitrogen. The dried extract was loaded
with 2 mL of acetone/hexane (1:1) onto a cartridge packed with 0.5 g graphite carbon over
0.5 g of primary/secondary amine (PSA). The
cartridge was eluted with 20 mL acetone/hexane
(1:1) followed by 10 mL toluene. Fifty microliters of n-decane was added to the eluted extract to avoid vaporization of pesticides during
the concentration process. The extract was con-
Environ Monit Assess (2010) 169:285–297
centrated and dried under a stream of nitrogen.
The final volume was adjusted to 2 mL with
acetone/hexane (1:1). One hundred microliters
of a standard mixture (internal standards mix 2,
Hayashi Pure Chemical, Osaka, Japan) was added
to the final extract as an internal standard prior
to gas chromatography–mass spectrometry (GC–
MS) analysis. The composition of the standard
mixture was naphthalene-d8, acenaphthene-d10,
phenanthrene-d10, fluoranthene-d10, chrysened12, and perylene-d12.
One kilogram of the collected vegetables with
skins was homogenized using a home mixer. Ten
grams of the previously homogenized vegetables
was homogenized with 30 mL acetonitrile using a
homogenizer (IKA ULTRA-TURRAX T25 digital, Staufen, Germany). The homogenate was filtered using a glass filter, and 7 mL water was
added before passing the extract through a C18
cartridge. The procedure described above for soil
samples was employed for subsequent steps, except for two details. First, for the elution of the
graphite carbon and PSA cartridge, 20 mL of acetone/hexane (2:8) followed by 10 mL of toluene
were applied. Second, the amount of PSA in the
cartridge was increased to 1 g for cabbage, corn,
and kohlrabi, due to remove impurities from the
extracts for GC–MS analysis.
We used the GC–MS database “Compound
Composer Database Software for Simultaneous
Analysis” (Shimadzu, Kyoto, Japan) for automatic identification and semiquantification of
pesticides. Based on the requirements for this
database, a Shimadzu QP-2010 GC–MS (Shimadzu, Kyoto, Japan) with a J&W DB-5ms capillary column (Agilent Technologies, San Jose, CA,
USA) was used. Prior to a series of analyses, an
n-alkane (n-C9 H20 to n-C33 H68 ) mixture (Hayashi
Pure Chemical, Osaka, Japan) was analyzed to
adjust the retention times of registered pesticides.
Pesticides identified in the samples were semiquantified with an internal standard method.
Quantification of DDTs
In this paper, dichlorodiphenyltrichloroethanes
(DDTs) mean DDT and its metabolites
including
p, p -DDT,
o, p -DDT,
p, p dichlorodiphenyldichloroethylene (DDE), p, p -
289
dichlorodiphenyldichloroethane (DDD), and
o, p -DDD.
DDT represents the sum of
p, p -isomers of DDT, DDE, and DDD. DDTs
were extracted and quantified with the method
reported by the Water Quality Conservation
Bureau, The Japanese Environmental Agency
(2000). Briefly, 20 g of air-dried soils was shaken
twice with 50 mL acetone and filtered. The
extracts were dissolved in 500 mL of a 50-g L−1
NaCl solution. DDTs were extracted from
the mixture with 50 mL hexane. The hexane
extraction procedure was repeated three times.
Sodium sulfate was added to the hexane extracts.
After concentration with a rotary evaporator
under a stream of nitrogen, the extracts were
transferred to a cartridge packed with graphite
carbon (0.5 g), florizil (1 g), and PSA (0.5 g),
followed by elution with 35 mL acetone/hexane
(85:15) and 30 mL acetone/hexane (1:1). The
extracts were dried with a rotary evaporator
under a nitrogen stream. The final volume of the
solution was adjusted to 1 mL with hexane prior to
GC–MS analysis in selected ion monitoring (SIM)
mode. Recovery rates of DDTs were determined
by adding DDTs standards (ACCUStandards,
New Heaven, CT, USA) to the XK-F2 sample
which did not contain DDTs. The recovery rates
were 112%, 109%, 119%, 110%, and 135% for
p, p -DDE, o, p -DDD, p, p -DDD, o, p -DDT,
and p, p -DDT, respectively.
Quality control
Simultaneous analysis of pesticides
To ensure that the various pesticides could be
analyzed by the analytical method for simultaneous analysis of pesticides, a standard solution containing 57 pesticides (Pesticide standard solution
32; Kanto Chemical, Tokyo, Japan) was added to
representatives of each sample type to examine
the recovery rates. To select the representative
samples, first all soil and vegetable samples were
extracted using the procedure for simultaneous
analysis of pesticides described above, and pesticide residues in the samples were quantified using
the SIM mode of the GC–MS with an external
standard method. Then, samples which did not
contain any of the pesticides were identified, and a
290
Environ Monit Assess (2010) 169:285–297
Table 2 The detection limit (nanograms per gram) and
recovery rate (percent) of DDTs
DDTs
Detection limit
(ng g−1 ) a
Recovery
rate (%)
p, p -DDE
o, p -DDD
p, p -DDD
o, p -DDT
p, p -DDT
0.03
0.05
0.16
0.13
0.30
112
109
119
110
135
analyzed. None of the target compounds were
detected in the procedural blanks. Since XKF2 did not contain any DDTs when extracted
and analyzed by the methods described, it was
selected and spiked with the standard solution
of the DDTs for a recovery study. The spiked
concentration levels of DDTs for the recovery
study were 100 ng g−1 . The recovery rates of
the DDTs spiked to the soil ranged from 109%
to 135% (Table 2). The limits of detection were
described as three times that of the signal-to-noise
ratio. The detection limit was 0.03 to 0.3 ng g−1
(Table 2).
a Detection limits of the each DDT were calculated as three
times the signal-to-noise ratio
representative sample from each sample type was
chosen for examination of the recovery rates (soil:
XK-F2 0–5 cm, vegetable: cabbage, XK-F15; corn,
XK-F1; cucumber, XK-NF13; kohlrabi tuber, XKF2; soybean, XK-NF12). Recovery rates were
determined by adding the 57 pesticides to the samples, extracting by the procedure, and quantifying
using the SIM mode of the GC–MS. Satisfactory
recovery rates (50% to 150%) were obtained for
53, 46, 42, 44, 25, and 43 of the 57 pesticides added
to samples of the soil, cabbage, corn, cucumber,
kohlrabi tuber, and soybean, respectively.
Statistical analysis
Soil physicochemical properties were compared
between F and NF areas by Tukey’s multiple comparison, using the SPSS software package (Release 13.0 for Windows; SPSS Inc.).
Results
Analysis of DDTs
Physico-chemical properties of soils and
sediments
For quality assurance and quality control of the
analysis of DDTs, the procedural blanks and
matrixes spiked with the standard solution were
Based on the US Department of Agriculture classification system, the soils in the XK-NF area
Table 3 General physicochemical properties of the soils
Location
pH
EC
OM
Exchangeable bases
(H2 O)
(mS m−1 )
(g kg−1 )
Na+
K+
Ca2+
CEC
cmolc kg−1
Surface
XK-F (n = 7)a
XK-NF (n = 7)
HL-F (n = 4)
HL-NF (n = 3)
Subsurface
XK-F (n = 7)
XK-NF (n = 7)
HL-F (n = 4v)
HL-NF (n = 3)
Clay
Silt
Sand
Mg2+
%
7.21 A
5.94 B
6.69 A
6.10 A
39.4 A
46.9 A
26.4 A
18.3 A
11.3 B
21.6 A
6.8 B
7.4 B
0.25 B
0.51 A
0.19 B
0.19 B
0.34 A
0.29 A
0.11 A
0.12 A
14.5 A
11.0 AB
7.7 B
6.9 B
2.20 AB
2.87 A
1.54 B
1.38 B
10.2 B
14.9 A
6.43 B
7.86 B
19 B
43 A
7B
13 B
32 A
40 A
25 A
35 A
48 A
16 B
68 A
51 A
7.32 a
6.58 a
8.10 a
7.42 a
14.2 a
26.4 a
10.6 a
10.1 a
7.7 b
14.2 a
4.0 b
3.7 b
0.22 b
0.49 a
0.17 b
0.18 b
0.15 ab
0.20 a
0.06 bc
0.09 b
13.6 a
9.8 a
11.3 a
14.6 a
1.81 b
3.07 a
1.34 b
1.67 b
8.72 b
13.7 a
7.13 b
9.08 ab
18 b
46 a
12 b
21 b
30 a
40 a
27 a
40 a
51 a
14 b
61 a
39 ab
Average values followed by the same capital letter are not significantly different at the 5% level (surface soils) and neither
are those followed by the same small letter (subsurface soil), as determined by Tukey’s method
OM organic matter content
a XK-F1 and XK-F5 were omitted from the data because the composite sample may not be representative of the field due to
the large field size (see Table 1)
Environ Monit Assess (2010) 169:285–297
291
Table 4 General physicochemical properties of sediments collected in Xuan Khe
Location
pH
EC
OM
Exchangeable bases
(H2 O)
(mS m−1 )
(g kg−1 )
Na+
K+
Ca2+
CEC
cmolc kg−1
Sediment
XK-F-SD (n = 2)
XK-NF-SD (n = 2)
6.96
6.08
36.0
56.3
38.1
45.5
0.22
0.31
0.42
0.52
Clay
Silt
Sand
36
37
35
23
Mg2+
%
15.3
11.7
2.16
2.38
13.2
15.0
29
40
SD sediment samples, OM organic matter content
were classified as Vertic Ustorthents while those
in the XK-F area were Typic Udipsamments (Soil
Survey Staff 2006). Although soil pits were not
surveyed in HL, the soils in the HL-F and HL-NF
areas showed similar properties as those in XKF. Therefore, they could be tentatively classified
as Typic Udipsamments or its relatives. Generally,
the clay and organic matter contents of the soils in
XK were higher than those in HL (Table 3). This
trend was most pronounced in the subsurface soils
of the XK-F and HL-F areas. Differences in the
amount of exchangeable bases were insignificant
between XK and HL.
In XK, the clay and organic matter contents of
the NF soils were significantly higher than in the
F area. On the other hand, the amounts of exchangeable bases were not significantly different
between the F and NF area, except for Mg2+ in
the subsurface soils and Na+ in the surface and
subsurface soils. Sediments in the NF area also
showed increased clay and organic matter contents but similar amounts of exchangeable bases
(Table 4).
In HL, there was no significant difference in
the clay and organic matter contents between
the F and NF areas although values tended to
Table 5 Frequency of fields in which pesticides were detected
Xuan Khe
Flooded areaa
Surface
Subsurface
Sediment
Nonflooded area
Surface
Subsurface
Sediment
Hop Ly
Flooded area
Surface
Subsurface
Nonflooded area
Surface
Subsurface
Total number
of fields
Number of fields
with pesticidesb
Percentage of fields
with pesticides (%)c
7
2
1
0
29
14
6
4
1
86
57
3
1
0
33
0
4
1
1
25
25
2
7
2
XK Xuan Khe, HL Hop Ly
a XK-F1 and XK-F5 were omitted from the data because the composite sample may not be representative of the field due to
the large field size (see Table 1)
b Fields with pesticides indicates fields with any pesticides detected by simultaneous analysis of pesticides in the soils
c Percentage of fields with pesticides was calculated by (number of fields with pesticides/total number of fields) × 100
292
Environ Monit Assess (2010) 169:285–297
be higher in the NF area except for the organic matter contents in the subsurface soils.
The amounts of exchangeable bases were not
significantly different between the F and NF
areas.
Analysis of pesticide residues in soils, sediments,
and vegetables
The frequency of fields where at least one pesticide was detected is shown in Table 5. It is evident
that the fields in XK-NF were highly affected by
pesticide residues, compared with the other areas.
In the F and NF areas of HL, pesticide residues
were detected only in one field each.
More detailed information on the pesticides
detected are given in Table 6. In the NF area of
XK, DDTs were found. However, semiquantitative analysis indicated that their concentrations
were lower than 5.0 and 5.3 ng g−1 in the surface
and subsurface soils, respectively. Isoprothiolane,
metalaxyl, dicofol, and cypermethrins were also
detected. Isoprothiolane was found both in the
surface and subsurface soils of XK-NF3, XK-
Table 6 Pesticide residues in soils and sediments collected in Xuan Khe and Hop Ly
Sites
Xuan Khe
Flooded area (upland fields)
XK-F7
XK-F14
Nonflooded area (upland fields)
XK-NF3
Surface layer (0–5 cm)
Pesticides
Cabbage
Fenobucarb
Chlorothalonil
Metalaxyl
0.4
36.7
9.8
Dicofol
Isoprothiolane
p, p -DDE
p, p -DDD
Metalaxyl
Isoprothiolane
Cypermethrinsa
p, p -DDE
p, p -DDE
Isoprothiolane
Dicofol
p, p -DDE
5.6
7.4
1.2
0.2
55.0
9.6
121.9
0.7
0.3
7.6
6.9
3.6
Metalaxyl
Isoprothiolane
5.9
10.6
Isoprothiolane
6.6
Cucumber
Soybean
XK-NF4
Cucumber
XK-NF6
XK-NF11
XK-NF12
Corn
Kohrlabi
Soybean
XK-NF13
Cucumber
Sediments
XK-NFS3
Hop Ly
Flooded area (upland fields)
HL-F3
Nonflooded area (upland fields)
HL-NF6
Subsurface layer (20–25 cm)
Crop
Corn
DDVP
Fenobucarb
Fenitrothion (MEP)
Lettuce
p, p -DDE
p, p -DDT
Concentration
(ng g−1 )
Pesticides
Concentration
(ng g−1 )
Isoprothiolane
3.5
Dicofol
Isoprothiolane
p, p -DDE
p, p -DDD
Metalaxyl
Isoprothiolane
p,p -DDE
16.0
8.9
3.2
2.2
2.7
16.6
1.4
Dicofol
p, p -DDE
p, p -DDD
Isoprothiolane
7.3
2.2
3.1
34.5
4.8
0.8
31.4
3.4
1.6
Pesticide residues were not detected in any of the sites omitted from this table
XK Xuan Khe, HL Hop Ly, F flooded area, NF nonflooded area
a Values for cypermethrins are the sums for cypermethrin 1 to 4
p, p -DDE
1.7
Environ Monit Assess (2010) 169:285–297
293
Table 7 Pesticide residues in vegetables collected in Xuan Khe
Location
Flooded area
XK-F2
XK-F9
XK-F14
XK-F16
Nonflooded area
XK-NF13
Sample type
Pesticides
Concentration (ng g−1 )
Kohlrabi (tuber)
Kohlrabi (leaf)
Kohlrabi (tuber)
Kohlrabi (leaf)
Cucumber
Soybean (pod)
Cypermethrinsa
Cypermethrins
Cypermethrins
Cypermethrins
Metalaxyl
Cypermethrins
42.5
2,523
11.1
2,280
54.5
230
Cucumber
Metalaxyl
31.3
No pesticide residues were detected in corn in XK-F-1, XK-F-5, XK-F-8, and XK-NF-10, cabbage in XK-F-15, kohlrabi
(tuber and leaf) in XK-NF-11, and soybean (bean and pod) in XK-NF-12
XK-F Xuan Khe flooded area, XK-NF Xuan Khe nonflooded area
a Values for cypermethrins are the sums for cypermethrin 1 to 4
NF4, and XK-NF13; higher concentrations were
present in the subsurface samples. Dicofol detected in XK-NF3 and XK-NF12 showed the same
trend. In contrast, the concentrations of metalaxyl
in the surface soils of XK-NF4, XK-NF13, and
XK-NF14 were higher than in the subsurface soils
while cypermethrins (cypermethrins 1 to 4) were
detected at a high concentration in the surface soil
of XK-NF4. In XK-F14, metalaxyl was detected in
the surface soil while isoprothiolane was present
in the subsurface soil. Chlorothalonil and fenobucarb were detected in XK-F7 (Table 6).
The sediment sample XK-NFS3 taken from a
canal in the NF area contained isoprothiolane. No
pesticides were detected in sediments collected
in the F area. In HL, 2,2-dichlorovinyl dimethyl
phosphate (DDVP), fenobucarb, and fenitrothion
were found only in the surface soils of HL-F3, and
DDTs were detected only in the NF area.
In the vegetable samples collected in XK, pesticides were detected at a higher frequency in the
F area than in the NF area, in contrast to the
situation in soils (Table 7). Kohlrabis at XK-F2
and XK-F9 showed high concentrations of cypermethrins with relatively low levels in the tubers
(Table 7). Cypermethrins were also detected in
soybean pods at XK-F16 while metalaxyl was
found in cucumbers at XK-F14 and XK-NF13.
Quantification of DDTs
Based on the results of the simultaneous analysis
of multiple pesticides, DDTs were quantified in
the soil samples from the XK-NF and HL-NF
Table 8 DDT and its metabolites in soils
Location
Xuan Khe
XK-NF3 surface
XK-NF3 subsurface
XK-NF4 surface
XK-NF4 subsurface
XK-NF6 surface
XK-NF12 surface
XK-NF12 subsurface
Hop Ly
HL-NF6 surface
HL-NF6 subsurface
n.d. not detected
Concentration (ng g−1 )
p,p -DDE
o,p -DDD
p,p -DDD
o,p -DDT
p,p -DDT
DDTs
3.84
4.96
2.12
2.07
1.57
5.40
4.25
0.71
n.d.
n.d.
n.d.
n.d.
1.28
2.46
3.59
5.61
n.d.
n.d.
2.48
3.89
5.70
n.d.
n.d.
n.d.
n.d.
n.d.
n.d.
n.d.
n.d.
n.d.
n.d.
n.d.
n.d.
0.38
0.54
8.14
10.57
2.12
2.07
4.05
10.95
12.95
7.33
5.84
n.d.
0.23
0.86
0.44
1.62
0.91
15.60
4.75
25.41
12.17
294
areas. In the HL-NF area, DDTs were detected
only at HL-NF6, as mentioned above. The concentrations of the DDTs in the soils of the two
communes ranged from 2.07 to 25.41 ng g−1 , with
the highest value recorded in the surface soil of
HL-NF6 (Table 8).
In XK, the concentrations of p, p -DDE and
p, p -DDD exceeded those of the other DDT
forms and their metabolites. In the surface soils
of XK-NF3, XK-NF4, and XK-NF12, the concentration of p, p -DDE were higher than that of
p, p -DDD. On the other hand, in the subsurface
soils of XK-NF3 and XK-NF12, the concentration
of p, p -DDD exceeded that of p, p -DDE. The
concentrations of p, p -DDE and p, p -DDD in
XK-NF3 were lower in the surface soil than in
the subsurface soil, while the opposite was true
in XK-NF12. It is noteworthy that p, p -DDT and
o, p -DDD were detected only in the surface and
subsurface soils of XK-NF12. Compared with the
results from XK, the concentrations of p, p -DDT
detected in HL-NF6 were very high; o, p -DDT
was also found at a relatively high concentration.
Discussion
Differences in soil characteristics between the F
and NF areas
In XK, the clay contents of the soils in the NF
area were significantly higher than those in the
F area. During flooding, fine sand, silt, and clay
are carried over the flood plain away from the
rivers while coarser materials are deposited within
rivers and in their vicinity (Leet and Judson 1960).
Therefore, the differences in the soil texture observed between the XK-F and XK-NF areas could
be ascribed to the selective deposition of the sand
fraction in the F area and of silt and clay in the NF
area. The higher contents of organic matter and
higher CEC of soils in the NF area were probably
due to their clayey texture because clay particles
protect soil organic matter from decomposition
(Foth 1984).
In HL, higher clay and organic matter contents
were found in the NF than in the F area although
the differences were not statistically significant.
This might be ascribed to the relative closeness of
Environ Monit Assess (2010) 169:285–297
the HL-NF area to the river compared with the
situation in XK (Fig. 1).
In spite of higher clay and organic matter contents in the NF areas as compared to the F areas,
the amounts of exchangeable bases tended to be
similar in F and NF areas. This might be a result
of the similar agricultural practices including fertilizer application in the two communes.
Pesticide residues in soils, sediments,
and vegetables
In the northern mountainous region of Vietnam,
Sugiura (2004) found that pesticides commonly
applied to rice, tomato, kohlrabi, tea, and orange were alpha-cypermethrin, chlorothalonil,
fenitrothion, and fenobucarb. In addition to these
pesticides, isoprothiolane and metalaxyl were
commonly used by the farmers of the communes
under the survey. The Vietnamese government
set the maximum allowable concentration (MAC)
in soils at 500 ng g−1 for cypermethrins and
at 100 ng g−1 for isoprothiolane and fenobucarb (TCVN 5941 1995). Cypermethrins, isoprothiolane, and fenobucarb detected in our study were
below the MACs. Bishnu et al. (2008) reported
that dicofol contents in tea fields ranged from
below 10 to 896 ng g−1 at 15 to 20 days after
application, while those of cypermethrin remained
below 10 ng g−1 . Compared to these values, the
present study showed higher concentrations of
cypermethrins and much lower concentrations of
dicofol.
Pesticide residues occurred most frequently in
the XK-NF area. Organic matter plays an important role in retaining pesticides and organic
compounds in soils (Chen et al. 2005; Gong et al.
2004). Our results suggested that the clayey soils
with high organic matter contents in the XK-NF
area had a higher ability to retain pesticides than
the sandy soils in XK-F, HL-F, and HL-NF areas,
which agreed with previous reports.
Since pesticide residues were found at higher
frequencies in the XK soils, additional samples of
vegetables and sediments were taken in XK to
understand pesticide movements. In contrast to
the trends observed in the soils, kohlrabi leaves
and soybean pods collected from the XK-F area
contained high concentrations of cypermethrins.
Environ Monit Assess (2010) 169:285–297
Since cypermethrins had not been detected in XKF9 and XK-F16 soil samples, foliar deposition
may be the main source of cypermethrins at these
locations. Plant architecture significantly affects
pesticide interception. For example, Repley et al.
(2003) noted that the residual levels of applied
pesticides were lower on head lettuce whose architecture allowed pesticides to be deposited on
all leaves. Since kohlrabi leaf blades form several
layers above the tubers where they may intercept sprayed pesticides, the high concentration
of cypermethrins observed was probably due to
increased deposition on the plants. Compared to
the high concentrations in the kohlrabi leaves, the
concentrations of cypermethrins in the kohlrabi
tubers, the edible part of the kohlrabi, were lower
than the maximum allowable concentrations set
by the Vietnamese government. Therefore, the
risk of food poisoning for humans was considered
to be low.
In the case of metalaxyl, there could be two
ways for this compound to migrate into the cucumber, either by foliar deposition or by root
uptake; this was based on the fact that it was
found in the fruits as well as in the soils of the
cucumber fields. On the other hand, the isoprothiolane, DDTs, and dicofol present in the soils
were probably not readily available for uptake by
the vegetables since the concentration of these
pesticides was low compared to that of the metalaxyl in the soil, and they were not detected in the
vegetables.
Pesticide profile
Isoprothiolane and metalaxyl have similar Koc
values of 258 ml g−1 (Sudo et al. 2002) and 29–
287 mg g−1 (Hornsby et al. 1996), respectively. In
spite of this similarity, the concentrations of isoprothiolane were higher in the surface soils than
those in the subsurface soils while the opposite
trend was observed for metalaxyl. This may be
explained by differences in the application schedule. Isoprothiolane is frequently applied to rice
plants to prevent rice blast infection during the
summer season. Therefore, isoprothiolane might
have gradually leached to the subsurface soils
where it was detected when samples were taken
in November. Isoprothiolane was also detected in
295
sediments collected from a canal in the XK-NF
area (XK-NFS3). This supported the idea that isoprothiolane had been applied in the previous cultivation season, leached to subsurface soil layers,
and subsequently moved into the canal. On the
other hand, farmers apply metalaxyl to cucumber
to prevent dumping off. Since our samples were
collected in the harvesting season of cucumber,
the pesticide still was present mainly in the surface
soils.
Dicofol was detected at higher concentrations
in the subsurface soils than in the surface soils
at XK-NF3 and XK-NF12. Accurate data on the
usage of dicofol in Vietnam is not available (Minh
et al. 2006, 2007a). However, the higher concentrations of dicofol in the subsurface soils as compared to the surface layers suggested that it had
been applied in a previous cultivating season.
DDT in soils
Thao et al. (1993) collected soil samples from five
paddy fields near Hanoi in 1990 and reported that
the summed concentrations of p, p -DDE, p, p DDD, p, p -DDT, and o, p -DDT ranged from 0.73
to 1,300 ng g−1 . On the other hand, the concentrations of p, p -DDE, p, p -DDD, and p, p -DDT
ranged from <0.02 to 171.83 ng g−1 in 60 surface
soil samples collected in 2006 from agricultural
and industrial areas in the center and suburban
districts of Hanoi (Toan et al. 2007). Compared
to those values, the concentration range of DDTs
obtained in the present study (1.57 to 25.41 ng g−1 )
was low and well below the MAC of 100 ng g−1 .
These data suggest that DDTs in soils tend to
decline in Vietnam, although the concentrations
of DDTs are highly variable depending on the
sampling location.
The concentrations of DDTs in XK-NF3 and
XK-NF12 were higher in the subsurface soils than
in the surface soils, which implied that a portion of
the DDT applied to the surface soils was degraded
as it moved downward. The concentrations of
DDTs in XK-NF3 and XK-NF12 were higher in
the subsurface soils than in the surface soils, which
implied that the DDT applied to the surface soils
was leached downward. Moreover, in the subsurface soils, the higher concentration of p, p -DDD
than that of p, p -DDE could possibly indicate that
296
the anaerobic conditions of the clayey soils in XK
enhanced the anaerobic degradation of DDT to
DDD.
Toan et al. (2007) reported that the ratio of
( p, p -DDE + p, p -DDD)/ DDT in soils collected from the greater Hanoi area ranged from
0.75 to 0.99 and suggested that significant degradation of DDT had occurred in the soils. The ratios
of ( p, p -DDE + p, p -DDD)/ DDT in XK-NF13 were 0.96 and 0.95 in the surface and subsurface
soils, respectively, comparable to the highest value
reported by Toan et al. (2007). These high ratios
indicated significant degradation of DDT and suggested no recent input of DDT in XK.
Dicofol was detected in XK-NF3 and XK-NF12
together with DDTs. Qui et al. (2005) reported
that dicofol contained approximately 10% to 32%
DDTs. These DDT contaminations are characterized by a high proportion of o, p -DDT. However,
we did not detect o, p -DDT, suggesting that the
DDTs we detected were not due to an application
of DDT-contaminated dicofol but to previous applications of DDT.
The concentrations of DDTs were higher in
HL than in XK. The ratios of ( p, p -DDE + p, p DDD)/ DDT in HL-NF6 were 0.34 and 0.57
in the surface and subsurface soils, respectively;
these values were lower than those found in XK.
These results may indicate a recent application of
DDT in XK. The fact that the concentration of
total DDTs was higher in the surface soils than in
the subsurface soil supports the conclusion.
Conclusion
In this study, pesticide residues in fields of two
communes in the Red River Delta were determined. Through the process of selective deposition of particles during river flooding, clayey soils
with high organic matter contents were formed
in the XK-NF area. These soils were found to
contain more pesticides than the sandy soils in
the XK-F, HL-F, and HL-NF areas. The usage
of dicofol on the sites was confirmed through its
residues in the soils, but the DDT that also was
detected had probably not been deposited as a
contamination of the dicofol applied. Although
the pesticide concentrations in soils and edible
Environ Monit Assess (2010) 169:285–297
parts of vegetables were below the MAC set by
the Vietnamese government, an appropriate education of farmers regarding pesticide selection and
application seems necessary since our results suggest the recent usage of DDT. Therefore, it would
be necessary for the Vietnamese government to
take countermeasures against the application and
smuggling of illegal pesticides. In addition, domestic animals fed with vegetable by-products such as
kohlrabi leaves may be affected as these materials
were found to contain high pesticide concentrations, raising the possibility of undesired pesticide
bioaccumulation.
Acknowledgement This research was financially supported by a Grant-in-Aid for Scientific Research to K.
Iwasaki (grant no. 18380195) from the Japan Society for
the Promotion of Science.
References
Berg, H. (2001). Pesticide use in rice and rice–fish farms in
the Mekong Delta, Vietnam. Crop Protection, 20, 897–
905.
Bishnu, A., Chakrabarti, K., Chakraborty, A., & Saha, T.
(2008). Pesticide residue level in tea ecosystems of
Hill and Dooars regions of West Bengal, India. Environmental Monitoring and Assessment, 149, 457–464.
doi:10.1007/s10661-008-0222-9.
Chen, L., Ran, Y., Xing, B., Mai, B., He, J., Wei, X., et al.
(2005). Contents and sources of polycyclic aromatic
hydrocarbons and organochlorine pesticides in vegetable soils of Guangzhou, China. Chemosphere, 60,
879–890. doi:10.1016/j.chemosphere.2005.01011.
FAOSTAT (2008). Pesticide consumption in Vietnam.
Resource document. FAOSTAT. .
org/site/ 424/DesktopDefault.aspx?PageID=424. Accessed 20 Oct 2008.
Foth, H. D. (1984). Chapter 6: Soil organic matter. In
H. D. Foth (Ed.), Fundamental of soil science (7th ed.,
pp. 151–168). New York: Wiley.
Gee, G. W., & Bauder, J. W. (1986). Particle-size analysis.
In A. Klute (Ed.), Methods of soil analysis: Part 1—
physical and mineralogical methods (2nd ed., pp. 383–
411). Madison: American Society of Agronomy, Soil
Science Society of America.
Gong, Z. M., Tao, S., Xu, F. L., Dawson, R., Liu, W. X.,
Cui, Y. H., et al. (2004). Level and distribution of DDT
in surface soils from Tianjin, China. Chemosphere, 54,
1247–1253. doi:10.1016/j.chemosphere.003.10.021.
Ha Nam People’s Committee. (2004). Climate and hydrography in Ha Nam Province. Resource document.
Ha Nam People’s Committee. am.
gov.vn/index.asp?newsID=512&language=english.
Accessed 22 Oct 2008.
Environ Monit Assess (2010) 169:285–297
Hornsby, A. G., Wauchope, R. D., & Herner, A. E. (1996).
Appendix B: The data. In A. G. Hornsby, R. D.
Wauchope, & A. E. Herner, (Ed.), Pesticide properties
in the environment (pp. 33–206). New York: Springer.
Khanh, T. D., Xuan, T. D., Chin, D. V., Chung, I. M.,
Abdelghany, E. A., and Tawata, S. (2006). Current
status of biological control of paddy weeds in Vietnam.
Weed Biology and Management, 6, 1–9.
Kim, J. H., & Smith, A. (2001). Distribution of
organochlorine pesticides in soils from South Korea.
Chemosphere, 43, 137–140.
Leet, L. D., & Judson, S. (1960). Running water. In L. D.
Leet, & S. Judson (Ed.), Physical geology (2nd ed., pp.
159–197). Englewood Cliffs: Prentice-Hall.
Minh, N. H., Minh, T. B., Kajiwara, N., Kunisue, T.,
Subramanian, A., Iwata, H., et al. (2006). Contamination by persistent organic pollutants in dumping sites of Asian developing countries: Implication
of emerging pollution sources. Archives of Environmental Contamination and Toxicology, 50, 474–481.
doi:10.1007/s00244-005-1087-3.
Minh, N. H., Minh, T. B., Iwata, H., Kajiwara, N., Kunisue,
T., Takahashi, S., et al. (2007a). Persistent organic pollutants in sediments from Sai Gon-Dong Nai River
basin, Vietnam: Levels and temporal trends. Archives
of Environmental Contamination and Toxicology, 52,
458–465. doi:10.1007/s00244-006-0157-5.
Minh, N. H., Minh, T. B., Iwata, H., Kajiwara, N., Kunisue,
T., Takahashi, S., et al. (2007b). Pollution sources
and occurrence of selected persistent organic pollutants (POPs) in sediments of the Mekong River
Delta, South Vietnam. Chemosphere, 67, 1794–1801.
doi:10.1016/j.chemosphere.2006.05.144.
Nelson, D. W., & Sommers, L. E. (1982). Total carbon,
organic carbon, and organic matter. In A. L. Pace,
R. H. Miller, & D. R. Keeney (Ed.), Methods of soil
analysis: Part2—chemical and microbiological properties (2nd ed., pp. 149–165). Madison: American Society
of Agronomy, Soil Science of America.
Nhan, D. D., Am, N. M., Hoi, N. C., Dieu, L. V.,
Carvalho, F. P., Villeneuve, J.-P., et al. (1998).
Organochlorine pesticides and PCBs in the Red River
Delta, northern Vietnam. Marine Pollution Bulletin,
36, 742–749.
Pontius, J., Dilts, R., & Bartlett, A. (2000). Chapter 1: Ten
years of IPM field schools. In J. Pontius, R. Dilts, & A.
Bartlett (Eds.), From farmer field schools to commune
IPM: Ten years of IPM training in Asia (pp. 1–8).
Jakarta: FAO Commune IPM Programme.
Qui, X. H., Zhu, T., Yao, B., Hu, J. X., & Hu, S. W. (2005).
Contribution of dicofol to the current DDT pollution
297
in China. Environmental Science and Technology, 39,
4385–4390.
Repley, D. B., Ritcey, G. M., Harris, C. R., Denomme, M.
A., & Lissemore, L. I. (2003). Comparative persistence
of pesticides on selected cultivars of specialty vegetables. Journal of Agricultural and Food Chemistry, 57,
1328–1335.
Rhoades, J. D. (1982). Cation exchange capacity. In A. L.
Pace, R. H. Miller, & D. R. Keeney (Ed.), Methods
of soil analysis: Part2—chemical and microbiological
properties (2nd ed, pp. 149–165). Madison: American
Society of Agronomy, Soil Science of America.
Soil Survey Staff (2006). Keys to soil taxonomy. The 18th
World Congress of Soil Science, Pennsylvania.
Sudo, M., Kunimatsu, T., & Okubo, T. (2002). Concentration and loading of pesticide residues in Lake Biwa
basin (Japan). Water Research, 36, 315–329.
Sugiura, M. (2004). Case studies on current pesticide use
situation in northern mountainous areas in Vietnam.
Agrochemicals Japan, 85, 22–25.
TCVN 5941 (1995). Soil quality, pesticide residue limits
(TCVN 5941, 1995). Vietnamese Ministry of Science
and Technology. />vietnam/regs/virsp.html#table1. Accessed 20 Oct 2008.
Thao, V. D., Kawano, M., & Tatsukawa, R. (1993). Persistent organochlorine residues in soils from tropical
and sub-tropical Asian countries. Environmental Pollution, 81, 61–71.
Toan, V. D., Thao, V. D., Walder, J., Schmutz, H. R., &
Ha, C. T. (2007). Contamination by selected
organochlorine pesticides (OCPs) in surface soils
in Hanoi, Vietnam. Bulletin of Environmental Contamination and Toxicology, 78, 195–200. doi:10.1007/
s00128-007-9149-z.
Water Quality Conservation Bureau, the Japanese
Environmental Agency (2000). Analytical method
for organochlorine pesticides. In Water Quality
Conservation Bureau, the Japanese Environmental
Agency (Ed.), Analytical methods for environmental
pollutants such as pesticides. Tokyo: The National
Printing Bureau of the Ministry of Finance.
(in Japanese).
Winarto, Y. T. (2004). The evolutionary changes in
rice–crop farming: Integrated pest management in
Indonesia, Cambodia, and Vietnam. Southeast Asian
Studies, 42, 174–184.
Yabuta, M., Sakaguchi, Y., Tanizawa, H., Yokoya, Y.,
Sakaguchi, M., Inagaki, E., et al. (2002). Pesticide
residues in imported agricultural products. Abstract
for 25th Society of Pesticide Residue Analysis Research, 148–154 (in Japanese).