DSpace at VNU: Effect of electrodeposition potential on composition and morphology of CIGS absorber thin film
Bạn đang xem bản rút gọn của tài liệu. Xem và tải ngay bản đầy đủ của tài liệu tại đây (491.28 KB, 7 trang )
Bull. Mater. Sci., Vol. 36, No. 4, August 2013, pp. 735–741. c Indian Academy of Sciences.
Effect of electrodeposition potential on composition and morphology
of CIGS absorber thin film
N D SANG† , P H QUANG ∗ , L T TU and D T B HOP
Hanoi University of Science, Vietnam National University, Hanoi, 334 Nguyen Trai, Thanh Xuan, Hanoi, Vietnam
† National University of Civil Engineering, 55 Giai Phong Street, Hai Ba Trung, Hanoi, Vietnam
MS received 2 December 2011; revised 23 April 2012
Abstract. CuInGaSe (CIGS) thin films were deposited on Mo/soda-lime glass substrates by electrodeposition at
different potentials ranging from −0·3 to −1·1 V vs Ag/AgCl. Cyclic voltammetry (CV) studies of unitary Cu,
Ga, In and Se systems, binary Cu–Se, Ga–Se and In–Se systems and quaternary Cu–In–Ga–Se were carried out
to understand the mechanism of deposition of each constituent. Concentration of the films was determined by
energy dispersive spectroscopy. Structure and morphology of the films were characterized by X-ray diffraction
and scanning electron microscope. The underpotential deposition mechanism of Cu–Se and In–Se phases was
observed in voltammograms of binary and quaternary systems. Variation in composition with applied potentials was
explained by cyclic voltammetry (CV) data. A suitable potential range from −0·8 to −1·0 V was found for obtaining
films with desired and stable stoichiometry. In the post-annealing films, chalcopyrite structure starts forming in the
samples deposited at −0·5 V and grows on varying the applied potential towards negative direction. By adjusting
the composition of electrolyte, we obtained the desired stoichiometry of Cu(In0·7 Ga0·3 )Se2 .
Keywords.
1.
Thin films; cyclic voltammetry; CuInGaSe (CIGS); solar cell; electrodeposition.
Introduction
Cu(In1−x Gax )Se2 (CIGS) thin film has potential as an
absorber material for solar cell application because it has
a large optical absorption coefficient (5 × 105 cm−1 ) which
results from the direct bandgap (Bhatacharya et al 1998;
Hermann et al 1998). CIGS basethin film solar cell has
reached a conversion efficiency of 19·9% for laboratorysize devices fabricated from a physical vapour deposition
(PVD) process (Repinst et al 2008). Additionally, CIGS
modules have shown a long-term stability without any signs
of degradation (Bhatacharya et al 1998; Hermann et al
1998). In order to make CIGS-based solar cell become more
realizable, an alternative low-cost process has to be developed for the growth of high-quality CIGS absorber layer.
Electrodeposition technique is potentially suitable to satisfy this requirement. Recently, there has been a number of
reports on the growth of CIGS thin film using electrodeposition technique. A conversion efficiency as high as 15·4%
has been achieved in the devices with CIGS film grown
by electrodeposition and the composition adjusted by PVD
(Bhatacharya et al 2000). There are two different electrochemical approaches to form CIGS films: one-step electrodeposition (Zank et al 1996; Kampmann et al 2000;
Zhang et al 2003; Fernandez and Bhatacharya 2005; Kang
et al 2010) that provides all constituents from the same
∗ Author
for correspondence ()
electrolyte in a single-step and multi-step electrodeposition that deposits sequentially each constituent from different electrolytes (Friedfeld et al 1999; Kampmann et al
2003). However, one-step electrodeposition of CIGS films
is rather difficult due to large difference in the values of
equilibrium reduction potential for each constituent. In this
technique, to achieve a desired film composition, a balancing of fluxes of the constituents can be done by adjusting the concentration in the solution as well as deposition
potential. In this investigation, we study the deposition
mechanism of the constituents by using cyclic voltammetry (CV) technique. We also grow CIGS thin films on
Mo/soda-lime glass substrates by electrodeposition at different potentials ranging from −0·3 to −1·1 V vs Ag/AgCl.
The aim of this work is mainly to find out the appropriate deposition potential in one-step electrodeposition of
CIGS layer. However, based on the understanding of electrodeposition mechanism of different constituents, we also
made an attempt to vary the concentration of electrolyte for
matching the stoichiometry of Cu(In0·7 Ga0·3 )Se2 .
2.
Experimental
CV studies and potentiostatic electrodeposition (ED) process were carried out using a potentiostat/galvanostat model
Autolab 3020 N in a three-electrode configuration where
the reference electrode was Ag/AgCl, the counter electrode was a Pt spiral wire and the working electrode was
735
736
N D Sang et al
a Mo/soda-lime glass substrate with an area of 1·5 cm2 .
Mo layer was deposited by d.c. sputtering with a thickness of 1 μm and resistivity of 15 μ cm. The electrolyte
bath contained 120 ml deionized water, 20 mM CuCl2 ,
30 mM InCl3 , 40 mM Ga(NO3 )3 , 20 mM H2 SeO3 and
350 mM LiCl. A combination of 25 mM potassium hydrogen phthalate (KHP) and 20 mM H3 SNO3 (sulphamic acids)
was used as a complexing agent. In our previous study
(not published yet), we have found that this concentration
of complexing agent was the best choice. pH of the solution was adjusted to 2·0 by adding drops of concentrated
hydrochloric acid. CV was carried out in the range of potentials from −1·2 to 0·0 V vs Ag/AgCl at a scan rate of
20 mV/s. The first scan was in negative direction. EDs were
processed at the potentials ranging from −0·3 to −1·1 V
vs Ag/AgCl for 20 min. The annealing process was carried out in Ar at 550 ◦ C for 60 min. Concentration of the
films grown by ED was determined by energy dispersive
spectroscopy (EDS), surface morphology was examined by
scanning electron microscope (SEM) and crystallinity was
examined by X-ray diffraction (XRD).
3.
Results and discussion
3.1 Voltammogram of unitary Cu, Ga, In and Se systems
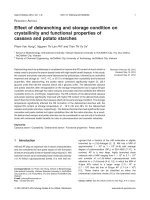
Figure 1(a) shows voltammogram of the base solution which
contains only water, LiCl, KHP and H3 SNO3 . As seen in
the figure, within the scan range, there is no reduction
peak. It means that any reduction process does not take
place in this solution. At high negative potential, the current
decreases rapidly when hydrogen reduction starts occurring.
Figure 1(b) presents the voltammogram of 20 mM CuCl2 in
the solution. In this voltammogram, we can see one weak
peak at about 0·15 V, one peak at about −0·4 V and one peak
at −0·9 V vs Ag/AgCl. We suggest that the peak at 0·15 V
relates to the process:
Cu2+ + 2Cl− + e− ↔ CuCl−
2.
(1)
Our suggestion is in agreement with the proposal by
Abrantes et al (1995).
The peak at −0·4 V may be assigned to the process:
Cu2+ + 2e− ↔ Cu0 .
(2)
Although it is well known that Cu deposition is a reversible
process, we do not observe an oxidation peak corresponding
to this reduction peak. This feature can be explained by the
formation of complexation between sulphamate anions and
cuprous cations. The peak at −0·9 V should be assigned to
the H+ reduction to H2 process. All our attributions of the
peaks in voltammogram of Cu unitary system are in very
good agreement with those reported by Liu et al (2011) and
Lai et al (2009).
Figure 1(c) presents voltammogram of the solution containing 30 mM InCl3 . In this figure, the reduction of In3+
Figure 1. Voltammograms of (a) base solution containing water,
LiCl, KHP and H3 SNO3 ; (b) solution containing 20 mM CuCl2 ;
(c) solution containing 30 mM InCl3 ; (d) solution containing
40 mM Ga(NO3 )3 and (e) solution containing 20 mM H2 SeO3 .
to In reaches a maximum at −0·8 V. The voltammogram
of the solution containing 40 mM Ga(NO3 )3 is shown in
figure 1(d). Similar to the In system, the peak at −0·9 V
can be attributed to the reduction of Ga3+ to Ga. We can see
that although the concentration of the Ga(NO3 )3 is 40 mM,
Morphology of CIGS thin film
737
higher than those of other constituents, the current density is
rather low. It again indicates that among four elements Ga
has the most negative reduction potential and therefore, is
the most difficult element to deposit. The voltammogram of
H2 SeO3 presented in figure 1(e) shows two strong peaks, one
at −0·3 V and the other at −0·9 V vs Ag/AgCl. The first
peak is likely related to the reduction of H2 SeO3 directly to
Se, following the equation:
H2 SeO3 + 4H+ + 4e− ↔ Se + 3H2 O.
(3)
We suggest the second peak corresponding to the complex
process described by the equations:
H2 SeO3 + 6H+ + 6e− ↔ H2 Se + 3H2 O,
(4)
H2 SeO3 + 2H2 Se + 6e− ↔ Se + 3H2 O.
(5)
This suggestion is similar to those reported by Massaccesi
et al (1996) and Mishra and Rajeshwar (1989).
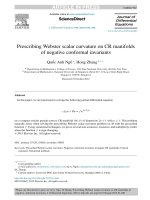
3.2 Voltammogram of binary Cu–Se, Ga–Se and In–Se
Figure 2(a) illustrates voltammogram of the electrolyte solution containing 20 mM CuCl2 and 20 mM H2 SeO3 . The
peak at −0·9 V is still assigned to the reduction processes of
H2 SeO3 which have been described in the preceding section.
There are some differences between this voltammogram and
those of unitary Cu and Se systems. The first notable difference is the appearance of the second peak at −0·7 V. This
peak may still relate to the processes described by (4) and (5),
i.e., these processes occur at a more positive potential. Liu
et al (2011) has also observed this behaviour and attributed
it to the reduction of Se to H2 Se, according to the equation:
Se + 2H+ + 2e− ↔ H2 Se.
(6)
In their report, the significant positive shift from −0·9 to
−0·65 V of this reduction peak has been explained by the
release of formation free energy from the reaction:
Se + Cu2+ ↔ CuSe + 2H+ .
(7)
Another notable difference is the positive shift of either the
peak described by (2) or the one described by (3) from their
former position where Cu2+ or Se4+ alone is reduced to the
position of −0·1 V. According to Thouin et al (1993) the
origin of this phenomenon can be attributed to the formation
of a Cu–Se phase, for example:
2Cu+ + H2 SeO3 + 4H+ + 6e− ↔ Cu2 Se + 3H2 O,
(8)
Cu2+ + H2 SeO3 + 4H+ + 6e− ↔ CuSe + 3H2 O.
(9)
Figure 2(b) shows voltammogram of solution containing 30 mM InCl3 and 20 mM H2 SeO3 . By comparing this
voltammogram with those of unitary In and Se systems, we
can attribute the first peak at −0·3 V to the reduction of
Figure 2. Voltammograms of (a) solution containing 20 mM
CuCl2 and 20 mM H2 SeO3 ; (b) solution containing 30 mM InCl3
and 20 mM H2 SeO3 and (c) solution containing 40 mM Ga(NO3 )3
and 20 mM H2 SeO3 .
H2 SeO3 directly to Se and the second peak at −0·8 V to the
reduction of In3+ to In. Besides that, we can observe one peak
at −0·57 V which may relate to an underpotential deposition
of indium as indium selenides. This process can be described
by the equation:
3Se + 2In3+ + 6e− ↔ In2 Se3 .
(10)
For the case of voltammogram of binary Ga–Se system, we
only see one peak at −0·3 V which corresponds to the reduction of H2 SeO3 directly to Se and one peak at −0·95 V which
corresponds to the reduction of Ga3+ to Ga. It means that the
underpotential deposition of gallium as gallium selenides do
not occur in this system. Furthermore, the presence of Ga3+
in the solution has inhibited the complex process described
by (4) and (5).
738
N D Sang et al
3.3 Voltammogram of quaternary Cu–In–Ga–Se
Figure 3 is the voltammogram for solution containing 20 mM
CuCl2 , 40 mM Ga(NO3 )3 , 30 mM InCl3 and 20 mM H2 SeO3 .
Again, we can observe a peak at −0·1 V which should be
assigned to the formation of a Cu–Se phase as described
above. We can also see a weak peak at −0·9 V which should
correspond to the reduction of Ga3+ to Ga and/or the complex reduction of H2 SeO3 . The most notable feature in this
voltammogram is a strong peak at −0·5 V. This peak may
relate to one of the underpotential depositions described by
(6) or (10). It is not easy to distinguish well which process this peak corresponds to. In order to elucidate this
problem, further studies are needed. However, we can say
that the underpotential deposition mechanism of Cu–Se and
In–Se phases has occurred. This voltammogram also reveals
that deposition of Ga still needs a highly negative potential.
3.4 Potential dependence of composition
EDS composition of the CIGS films deposited at various
potentials is listed in table 1. Generally, the potential dependence of the composition is in accordance with the CV
results. First of all, the concentration of Cu increases as the
deposition potential decreases to −0·5 V, then decreases as
the deposition potential decreases continuously. The maximum value of Cu concentration at −0·5 V should associate
to the reduction process of Cu2+ to Cu0 at −0·4 V (2) as
well as to the low concentration of In and Ga in the samples
deposited at potentials less negative than −0·5 V.
Concerning the Ga concentration, we can see that it has
very low value in the samples deposited at the negative
potential above −0·7 V, then rises rapidly as the potential
decreases and reaches to a maximum value of 18·14% at the
potential of −1·0 V. This trend in variation of Ga concentration can be expected from the CV data which show the
reduction of Ga at −0·9 V. In the case of In, the insertion of
In can be achieved at −0·5 V, that is more positive than the
desired deposition potential for Ga. This feature may have
two reasons, the reduction potential of In3+ to In is more positive than that for the reduction of Ga3+ to Ga and the underpotential deposition of indium as indium selenides occurs in
the co-electrodeposition of In and Se.
Se concentration is high in all samples and depends mainly
on the concentration of the other constituents. This result
reveals that the deposition of Se can take place at the whole
range of the investigated potential. We can expect this phenomenon from the facts that Se has two wide reduction peaks
and the ability to form an intermediate phase with other constituents by underpotential deposition mechanism. It is interesting to note that there is a range of potentials from −0·8
to −1·0 V where the concentration of all the constituents is
quite unaffected by the potential. This potential range is also
where we can obtain the highest concentration of In and Ga.
It means that this potential range is the best choice for obtaining films with desired and stable stoichiometry. Our observation about the suitable potential range is in agreement with
that reported by Lai et al (2009).
Since CIGS films deposited by electrodeposition generally
need an annealing process, evaluation of composition of the
films after annealing is necessary. Three samples deposited
at −0·8, −0·9 and −1·0 V were annealed in Ar at 550 ◦ C for
60 min. We chose these samples because we considered that
they were the best ones in terms of In and Ga concentrations.
EDS composition of these films are listed in table 2. We can
Table 1. EDS composition of CIGS films deposited at various
potentials.
Potential
(V vs Ag/AgCl)
−0·3
−0·4
−0·5
−0·6
−0·7
−0·8
−0·9
−1·0
−1·1
Atomic percent (%)
Cu
In
Ga
Se
Stoichiometry
23·9
25·7
27·0
22·7
19·8
18·2
18·0
17·5
17·0
03·3
04·6
10·2
16·5
19·5
23·7
22·4
22·1
21·8
01·9
02·0
02·3
02·9
06·0
08·7
13·4
14·1
13·2
70·9
67·7
60·5
57·9
54·7
49·4
46·2
46·3
48·0
CuIn0·14 Ga0·08 Se2·96
CuIn0·18 Ga0·08 Se2·63
CuIn0·37 Ga0·08 Se2·24
CuIn0·73 Ga0·13 Se2·56
CuIn0·98 Ga0·30 Se2·76
CuIn1·30 Ga0·47 Se2·70
CuIn1·24 Ga0·74 Se2·56
CuIn1·26 Ga0·80 Se2·64
CuIn1·28 Ga0·77 Se2·81
Table 2. EDS composition of post-annealed films deposited at
−0·8, −0·9 and −1·0 V from electrolyte bath containing 20 mM
CuCl2 , 30 mM InCl3 , 40 mM Ga(NO3 )3 and 20 mM H2 SeO3 .
Potential
(V vs Ag/AgCl)
Figure 3. Voltammogram of solution containing 20 mM CuCl2 ,
30 mM InCl3 , 40 mM Ga(NO3 )3 and 20 mM H2 SeO3 .
−0·8
−0·9
−1·0
Atomic percent (%)
Cu
In
Ga
19·5 25·2 09·5
19·4 23·6 13·8
18·7 23·5 14·3
Se
Stoichiometry
45·8
43·2
43·5
CuIn1·29 Ga0·48 Se2·35
CuIn1·22 Ga0·71 Se2·23
CuIn1·25 Ga0·76 Se2·32
Morphology of CIGS thin film
see that the most significant difference between the composition of these films and those of as-deposited films is
the decrease in Se content. This difference is due to the
higher evaporation rate of Se compared to those of Cu, In
and Ga.
Table 3. EDS composition of post-annealed films deposited at
−0·8, −0·9 and −1·0 V from electrolyte bath containing 20 mM
CuCl2 , 20 mM InCl3 , 30 mM Ga(NO3 )3 and 20 mM H2 SeO3 .
Potential
(V vs Ag/AgCl)
−0·8
−0·9
−1·0
739
On noting that the main deviation of the composition of these films from the desired stoichiometry of
Cu(In0·7 Ga0·3 )Se2 was the high concentration of In and Ga,
and we deposited the other three films, also at the potentials
of −0·8, −0·9 and −1·0 V, but from a new electrolyte bath
and which contained 20 mM CuCl2 , 20 mM InCl3 , 30 mM
Ga(NO3 )3 and 20 mM H2 SeO3 . The films were also annealed
in Ar at 550 ◦ C for 60 min. EDS composition of these
films after annealing are listed in table 3, showing clearly an
improvement in matching the desired stoichiometry.
Atomic percent (%)
Cu
In
Ga
25·5 17·7 6·2
24·8 16·9 9·6
24·2 15·6 10·5
Se
Stoichiometry
50·6
48·7
49·7
CuIn0·69 Ga0·24 Se1·98
CuIn0·68 Ga0·38 Se1·96
CuIn0·64 Ga0·43 Se2·05
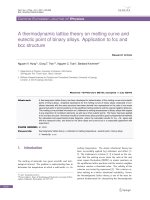
3.5 Morphology and crystallinity
Figure 4 is the cross-sectional and surface morphology
(SEM) of typical as-deposited samples, namely, the ones
deposited at −0·3, −0·6 and −0·9 V. As seen, these
Figure 4. Cross-sectional and surface morphology (SEM) of typical as-deposited
samples deposited at (a, a ) −0·3 V, (b, b ) −0·6 V and (c, c ) −0·9 V vs Ag/AgCl.
740
N D Sang et al
films have poor crystallinity with porous, non-uniform and
polyphasic structure. However, these micrographs also indicate that the samples deposited at less negative potential
are more dense and compact. This is because these samples
consist mainly of the phases containing Cu and Se.
The effect of annealing process on the morphology and
crystallinity of the samples can be seen in figure 5. We can
see clearly that these films are more dense and compact.
The most significant difference between the as-deposited
and the post-annealed films is the change in the shape of
the grains, i.e. from cauliflower-like to flake-like. This is a
clear evidence of crystallization occurring during annealing
process.
Evolution of morphology and crystallinity under the variation of applied potential and the annealing process can
be seen more from the XRD results which are shown in
figure 6. In all cases of as-deposited samples, XRD patterns exhibit a nanocrystalline and/or amorphous structure.
For that reason, we show only one pattern of a typical
as-deposited sample. XRD patterns of the post-annealed
samples reveal that these films have a better crystalline
structure. Typical peaks of the chalcopyrite structure,
viz. (112), (220) and (312) start appearing in the XRD
pattern of the sample deposited at −0·5 V, the intensity of
these peaks increases with the change in applied potential
towards negative direction and then becomes strongly dominant in the XRD pattern of the film deposited at −0·9 V. In
the XRD pattern of this film (pattern d), we can also see some
very weak peaks. However, these peaks can still be identified as the peaks of chalcopyrite structure and are indexed
Figure 5. Cross-sectional and surface morphology (SEM) of samples deposited at
(a, a ) −0·3 V, (b, b ) −0·6 V and (c, c ) −0·9 V vs Ag/AgCl, followed by annealing
process at 550 ◦ C for 60 min.
Morphology of CIGS thin film
741
and stable stoichiometry. Further studies are still needed for
better understanding of CIGS layer deposition as well as for
improvement in the sample morphology.
Acknowledgement
This work was supported by project NAFOSTED
103.02.59.09.
References
Figure 6. XRD patterns of typical CIGS films with plane indices
corresponding to chalcopyrite structure: (a) as-deposited, postannealed films grown at (b) −0·3 V, (c) −0·5 V and (d) −0·9 V vs
Ag/AgCl.
in figure 6. XRD patterns of the films deposited at −0·3 and
−0·5 V (patterns b and c) contain an additional peak at 31◦ ,
which belongs to MoSe2 structure. MoSe2 phase was formed
in these films during annealing process due to the exceeding
concentration of Se.
4.
Conclusions
In this study, we have studied the deposition mechanism of
the CIGS layer by using the cyclic voltammetry technique.
We have also studied the dependence of composition on the
deposition potential. Variation of concentration of each constituent was found to be in good agreement with CV data.
The underpotential deposition mechanism of Cu–Se and
In–Se phases was observed in voltammograms of binary
and quaternary systems. A suitable potential range from
−0·8 to −1·0 V and an appropriate concentration of electrolyte bath were found for obtaining films with desired
Abrantes I M, Araujo L V and Veli D 1995 Miner. Eng. 8 1467
Bhatacharya R N, Batchelor W, Grannata J E, Hasoon H,
Wiensner H, Ramanathan K, Keane J and Noufi R N 1998 Sol.
Energy Mater. Sol. C. 55 83
Bhatacharya R N, Hiltner J F, Batchelor W, Contreras M A, Noufi
R N and Sites J R 2000 Thin Solid Films 361 396
Fernandez A M and Bhatacharya R N 2005 Thin Solid Films 474 10
Friedfeld R, Raffelle R D and Mantovani J G 1999 Sol. Energy
Mater. C. 58 375
Ganchev M, Kois J, Kaelin M, Bereznev S, Tzvetkova E,
Volubuzeva O, Stratieva N and Tiwari A 2006 Thin Solid Films
511–512 325
Hermann A M, Wesfall R and Wind R 1998 Sol. Energy Mater. C.
52 355
Kampmann A, Sittinger V, Rechid J and Reineke-Koch R 2000 Thin
Solid Films 361–362 309
Kampmann A, Rechid J, Raitzig A, Wulff S, Mihhalova M, Thyen R
and Kaberlah K 2003 Mater. Res. Soc. Symp. Proc. 763 323
Kang F, Ao J, Sun G, He Q and Sun Y 2010 Curr. Appl. Phys. 10 886
Lai Y, Liu F, Zhang Z, Liu J, Li Y, Kuang S, Li J and Liu Y 2009
Electrochim. Acta 54 3004
Liu J, Liu F, Lai Y, Zhang Z, Li J and Liu Y 2011 J. Electroanal.
Chem. 651 191
Massaccesi S, Sanchez S and Vedel J 1996 J. Electroanal. Chem.
412 95
Mishra K K and Rajeshwar K 1989 Electroanal. Chem. 271 279
Repinst L, Contreras M A, Egaas B, Hart C De, Scharf J, Perkins
C L, To B and Noufi R 2008 Prog. Photovolt. Res. Appl. 16 235
Thouin L, Rouquette-Sanchez S and Vedel J 1993 Electrochim. Acta
38 2387
Zank J, Mehlin M and Fritz H P 1996 Thin Solid Films 286 259
Zhang L, Jiang F D and Feng J Y 2003 Sol. Energy Mater. C. 80 483