DSpace at VNU: Amorphous iron-chromium oxide nanoparticles prepared by sonochemistry
Bạn đang xem bản rút gọn của tài liệu. Xem và tải ngay bản đầy đủ của tài liệu tại đây (1.69 MB, 7 trang )
Journal of Non-Crystalline Solids 358 (2012) 537–543
Contents lists available at SciVerse ScienceDirect
Journal of Non-Crystalline Solids
journal homepage: www.elsevier.com/ locate/ jnoncrysol
Amorphous iron-chromium oxide nanoparticles prepared by sonochemistry
Nguyen Dang Phu a, Trinh Xuan Sy a, Hoang Thanh Cao a, Nguyen Ngoc Dinh a, Le Van Thien b,
Nguyen Minh Hieu a, Nguyen Hoang Nam a, Nguyen Hoang Hai a,⁎
a
b
Center for Materials Science, Faculty of Physics, VNU University of Science, 334 Nguyen Trai, Thanh Xuan, Hanoi, Vietnam
Faculty of Environmental Science, VNU University of Science, 334 Nguyen Trai, Thanh Xuan, Hanoi, Vietnam
a r t i c l e
i n f o
Article history:
Received 1 August 2011
Received in revised form 24 October 2011
Available online 22 November 2011
Keywords:
Crystallization process;
Amorphous iron oxide;
Sonochemistry;
Phase transition;
Magnetic property
a b s t r a c t
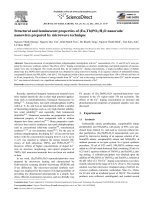
Amorphous Fe2O3 and Fe1.9Cr0.1O3 materials have been prepared by sonochemical method. X-ray diffraction
patterns, transmission electron microscopy, Raman and infrared spectra, differential scanning calorimetry,
Mössbauer and magnetic measurements revealed many interesting behaviors of the samples. Reaction to
form the materials only occurred at the preparation temperatures of 70 °C or above. Upon heating, the
sample prepared at 70°C presented a strong ferromagnetic behavior due to the presence of the magnetite
phase coexisting with the hematite phase whereas the samples prepared at higher temperatures presented
only the existence of the hematite phase. Thermal analyses of the sample prepared at 80°C revealed three
exothermic peaks which were corresponding to the phase changes of dehydroxylation, crystallization of
the maghemite phase and maghemite–hematite transition, respectively. The activation energies of the
phase changes deduced from the thermal analyses showed that the presence of Cr enhanced the activation
energy which can slow down the ageing effect of the amorphous state when being used in practice.
© 2011 Elsevier B.V. All rights reserved.
1. Introduction
Amorphous metal oxides show great potentials in solar energy
transformation [1,2], electronics [3], electrochemistry [4], manufacture of magnetic storage media, adsorption and purification processes
and catalysis [5,6]. Among those oxides, iron oxide nanoparticles play
an important role due to its excellent catalytic activity and high
specific surface area. Iron oxide nanoparticles in the amorphous
state are more interesting than in the crystalline state when being
used as a catalyst due to the dangling bonds and high surface area
[6]. They have been used for hydrogen peroxide oxidation of ferulic
acid in water [7], As(V) and Cr(VI) removal [8]; as a catalyst for
oxidation of cyclohexane [5,6], photoelectrode and photocatalyst for
splitting water into H2 and O2 [9]; for magneto-optical sensors and
magnetic devices [10], humidity sensors [11].
Amorphous iron oxide nanoparticles have been prepared by electrochemical synthesis [12], microwave heating [13], sonochemistry
[14] because these methods provide a high cooling rate to form
amorphous state. The most common way to obtain amorphous iron
oxide nanoparticles is sonochemical technique. The cooling rate of
this technique can be more than ten million degrees per second
[15]. Sonochemical routes lead to iron oxides rely on Fe(CO)5
[16,17], FeCl3 [18], Fe(NO3)3 [19], Fe(OAc)2 [20], Fe(OEt)3 [21] as
precursors.
⁎ Corresponding author. Tel: + 84 4 3558 2216; fax: + 84 4 3858 9496.
E-mail address: (N.H. Hai).
0022-3093/$ – see front matter © 2011 Elsevier B.V. All rights reserved.
doi:10.1016/j.jnoncrysol.2011.10.035
The crystalline iron (III) oxides can commonly be maghemite
(γ-Fe2O3) or hematite (α-Fe2O3). The maghemite is ferrimagnetic
with the saturation magnetization of about 60 emu/g. The hematite
is antiferromagnetic with the Néel temperature of 680°C. At room
temperature nano-hematite sometimes behaves like a weak ferromagnet with low saturation magnetization of few emu/g [22] or
sometimes high saturation magnetization [23]. Origin of the ferromagnetic property of the hematite was ascribed to a large number of
point defects, or disorders in the materials. The hematite possesses
a corundum-type structure with the space group of R3c [23]. A transition from the maghemite to the hematite phase (γ − α transition)
occurred at 400°C in iron oxide nanoparticles prepared by gas evaporation method. For iron oxide nanoparticles prepared by wet chemical
method, the temperature at which the γ − α transition happened varied in the range of 300 – 500°C depending on the preparation method.
Origin of the temperature difference is yet unsolved [24]. Iron oxide
can be in another ferrimagnetic form called magnetite Fe3O4with the
saturation magnetization of 80 emu/g [25].
Amorphous iron oxide, a metastable material, does not have the
long-range order characteristic of a crystal. It has some short-range
order at atomic length scale due the nature of chemical bonding.
Under certain conditions, the amorphous state can be changed to the
crystalline states in a so-called crystallization process through which
the physical and chemical properties of the materials change. The
crystallization process occurs at all temperatures with different
rates. The crystallization temperature is actually the temperature at
which the rate of the crystallization process is highest. Below the crystallization temperature, the rate is much slower which is normally
N.D. Phu et al. / Journal of Non-Crystalline Solids 358 (2012) 537–543
ignored in experiments. However, for applications of amorphous iron
oxide materials, we have to study the changes in physical and chemical properties with time, namely the ageing effect. There are few articles reporting on the crystallization process of the iron oxides at the
temperature of about 300°C [13] but the effects of the crystallization
process on the morphological, chemical and physical properties
were not well studied. Especially no article reported on how to slow
down the ageing process when the materials are used in applications.
Crystallization and phase transition processes are solid state reactions. The most used model to understand solid state reaction is the
nth order model [26] which supposes that the degree of reaction α
is determined from:
dα
n
¼ K ð1−α Þ
dt
ð1Þ
with t is the time and n is the order of reaction. The rate constant K
is given by the Boltzmann–Arrhenius equation: K = K0exp{− Ea/RT},
where Ea is the activation energy for the reaction, which describes
the overall reaction process, R is the gas constant, T is the temperature, and K0 is the frequency factor or the pre-exponential factor.
Kissinger proposed a method to calculate the kinetics parameters of
the reaction [27] by using the data obtained from differential scanning
calorimetry (DSC). He assumed that the reaction rate dα/dt reaches
maximum at the reaction temperature (Tp) where DSC curve displays
a peak. By solving the equation d 2α/dt 2 = 0 at T = Tp, the Kissinger
equation is presented by:
ln
β
E
K R
¼ − a þ ln 0
Ea
RT p
T 2p
ð2Þ
where β is the heating rate (°C/min or K/min). By plotting the experimental data ln(β/Tp2) as a function of (− 1/Tp) and fitting to Eq. (2), the
kinetics parameters can be obtained. Among the kinetics parameters,
the activation energy is an important one. If value of Ea is low, the
reaction easily occurs and vice versa.
This article presents the study on the ageing effect of amorphous
iron oxide nanoparticles prepared by sonochemical technique and
find a way to improve the stability of the amorphous state by introducing chromium. The results showed that the presence of chromium
increases the activation energy of the material.
2. Experimental
In principle, sonochemical experiments applied in this article are
similar to other reports [14] but the reaction solution is different. Typically, 80 ml solution in a 150 ml vessel containing 0.01 M ferric chloride FeCl3.6H2O (Guangdong chemical, China), 1 wt.% polyethylene
glycol 2000 (Merk), 1 M urea (Xilong chemical, China) was ultrasonicated by using a ultrasound emitter (Sonics VCX 750) with a power of
400 W, a frequency of 20 kHz for 4 h Cr(NO3)3.9H2O (Guangdong
chemical, China) was added to the solution in order to have Fe2O3
(iron oxide sample) and Fe1.9Cr0.1O3 (iron-chromium oxide sample).
Temperature of the system was adjusted in the temperature range
from 70 to 90 °C. After cooling to room temperature, amorphous
materials were collected by using a centrifuge (Hettich Universal
320, 1160 rcf for 20 min), washed five times with distilled water
and air-dried at 75 °C. The samples were annealed in a muffle furnace
in air at temperature range from 200 to 600 °C for 30 min. The structure of the nanoparticles was analyzed by using a Bruker D5005 X-ray
diffractometer (XRD). The morphology of the materials was examined by a JEM-1200 EX transmission electron microscope (TEM)
working at an accelerating voltage of 80 kV. The chemical composition was determined by using an energy dispersion spectroscopy
(EDS) in a JEOL 5410 LV scanning electron microscope. Magnetic
measurements were conducted by using a DMS-880 sample vibrating
magnetometer (VSM) with a maximum magnetic field of 13.5 kOe.
The thermal behavior was examined by a STD 2960 TA Instruments
differential scanning calorimetry (DSC) over the temperature range
of 25–600 °C with different heating rates of 10–30 °C/min in air.
Raman spectra were conducted by a Renishaw InVia Micro Raman
at room temperature. The samples were excited using the 632.8 nm
line from a He–Ne laser with a power level of about 1 mW. Fourier
transformed infrared (FTIR) spectra were recorded in the transmission mode on a Nicolet Impact 410 spectrometer. Mössbauer spectra
were measured at room temperature in the standard transmission
geometry, using a traditional constant acceleration signal spectrometer with a 57Co:Rh as the source. Hyperfine interaction parameters
of the as-prepared and annealed samples were derived from the
Mössbauer spectra using a least-squares fitting. Isomer shifts were
relative to α-Fe at room temperature.
3. Results
The XRD patterns of the iron oxide samples prepared at Te = 70, 80
and 90 °C before and after heating up to 600 °C in the magnetization
measurements (as presented in Fig. 4) are given in Fig. 1. The high
signals at low angles appeared in all curves are due to the amorphous
nature of the glass substrate supporting the materials in the XRD
measurements. All the as-prepared materials presented very similar
results with the absence of diffraction peaks, which shows the amorphous structure of the as-prepared iron oxide particles. Upon annealing, the crystallization processes occurred. Only the hematite phase
(α-Fe2O3: JCPDS # 73-2234) was formed in the samples with
Te = 80 and 90 °C whereas the coexistence of the hematite and the
magnetite (Fe3O4: JCPDS # 79-0418) phases presented in the samples
with Te = 70 °C. The XRD patterns of the iron oxide sample prepared
at 80 °C before and after annealing at Ta = 220 – 600 °C are given in
Fig. 2. Increasing Ta from 220 to 400 °C, the crystallization process
developed gradually which was presented by the weak and broad diffraction peaks at 33.2, 35.6 and 62.5° assigned to either the α-Fe2O3 or
γ-Fe2O3 structures. At higher annealing temperatures of 500 and
600 °C, only the peaks of the hematite phase appeared and increased
with increasing Ta.
TEM images of the iron oxide sample prepared at 80 °C are given
in Fig. 3. Particle size increased from 5 nm for the as-prepared sample
(Fig. 3(a)) to 22 nm for the sample annealed at 600 °C for 15 min
(Fig. 3(b)), which was due to the particle growth and agglomeration
process. A similar phenomenon was observed for the samples prepared at 70 and 90 °C.
Hematite
Magnetite
Intensity (a.u.)
538
90 oC
80 oC
70 oC
As-prepared
20
30
40
50
60
70
2θ (o)
Fig. 1. XRD patterns of the iron oxide samples prepared at 70, 80 and 90 °C before
(as-prepared) and after heating to 600 °C in the magnetization measurement as presented in Fig. 4. Most of the diffraction peaks are assigned to the hematite Fe2O3 phase
(JCPDS # 73-2234). Some peaks of the sample with Te = 70 °C may be assigned to the
magnetite Fe3O4 phase (JCPDS # 79-0418).
N.D. Phu et al. / Journal of Non-Crystalline Solids 358 (2012) 537–543
Hematite (73-2234)
Maghemite (39-1346)
539
a)
600oC
Intensity (a.u.)
500oC
400oC
350oC
300oC
270oC
220oC
as-prepared
20
40
60
2θ (o)
60 nm
Fig. 2. XRD patterns of the sample prepared at 80 °C before and after annealing at
200–600 °C compared with the powder diffraction file of hematite (JCPDS # 732234) and maghemite (JCPDS # 39-1346).
Fig. 4 presents the temperature dependence of the magnetization
under a magnetic field of 200 Oe for the iron oxide samples with
Te = 70, 80 and 90 °C. All heating curves started with nonferromagnetic state of the amorphous nature of the unannealed
materials. At temperatures higher than 300 °C, the magnetization
curves showed a strong enhancement which suggests that the crystallization process of a ferromagnetic phase occurred in the materials
at those temperatures.
The heating curve of the sample with Te = 70 °C was higher,
broader and more complicated than that of the two other samples
with Te = 80 and 90 °C. There are two magnetic enhancements, the
first one (strong) at 305 °C and the second one (weak) at 380 °C
(Fig. 4(a)). The highest magnetization on the heating curve was
9 emu/g. At the temperatures of 600 °C and higher, the magnetization was almost zero due to the domination of thermal agitation
over the magnetic exchange interaction appeared between the magnetic moments of Fe ions. The cooling curve started at 600 °C back
to room temperature was a gradual and monotonic function as temperature and got a maximal value of 18 emu/g at room temperature.
The heating and cooling curves of the amorphous iron oxide material
prepared at 70 °C were similar to that of a typical ferromagnetic
material [28]. The ferromagnetic property in this sample was supported by the fact that the magnetic field dependence of the magnetization at room temperature of the sample after cooling was
hysteresis with the coercive field of 170 Oe and the saturation magnetization of 26 emu/g (Fig. 5).
The samples with Te = 80 and 90 °C presented heating curves
with a single magnetic enhancement at about 370–380 °C (close to
the second enhancement of the sample with Te = 70 °C which may
be assigned to the formation of the maghemite phase) as shown in
Fig. 4(a), (b). The highest value of the magnetization in the heating
curve was about 1 emu/g, much lower than the value of the sample
with Te = 70 °C. Moreover, the shape and value of the magnetization
on the cooling curve of those samples revealed a non-ferromagnetic
property.
The room temperature Mössbauer spectra of the as-prepared and
annealed samples with Te = 80 °C are shown in Fig. 6. It can be seen
that the spectrum of the as-prepared sample shows one doublet with
Isomer shift of 0.35 mm/s and quadrupole splitting of 0.66 mm/s.
These values are quite similar to those reported for amorphous iron
oxide materials [29], which are attributed to Fe 3 + in the high-spin
state. This implies that the as-prepared sample was paramagnetic. Spectrum of the sample annealed at 600 °C is different with the presence of
one sextet. The fitting gave the hyperfine field of 512.6 kOe, Isomer shift
of 0.34 mm/s relative to α-Fe. These parameters are in good agreement
with those reported in the literatures for the hematite phase [6,30]. The
b)
60 nm
c)
Fig. 3. TEM images of the as-prepared (a) and annealed at 600 °C (b) iron oxide
nanoparticles with Te = 80 °C and fitting the particle size distribution to the Gaussian
function (c).
contribution of doublet is only 2%. From these values, it is clear that the
annealed samples mainly consist of α-Fe2O3 hematite phase with antiferromagnetic order.
Fig. 7 presents the FTIR spectra of the iron oxide sample before and
after annealing at 220–600 °C. All curves show a broad absorption
band at around 3400 cm − 1 which was due to the H–OH stretch.
The intensity of this band reduced with increasing Ta. Two adsorption
bands which can be assigned to the hematite phase located at 450
and 540 cm − 1 [31] are clearly appeared in the sample annealed at
500 and 600 °C. This is another evidence for the presence of the
hematite phase in the samples annealed at high temperatures. The
presence of a band at 690 cm − 1 which disappeared in the sample
annealed at 600 °C was assigned to tetrahedral defects [32].
Raman spectra of the iron oxide samples with Te = 70, 80, 90 °C
after annealing at 600 °C are shown in Fig. 8. For the samples with
540
N.D. Phu et al. / Journal of Non-Crystalline Solids 358 (2012) 537–543
20
a)
a)
Cooling
Heating
380 oC
0
0.5
Relative absorption (a.u.)
Magnetization (emu/g)
10
o
305 C
b)
Heating
Cooling
0.0
2
c)
1
Heating
b)
Cooling
0
-12
100
200
300
400
500
-8
-4
600
T (oC)
Fig. 4. Temperature dependence of the magnetization under the applied magnetic field
of 200 Oe of the iron oxide nanoparticles with the preparation temperature of 70 (a),
80 (b) and 90 °C (c).
Te = 80 and 90 °C, most of the peaks can be assigned to the hematite
phase [33]: A1g (225, 494 cm − 1), Eg (244, 290, 297, 409, 612 cm − 1)
and second harmonic vibration (1320 cm − 1). The peak at 660 cm − 1
which was very weak and sometimes ignored in other Ref. [33–35]
is strong in this study. Some works [36,37] attributed this peak
to the disorder-induced breaking of the symmetry properties of the
Eu(LO) phonon which may be caused by the defects in the materials.
The disorders may come from a strong resonance on the surface of
the nanoparticles, and the structural defects [38] formed due to the
fast cooling in the preparation process. It can be seen that, the
Raman spectra of the sample with Te = 70 °C shows a broad scattering
band at 685 cm − 1 (instead of two distinguished bands at 610 and 660
cm − 1), indicating the formation of the magnetite phase [39]. The
presence of a peak located at 1590 cm − 1 is unknown to us and
never reported in literature. Raman spectra of the iron oxide samples
with Te = 80 °C after annealing at 220–600 °C are shown in Fig. 9.
When Ta ≤ 270 °C, the Raman spectra are similar to that of the unannealed sample with a broad scattering band located at 650–
750 cm − 1. This band can be ascribed to the Fe–O symmetric stretch
which presented in the amorphous state of the samples. This band
appeared in many types of crystalline iron oxides such as goethite,
magnetite, maghemite but not hematite phase [40,41,39]. At higher
annealing temperatures of 300 and 400 °C, beside that broad scattering band, there were vague bands which are ascribed to the hematite
30
0
4
8
12
Velocity (mm/s)
Fig. 6. Room temperature Mössbauer spectra of the as-prepared (a) and annealed at
600 °C (b) samples with Te = 80 °C.
phase. The intensity of these bands increased with increasing annealing time. At Ta = 500, 600 °C the peak at 650 – 750 cm − 1 (assigned
for the Fe–O symmetric stretch appeared in the amorphous state)
completely disappeared and there were only the peaks presented
for the hematite phase: A1g (225, 494 cm − 1), Eg (244, 290, 297,
409, 612 cm − 1) and second harmonic vibration (1320 cm − 1).
DSC results of the iron oxide nanoparticles prepared at 80 °C with
the heating rate of 10 – 30 °C/min are given in Fig. 10. A part from an
endothermic peak in the temperature range from 25 to 180 °C due to
the evaporation of moieties in the samples (not shown), there are
three obvious exothermic peaks located at around Tp1 = 215,
Tp2 = 265 and Tp3 = 505 °C corresponding to the heating rate
β = 10 °C/min. All peaks have a tendency of shifting to higher temperatures as increasing the heating rate. According to Eq. (2), the
activation energies of 105, 130 and 186 kJ/mol for the solid state reactions corresponding to the three exothermic peaks Tp1, Tp2 and Tp3
were respectively deduced by fitting to the experimental DSC data
(Table 1).
Chromium ions have been used to replace iron ions in its lattice
positions as their ionic radii are of same order [44]. In addition, the
structure of chromium oxide and the hematite phase of iron oxide
are rhombohedral [45] and they are both antiferromagnetic insulator
[46]. We study effects of the presence of Cr on the crystallization process. Concentration of Cr 3 + was adjusted to have Fe1.9Cr0.1O3. The
experimental concentration of Cr in the as-prepared iron-chromium
oxide sample obtained from EDS was 0.098 which was very close to
the expected value of 0.1. The lattice parameters (a = 5.045 Å and
30
20
10
10
690
540
o
-10
450
o
-20
0
g) 600 C
f) 500 C
e) 400 C
o
0
-30
-1000
-500
0
500
Absorption (a.u.)
Magnetization (emu/g)
20
1000
-10
-20
d) 300
c) 270
b) 220
o
o
C
C
o
C
a) As-prepared
-30
-1000
-5000
0
5000
3400
10000
H (Oe)
Fig. 5. Magnetic field dependence of the magnetization at room temperature of the
sample with Te = 70 °C after heating–cooling magnetization measurement as showed
in Fig. 4(a). The hysteresis loop presented a ferromagnetic property of the material.
The inset is a zoom-in of the main figure.
4000
3600
3200
2800
1000
500
Wavenumber (cm-1)
Fig. 7. FTIR spectra of the iron oxide samples with Te = 80 °C before and after annealing
at 220–600 ?°C.
Eg(3)
541
233
285
230
281
528
Exothermic (mV)
90 oC
80 oC
70 oC
900
276
272
1590
1200
1500
25 C/min
o
20 C/min
514
15 oC/min
505
215
600
o
522
225
221
300
30 oC/min
2Eu
Eg(5)
Eu
533
Eg(4)
A1g(2)
A1g(1)
Intensity (a.u.)
Eg(1)
Eg(2)
N.D. Phu et al. / Journal of Non-Crystalline Solids 358 (2012) 537–543
200
1800
10 oC/min
265
300
400
500
T (oC)
Raman shift (cm-1)
Fig. 8. Raman spectra of the iron oxide samples prepared at 70, 80 and 90 °C after heating
to 600 °C in the magnetization measurement as presented in Fig. 4.
Fig. 10. DSC data of the iron oxide sample prepared at Te = 80 °C with the heating rate
of 10–30 °C/min.
c = 13.069 Å) of the corundum-type structure of the hematite phase
in the iron oxide are almost the same as the values for the ironchromium oxide samples (a = 5.039 Å and c = 13.065 Å). DSC data
of the Fe1.9Cr0.1O3 sample with the heating rates of 10–30 K/min
(the same heating rates applied for the amorphous iron oxide
sample) are given in Table 2. All peaks have been shifted to higher
temperatures compared to those of the iron oxide sample. The activation energies relatively corresponding to Tp1, Tp2 and Tp3 are 140, 156,
170 kJ/mol.
Fig. 11 presents the time dependence of the magnetization of
Fe1.9Cr0.1O3 at several temperatures around Tp2 = 299 °C. All curves
show a strong increase in magnetization for a short period of time
after increasing the sample temperature. The trend was kept for the
samples at 365 °C and below whereas at 395 and 420 °C the magnetization got a maximal value and reduced after about 600 s.
hydrolysis urea, which was favorable for hydrolysis Fe(Cr) 3 + reaction. The temperature of the reaction solution is important for the
preparation process. Nanoparticles could only be obtained at the
experiment temperature Te of 70, 80 and 90 °C. Below 70 °C, the
reaction did not occur which may be explained by the formation of
the hydroxide polymers at high temperatures.
Ferromagnetic property is the result of the exchange interaction
appeared between magnetic moments aligned in crystalline structure
with long-ranged order. In the amorphous iron oxide materials, even
the magnetic moment of the Fe ions were present but the shortranged order did not provide the exchange interaction. So that there
was no ferromagnetic behavior appeared in the amorphous state at
low temperatures of the heating curves (Fig. 4).
For the sample with Te = 70 °C, we supposed that the amorphous
nanoparticles were undergone two crystallization processes, i.e., the
formation of the magnetite phase at 305 °C and the maghemite at
380 °C. Then the maghemite phase was changed to the hematite
phase at 530 °C. That explained the two enhancements in the heating
curve (Fig. 4(a)) and the presence of the magnetite phase in the XRD
data (Fig. 1). At room temperature, the hematite phase is antiferromagnetic or weakly ferromagnetic therefore the strong ferromagnetic
property of the sample was due to the magnetite phase (Fig. 5).
For the sample with Te = 80 and 90 °C, we supposed that the
amorphous nanoparticles were undergone one crystallization processes, i.e., the formation of the hematite at 380 °C (at which the formation of the maghemite occurred in the sample with Te = 70 °C).
Then the hematite phase was changed to the hematite phase at
530 °C. There was no presence of the magnetite phase in those
samples. The ferromagnetic property shown on the heating curve in
Fig. 4(b, c) was assigned to the maghemite phase. The XRD data
also presented only the existence of the maghemite and hematite diffractions (Fig. 2). Non-ferromagnetic property of the samples shown
4. Discussion
2Eu
Eu
Eg(5)
600 oC
Intensity (a.u.)
A1g(2)
Eg(4)
A1g(1)
Eg(1)
Eg(2)
Eg(3)
Formation of the amorphous nanoparticles in the preparation process may be explained in a similar way to form the amorphous iron
oxide nanoparticles prepared by microwave heating technique [13].
Hydrated Fe(Cr) 3 + can form complexes with water molecules
or OH − ions to form Fe(Cr)(H2O)x(OH - )y(3 − y) +. Polymer of this
hydroxide played a role of precursors for the oxide. The fast heating
of the ultrasonic waves stimulated nucleation of iron oxide. With
the simultaneous nucleation and homogeneous heating, uniformly
small particles could be synthesized. Polyethylene glycol, as a dispersion stabilizer, inhibited non-homogeneous precipitation to obtain
homogeneous precipitation. The pH of the solution was adjusted by
Table 1
Parameters related to the Kissinger plot (Eq. (2)) of the iron oxide sample, β (°C/min)
is the heating rate, Rc2 is the correlation coefficient. Errors in the table were from the
fitting to Eq. (2).
500 oC
400 oC
300 oC
270 oC
220 oC
As-prepared
200
400
600
800
1000
1200
1400
Wavenumber (cm-1)
Fig. 9. Raman spectra of the iron oxide samples with Te = 80 °C before and after
annealing at 220–600 °C.
Parameters
Tp1 (°C)
Tp2 (°C)
Tp3 (°C)
β = 10
β = 15
β = 20
β = 25
β = 30
ln KR
Ea
Rc2 (%)
3
Ea
R (× 10 )
Ea (kJ⋅ mol-1)
215
221
225
230
233
16.0 ± 1.2
99.1
12.7 ± 0.6
105 ± 6
265
272
276
281
285
18.7 ± 1.3
99.1
15.6 ± 0.7
130 ± 6
505
514
522
528
533
17.8 ± 2.0
98.0
22.4 ± 1.6
186 ± 13
542
N.D. Phu et al. / Journal of Non-Crystalline Solids 358 (2012) 537–543
10
Table 2
Parameters related to the Kissinger plot (Eq. (2)) of the Fe1.9Cr0.1O3 sample, β (°C/min)
is the heating rate, Rc2 is the correlation coefficient. Errors in the table were from the fitting to Eq. (2).
Tp1 (°C)
Tp2 (°C)
Tp3 (°C)
β = 10
β = 15
β = 20
β = 25
β = 30
ln KR
Ea
Rc2 (%)
3
Ea
R (× 10 )
Ea (kJ ⋅ mol-1)
241
245
251
253
257
23.5 ± 2.8
97.2
17.3 ± 1.5
140 ± 10
282
289
294
297
299
23.8 ± 1.9
98.9
18.9 ± 1.0
156 ± 8
542
551
559
563
577
14.2 ± 3.8
91.0
20.5 ± 3.1
170 ± 20
8
7
M (emu/g)
Parameters
9
305 oC
335 oC
365 oC
395 oC
420 oC
6
5
4
3
2
1
0
500
on the cooling curve (Fig. 4(b) and (c)) was due to the hematite
phase. The formation of the hematite phase was via the γ − α transition where the ferromagnetic maghemite was changed to the antiferromagnetic hematite phase at high temperatures (as shown in the
DSC data, Fig. 10).
The shifts of DSC peaks with heating rates of the sample with
Te = 80 °C (Fig. 10) were the result of the fact that the samples
have low thermal conductivity, therefore the temperature of the
material in the center of the samples lagged the temperature on the
surface. The value of the temperature lag increased with heating
rate and made the solid state reaction be shifted to higher temperatures. Moreover, the solid state reaction is related to the change in
molecular mobility, and this mobility has a small time-dependent or
kinetic contribution. Combining with the XRD data (Fig. 2) and the
magnetic measurements (Fig. 4), we supposed that the first peak is
related to the dehydroxylation of the materials [42,43], the second
exothermic peak is due to the crystallization process of the maghemite phase in the sample with Te = 80 °C . The maghemite possesses
a strong ferromagnetic property which led to the enhancement in
magnetization as shown in Fig. 4(b). The third exothermic peak is
corresponding to the transition from the maghemite to the hematite
phase (γ − α transition). The hematite is antiferromagnetic therefore
the magnetization of the cooling curve in Fig. 4(b) was low. Similar
argument can be used to explain the magnetic results of the sample
with Te = 90 °C. The dehydroxylation process occurred at Tp1 did
not affect strongly to the magnetic properties however the crystallization process of the maghemite phase at Tp2 enhanced the magnetization in the materials. In contrast, the γ − α transition reduced the
magnetization. We studied the dynamics of the magnetization as a
function of time (Fig. 11). The continuous increase in the magnetization at 305, 335 and 365 °C can be understood by the development of
the maghemite phase at temperatures higher than the crystallization
temperature Tp2. The reduction in the magnetization at 395 and
420 °C after 600 s can be explained by two processes: the development of the maghemite phase (enhancement in the magnetization)
and the γ − α transition (reduction in the magnetization). Even the
measuring temperatures of 395 and 420 °C were lower than the transition temperature Tp3 but the transition rates were much faster than
that at 305, 335 and 365 °C. After the formation of the maghemite
phase completed, the γ − α transition dominated, which caused a
reduction in the magnetization after long time.
For practical applications, the enhancement of Tp1 and the activation energy corresponding to Tp1 in the iron-chromium oxide compared to those of the iron oxide are important which leads to the
fact that the amorphous state of the materials is more stable at
room temperature. To estimate the life time of amorphous materials
under a certain temperature, we take integration of Eq. (1): ∫ (1 −
α) − ndα = ∫ K0exp{− Ea/RT}dt. The time for completing the reaction
t ∝ exp{Ea/RT}. The reaction occurs at all temperatures with different
rates. But at Tp1 the reaction rate is much faster than at room temperature Tr. If the time periods for completing the reaction at Tp1 and Tr
1000
1500
2000
t (s)
Fig. 11. Time dependence of the magnetization of the Fe1.9Cr0.1O3 with Te = 80 °C at
different temperatures.
respectively are tTp1 and tTr, supposing that the activation energy Ea
is the same at different temperatures, we obtain tTr/tTp1 ∝ exp{Ea/
RTr}/exp{Ea/RTp1}. Using the data for the iron oxide sample in
Table 1 (Tp1 ≈ 225 °C, Tr ≈ 27 °C, tTr/tTp1 ≈ 1.2 × 10 7, tTp1 is about few
seconds) we obtain tTr is about a year. Using data for the ironchromium oxide sample in Table 2, tTr can be up to 15 years. Therefore, the presence of Cr can slow down the ageing effect by a factor
of 15 times. This is a good way for using the amorphous ironchromium oxide materials in practice.
5. Conclusion
Amorphous iron-chromium oxide materials have been prepared
by sonochemistry. The crystallization and phase transition processes
revealed that the formation of the maghemite and hematite started
at 215 °C therefore the life time of the amorphous materials was limited under a year. Ageing effect of the amorphous iron oxide materials
can be slowed down by the presence of Cr. It is should be important
when using the materials for practical applications.
Acknowledgements
This work was financially supported by the National Foundation
of Science and Technology Development (NAFOSTED Grant No.
103.02.68.09) and the key project QGTD.10.29 of Vietnam National
University, Hanoi. Authors would like to thank Prof. O. M. Lemine of
Imam University and Prof. M. Sieddine of Universite Sultan Moulay
Slimane for the experimental helps.
References
[1]
[2]
[3]
[4]
[5]
[6]
[7]
[8]
[9]
[10]
[11]
[12]
[13]
L. Machala, R. Zboril, A. Gedanken, J. Phys. Chem. B 111 (2007) 4003–4018.
B. Danzfuss, U. Stimming, J. Electroanal. Chem. 164 (1984) 89–119.
L. Murawski, C. Chung, J. Mackenzie, J. Non-Cryst. Solids 32 (1979) 91–104.
J. Sarradin, A. Guessous, M. Ribes, J. Power Sources 62 (1996) 149–154.
N. Perkas, Y. Koltypin, O. Palchik, A. Gedanken, S. Chandrasekaran, Appl. Catal., A
209 (2001) 125–130.
D.N. Srivastava, N. Perkas, A. Gedanken, I. Felner, J. Phys. Chem. B 106 (2002)
1878–1883.
R. Andreozzi, M. Canterino, V. Caprio, I.D. Somma, R. Marotta, J. Hazard. Mater.
152 (2008) 870–875.
M. Muruganandham, R. Amutha, B. Ahmmad, E. Repo, M. Sillanpaa, J. Phys. Chem.
C 114 (2010) 22493–22501.
P.-S. Li, H. Teng, J. Chin. Inst. Chem. Eng. 38 (2007) 267–273.
L. Casas, A. Roig, E. RodrÃguez, E. Molins, J. Tejada, J. Sort, J. Non-Cryst. Solids 285
(2001) 37–43.
G. Neri, A. Bonavita, C. Milone, A. Pistone, S. Galvagno, Sens. Actuators, B 92
(2003) 326–330.
C. Pascal, J.L. Pascal, F. Favier, M.L. Elidrissi Moubtassim, C. Payen, Chem. Mater. 11
(1999) 141–147.
X. Liao, J. Zhu, W. Zhong, H.-Y. Chen, Mater. Lett. 50 (2001) 341–346.
N.D. Phu et al. / Journal of Non-Crystalline Solids 358 (2012) 537–543
[14] J. Pinkas, V. Reichlova, R. Zboril, Z. Moravec, P. Bezdicka, J. Matejkova, Ultrason.
Sonochem. 15 (2008) 257–264.
[15] K.S. Suslick, S.-B. Choe, A.A. Cichowlas, M.W. Grinstaff, Nature 353 (1991)
414–416.
[16] X. Cao, R. Prozorov, Y. Koltypin, G. Kataby, I. Felner, A. Gedanken, J. Mater. Res. 12
(1997) 402–406.
[17] X. Cao, Y. Koltypin, R. Prozorov, G. Kataby, A. Gedanken, J. Mater. Chem. 7 (1997)
2447–2451.
[18] W. Huang, X. Tang, I. Felner, Y. Koltypin, A. Gedanken, Mater. Res. Bull. 37 (2002)
1721–1735.
[19] H. Schmidt, Appl. Organomet. Chem. 15 (2001) 331–343.
[20] R.V. Kumar, Y. Koltypin, X.N. Xu, Y. Yeshurun, A. Gedanken, I. Felner, J. Appl. Phys.
89 (2001) 6324–6328.
[21] D.N. Srivastava, N. Perkas, A. Zaban, A. Gedanken, Pure Appl. Chem. 74 (2002)
1509–1517.
[22] R. Ramesh, K. Ashok, G.M. Bhalero, S. Ponnusamy, C. Muthamizhchelvan, Cryst.
Res. Technol. 45 (2010) 965–968.
[23] J. Wu, S. Mao, Z.-G. Ye, Z. Xie, L. Zheng, Appl. Mater. Interfaces 2 (2010)
1561–1564.
[24] O. Kido, Y. Higashino, K. Kamitsuji, M. Kurumada, T. Sato, Y. Kimura, H. Suzuki, Y.
Saito, C. Kaito, J. Phys. Soc. Jpn. 73 (2004) 2014–2016.
[25] N.D. Phu, P.C. Phong, N. Chau, N.H. Luong, L.H. Hoang, N.H. Hai, J. Exp. Nanosci. 4
(2009) 253–258.
[26] J. Elder, Thermochim. Acta 243 (1994) 209–222.
[27] H.E. Kissinger, Anal. Chem. 29 (1957) 1702–1706.
[28] D.-T. Ngo, M.S. Mahmud, N.H. Hai, D.T.H. Gam, N.Q. Hoa, S. McVitie, N. Chau, J.
Magn. Magn. Mater. 322 (2010) 342–347.
543
[29] T. Prozorov, R. Prozorov, Y. Koltypin, I. Felner, A. Gedanken, J. Phys. Chem. B 102
(1998) 10165–10168.
[30] O.M. Lemine, M. Sajieddine, M. Bououdina, R. Msalam, S. Mufti, A. Alyamani, J.
Alloys Compd. 502 (2010) 279–282.
[31] T. Osaka, T. Matsunaga, T. Nakanishi, A. Arakaki, D. Niwa, H. Iida, Anal. Bioanal.
Chem. 384 (2006) 593–600.
[32] I.V. Chernyshova, M.F. Hochella Jr., A.S. Madden, Phys. Chem. Chem. Phys. 9
(2007) 1736–1750.
[33] S.-H. Shim, T.S. Duffy, Am. Mineral. 87 (2002) 318–326.
[34] I.R. Beattie, T.R. Gilson, J. Chem. Soc. A (1970) 980–986.
[35] M.J. Massey, U. Baier, R. Merlin, W.H. Weber, Phys. Rev. B 41 (1990) 7822–7827.
[36] K.F. McCarty, Solid State Commun. 68 (1988) 799–802.
[37] D. de Faria, F. Lopes, Vib. Spectro. 45 (2007) 117–121.
[38] A.L. Schoenhalz, J.T. Arantes, A. Fazzio, G.M. Dalpian, Appl. Phys. Lett. 94 (2009)
162503–162505.
[39] O.N. Shebanova, P. Lazor, J. Raman Spectrosc. 34 (2003) 845–852.
[40] G. Nauer, P. Strecha, N. Brinda-Konopik, G. Liptay, J. Therm. Anal. Calorim. 30
(1985) 813–830.
[41] D.L.A. de Faria, S. Venâncio Silva, M.T. de Oliveira, J. Raman Spectrosc. 28 (1997)
873–878.
[42] B. Zhao, Y. Wang, H. Guo, J. Wang, Y. He, Z. Jiao, M. Wu, Mater. Sci. Poland 25
(2007) 1143.
[43] T. Henmi, Clay Clay Miner. 28 (1980) 92–96.
[44] H. Levinstein, M. Robbins, C. Capio, Mater. Res. Bull. 7 (1972) 27–34.
[45] Y.-Y. Li, Phys. Rev. 101 (1956) 1450–1454.
[46] W.P. Osmond, Proc. Phys. Soc. 79 (1962) 394.