DSpace at VNU: FLU, an amino acid substitution model for influenza proteins
Bạn đang xem bản rút gọn của tài liệu. Xem và tải ngay bản đầy đủ của tài liệu tại đây (1.17 MB, 11 trang )
Dang et al. BMC Evolutionary Biology 2010, 10:99
/>
Open Access
RESEARCH ARTICLE
FLU, an amino acid substitution model for
influenza proteins
Research article
Cuong Cao Dang1, Quang Si Le*2, Olivier Gascuel3 and Vinh Sy Le1
Abstract
Background: The amino acid substitution model is the core component of many protein analysis systems such as
sequence similarity search, sequence alignment, and phylogenetic inference. Although several general amino acid
substitution models have been estimated from large and diverse protein databases, they remain inappropriate for
analyzing specific species, e.g., viruses. Emerging epidemics of influenza viruses raise the need for comprehensive
studies of these dangerous viruses. We propose an influenza-specific amino acid substitution model to enhance the
understanding of the evolution of influenza viruses.
Results: A maximum likelihood approach was applied to estimate an amino acid substitution model (FLU) from ~113,
000 influenza protein sequences, consisting of ~20 million residues. FLU outperforms 14 widely used models in
constructing maximum likelihood phylogenetic trees for the majority of influenza protein alignments. On average, FLU
gains ~42 log likelihood points with an alignment of 300 sites. Moreover, topologies of trees constructed using FLU and
other models are frequently different. FLU does indeed have an impact on likelihood improvement as well as tree
topologies. It was implemented in PhyML and can be downloaded from />FLU or included in PhyML 3.0 server at />Conclusions: FLU should be useful for any influenza protein analysis system which requires an accurate description of
amino acid substitutions.
Background
The majority of statistical methods used for analyzing
protein sequences require an amino acid substitution
model to describe the evolutionary process of protein
sequences. Amino acid substitution models are frequently used to infer protein phylogenetic trees under
maximum likelihood or Bayesian frameworks [[1,2], and
references therein]. They are also used to estimate pairwise distances between protein sequences that subsequently serve as inputs for distance-based phylogenetic
analyses [3]. Moreover, these models can be used for
aligning protein sequences [4]. These and other applications of the amino acid substitution model are reviewed
in [5].
Many methods have been proposed to estimate general
amino acid substitution models from large and diverse
databases [[1,6], and references therein]. These methods
* Correspondence:
2
Wellcome Trust Sanger Institute, Wellcome Trust Genome Campus, Hinxton,
Cambridge, CB10 1SA, UK
Full list of author information is available at the end of the article
belong to either counting or maximum likelihood
approaches. The first counting method was proposed by
Dayhoff et al. [7] to estimate the PAM model. As more
protein sequences accumulated, Jones et al. [8] used the
same counting method to estimate the JTT model from a
larger protein data set. However, the counting methods
are limited to only closely related protein sequences.
The maximum likelihood method was proposed by
Adachi and Hasegawa [9] to estimate the mtREV model
from 20 complete vertebrate mtDNA-encoded protein
sequences. The mtREV model outperformed other models when analyzing the phylogenetic relationships among
species based on their mtDNA-encoded protein
sequences. Whelan and Goldman [10] proposed a maximum likelihood method to estimate the WAG model
from 182 globular protein families. The WAG model produced better likelihood trees than the Dayhoff and JTT
models for a large number of globular protein families.
Recently, Le and Gascuel [6] improved the maximum
likelihood method by incorporating the variability of evolutionary rates across sites into the estimation process.
© 2010 Dang et al; licensee BioMed Central Ltd. This is an Open Access article distributed under the terms of the Creative Commons
BioMed Central Attribution License ( which permits unrestricted use, distribution, and reproduction in
any medium, provided the original work is properly cited.
Dang et al. BMC Evolutionary Biology 2010, 10:99
/>
The method was used to estimate the so-called LG model
from the Pfam database. Experiments showed that the LG
model gave better results than other models both in
terms of likelihood values and tree topologies.
Although a number of general models have been estimated from large and diverse databases comprising multiple genes and a wide range of species, they might be
inappropriate for a particular set of species due to differences in the evolutionary processes of these species. A
number of specific amino acid substitution models for
important species have been introduced [11,12], e.g.
HIV-specific models that showed a consistently superior
fit compared with the best general models when analyzing HIV proteins.
In recent years, the world has encountered a series of
emerging influenza epidemics, including H5N1 ('avian
flu') or H1N1. These have caused serious problems in
economics and human health. Theoretical and experimental studies have been extensively conducted to understand the evolution, transmission and infection processes
of influenza viruses [13-17]. We propose here our FLU
model which was specifically estimated for modeling the
evolution of influenza viruses. Experiment results show
that FLU is robust and better than other models in analyzing influenza proteins. Thus, it could enhance studies
of the evolution of influenza viruses.
Results and Discussion
We used the maximum likelihood approach introduced
by Le and Gascuel [6] to estimate an influenza-specific
amino acid substitution model (called FLU) from data set
D comprising 992 influenza protein alignments. In the
following sections, the main properties and performance
of FLU in comparison with 14 widely used models will be
analyzed.
Model analysis
FLU, as an amino acid substitution model, includes a
symmetric amino acid exchangeability matrix and an
amino acid frequency vector. Thus, we analyze FLU with
other models by comparing their amino acid exchangeabilities and frequencies. Table 1 presents low correlations between FLU and other models, which means that
FLU is highly different from existing models. HIVb and
HIVw are among the models that are most highly correlated with FLU, since they were also estimated from RNA
virus proteins.
In the following, we compare FLU with HIVb (a HIVspecific model) and LG (the best general model) in detail.
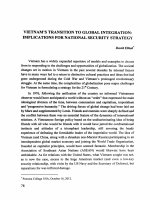
Figure 1 displays the amino acid frequencies of these
models and the empirical amino acid frequencies
(denoted Influenza) that were counted from all alignments of data set D. Amino acid frequencies of FLU and
Influenza are nearly identical (correlation ~0.94), the cor-
Page 2 of 11
Table 1: The Pearson's correlations between FLU and 14
widely used models. The low correlations indicate that FLU
is highly different from existing models.
model
exchangeability
matrix
frequency
vector
JTT
0.88
0.79
HIVb
0.86
0.71
HIVw
0.83
0.83
WAG
0.83
0.76
LG
0.82
0.71
CpREV
0.81
0.73
Blosum62
0.77
0.73
MtREV
0.77
0.48
RtREV
0.76
0.66
VT
0.75
0.76
MtMam
0.74
0.48
DCMut
0.74
0.69
Dayhoff
0.74
0.69
MtArt
0.70
0.45
relation being much higher than that of Influenza with
the 2 other models, HIVb (~0.84) and LG (~0.84). Notably, we observe large differences between the amino acid
frequencies of Influenza and the others. For example, the
frequency of leucine (L) in Influenza (~7%) is much lower
than that in HIVb (~10%) and LG (~10%). These results
indicate that FLU represents the amino acid frequencies
of influenza proteins more accurately than other models.
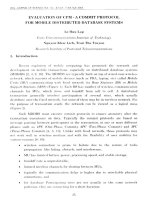
The exchangeability coefficients of FLU, HIVb, and LG
models (Figure 2), in principle, describe similar biological, chemical and physical properties of the amino acids,
e.g. the high exchange rate between lysine (a positively
charged, polar amino acid) and arginine (a positively
charged, polar amino acid) or the low exchange rate
Figure 1 Amino acid frequencies of FLU, HIVb, LG models and the
empirical frequencies counted from all alignments (denoted Influenza).
Dang et al. BMC Evolutionary Biology 2010, 10:99
/>
Page 3 of 11
same data set D, it contains more free parameters than
other models, i.e. 208 with -F option or 189 with +F
option. To compare the performance of FLU and other
models, the AIC criterion was used [19].
The average AIC of FLU is higher than that of other
models (Table 3). For example, FLU gains 0.3 AIC per site
when compared with the second best model, HIVb. In the
case where 2 models have the same number of free
parameters, 0.3 AIC per site is equivalent to ~45 log likelihood points per alignment of 300 sites. The last column
of Table 3 shows the AIC differences between +F and -F
options. The +F option would improve the AIC only
when the amino acid frequencies of the model are significantly different from the empirical frequencies. However,
the +F option might lead to the loss of AIC due to the
penalty of 19 additional free parameters. Table 3 shows
that the +F option did not improve the AIC for most of
the models due to the slight difference between the Influenza and the amino acid frequencies of the models,
except MtREV, MtMam, and MtArt estimated from mitochondrial proteins. In these cases, the +F option significantly improved the AIC because of the high difference
between the amino acid frequencies of influenza and
mitochondrial proteins (correlation ~0.54).
Figure 2 The exchangeability coefficients in FLU, HIVb and LG
models. The black bubble at the intersection of line X and column Y
presents the exchangeability between amino acid X and amino acid Y
in FLU. Similarly, the grey and white bubbles present exchangeabilities
between amino acids in the LG and HIVb models, respectively. These
bubbles show remarkable differences between these models.
Two-fold cross validation
between lysine and cysteine (a neutral, nonpolar amino
acid). However, they differ considerably when we look in
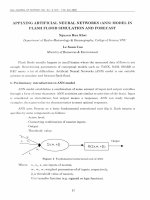
their relative differences (Figure 3). For example, 41 out of
190 coefficients in FLU are at least 5 times as large as corresponding ones in the HIVb model. Table 2 summarizes
the relative differences between FLU and HIVb, LG models.
In a nutshell, FLU is very different from existing models
in both amino acid exchangeabilities and frequencies.
In the two-fold cross validation, we randomly divided D
into halves D1 and D2 where either one served as the
learning data set and the other acted as the testing data
set. Due to the low number of protein types (see Table 4),
D1 and D2 might contain alignments of the same protein
types. We first estimated FLU1 (FLU2) model from D1
(D2), and then used FLU1 (FLU2) to construct maximum
likelihood trees for alignments of D2 (D1). Consequently,
we obtained 992 maximum likelihood trees inferred
using either FLU1 or FLU2. For the sake of simplicity, we
denote FLU as the overall model for FLU1 and FLU2 in
analyzing the two-fold cross validation. Since learning
and testing data sets are independent, there is no penalty
for additional free parameters when comparing FLU with
other models, i.e., we could directly compare log likelihoods of trees inferred using FLU and other models.
It is clear from Tables 5 and 6 that FLU outperforms all
other models. It helps to construct the best likelihood
trees for 680 out of 992 alignments (69%) and the second
FLU performance
We compared the performance of FLU and other models
in constructing maximum likelihood trees for influenza
protein alignments. Maximum likelihood trees were constructed by PhyML with 4 discrete gamma rate categories
(+Γ = 4), invariant sites (+I), and -F/+F options [18].
Global test
In the global test, we used FLU and other models to construct maximum likelihood trees for 992 protein alignments of D. Since we estimated and tested FLU on the
Table 2: Relative differences between FLU and HIVb (LG) models.
FLU > HIVb
HIVb > FLU
FLU > LG
LG > FLU
Twice
67
40
20
90
Five
41
21
2
53
The value at the row 'Twice' and column 'FLU>HIVb' indicates the number of exchangeability coefficients in FLU that are at least twice as large
as corresponding ones in the HIVb model. Similar explanations can be given for other entries.
Dang et al. BMC Evolutionary Biology 2010, 10:99
/>
Page 4 of 11
Figure 3 The bubbles display the relative differences between exchangeability coefficients in FLU and HIVb (left), and FLU with LG (right).
On the left side, each bubble represents the value of (FLUij - HIVbij)/(FLUij + HIVbij) where FLUij (HIVbij) is the exchangeability coefficient in FLU (HIVb).
Values 1/3 and 2/3 mean that the FLU coefficient is 2 and 5 times as large as that of HIVb, respectively. Values -1/3 and -2/3 mean that HIVb is 2 and 5
times larger than FLU, respectively. Similar explanations can be also given on the right side, but now between FLU and LG models.
best trees for 131 other alignments (13%). FLU trees also
have the highest average likelihoods, which is 0.14 log
likelihood point per site higher than the second best
model, HIVb (Table 7). This means that FLU gains about
~42 log likelihood points on average when applied to an
alignment of 300 amino acids. HIV models, as expected,
are the second and third best models since they were also
estimated from RNA virus proteins. Since HA and NA
proteins are the most crucial proteins of influenza
viruses, a large number of HA and NA protein sequences
Table 3: Average AIC per site of FLU and other models. FLU has better AIC than other models.
without F option
with F option
difference between
(-F)
(+F)
+F and -F options
FLU
-21.01
-21.09
-0.08
HIVb
-21.31
-21.34
-0.03
JTT
-21.37
-21.37
-0.00
HIVw
-21.43
-21.42
0.01
CpREV
-21.49
-21.54
-0.05
LG
-21.57
-21.56
0.01
WAG
-21.58
-21.51
0.07
VT
-21.79
-21.68
0.11
Dayhoff
-21.79
-21.62
0.17
DCMut
-21.79
-21.62
0.17
RtREV
-21.80
-21.70
0.10
Blosum62
-21.85
-21.82
0.03
MtREV
-22.48
-21.76
0.72
MtMam
-22.73
-21.97
0.76
MtArt
-22.86
-22.15
0.71
Dang et al. BMC Evolutionary Biology 2010, 10:99
/>
Page 5 of 11
Table 4: A summary of influenza viruses.
Type A
Type B
Type C
proportion (%)
HA
v
v
v
30,63
NA
v
v
14,67
PA
v
v
9,06
PB2
v
v
v
8,93
PB1
v
v
v
7,97
NS1
v
v
v
7,65
NP
v
v
v
6,87
M2
v
NS2
v
v
v
3,49
v
v
3,10
PB1-F2
v
M1
v
4,13
3,29
NB
v
0,11
BM2
v
0,04
CM2
v
0,03
P3
v
0,02
The last column shows proportions of proteins used to estimate the FLU model.
were available to estimate the model (see Table 4). FLU
outperforms other models in ~98% of HA and NA alignments. It is significantly better than HIVb in ~95%
(~92%) of HA (NA) alignments. However, it is worse than
HIVb when analyzing M2 and PB1-F2 protein alignments.
The likelihood difference between 2 trees inferred
using 2 different models M1 and M2 might fluctuate due
to various error factors, e.g., numerical problems and
local optimizations. To assess the statistical significance
of the difference between M1 and M2, we used a simple
nonparametric version of the Kishino-Hasegawa (KH)
test [20] as used in [6]. As explained in [6], the test avoids
any normality assumption and selection bias that would
favor one model compared with the other (refer to [6,21]
for detailed explanations and calculations). Table 8 shows
that FLU is significantly better than other models for the
majority of alignments. For example, the KH test determined 484 (~49%) alignments where FLU trees had significantly higher likelihood values than HIVb trees. The
number increases to 731 (~74%) or 907 (~92%) when
compared with the JTT and LG, respectively. FLU was
significantly worse than one of 14 compared models in
only ~7% of alignments. These comparisons lead to the
conclusion that FLU describes the evolution of influenza
viruses better than other models, thus resulting in more
accurate phylogenetic trees.
Tree analysis
We observed a large number of alignments where tree
topologies of FLU and other models were different (Table
9). For example, FLU trees and HIVb trees are topologically different for 917 (~92%) alignments, of which FLU is
better than the HIVb for 655 (~72%) alignments.
To measure the difference between 2 tree topologies,
we used the Robinson-Fould (RF) distance, which is the
number of bi-partitions present in one of the two trees
but not the other, divided by the number of possible bipartitions. Thus, the smaller the RF distance between 2
trees, the closer their topologies. Note that the RF ranges
from 0.0 to 1.0.
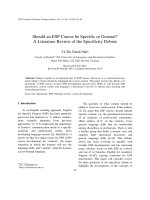
Figure 4 shows that tree topologies inferred using FLU
are highly different from those inferred using other models. For example, the RF distance between FLU trees and
HIVb trees is ~0.2 (~0.4) for about 25% (12.5%) of alignments. The average branch length of FLU trees (0.037) is
longer than that of trees inferred using general trees, e.g.
LG (0.032), JTT (0.031). This finding indicates that FLU
trees capture more hidden substitutions that might have
occurred along the branches and therefore might better
characterize the evolutionary patterns of influenza
viruses than trees inferred using general models (see [22]
for discussions on tree length).
Robustness of model
We investigated the robustness of FLU by measuring the
correlations between FLU, FLU1 and FLU2. Table 10
shows extremely high correlations (> 99%) between FLU,
FLU1 and FLU2 in both amino acid frequencies and
exchangeability coefficients. Thus, the data set D is sufficiently large to estimate a robust amino acid substitution
model for influenza proteins.
Dang et al. BMC Evolutionary Biology 2010, 10:99
/>
Page 6 of 11
Table 5: Comparisons of FLU and 14 other models in constructing maximum likelihood trees (-F option).
1st
2nd
3rd
4th
5th
6th
7th
8th
9th
10th
11th
12th
13th
14th
15th
FLU
680
129
147
19
2
4
4
4
1
1
1
0
0
0
0
HIVb
200
405
198
46
33
64
18
8
7
6
7
0
0
0
0
HIVw
91
115
200
178
64
58
144
20
29
16
16
61
0
0
0
JTT
14
274
290
398
14
0
1
0
1
0
0
0
0
0
0
LG
5
15
26
75
168
394
189
15
64
21
16
4
0
0
0
CpREV
2
25
54
204
542
112
13
20
8
7
4
1
0
0
0
WAG
1
28
70
55
134
278
357
43
25
1
0
0
0
0
0
Dayhoff
0
1
0
1
8
18
94
196
209
235
200
24
5
1
0
VT
0
0
3
9
17
30
74
226
192
164
178
71
24
4
0
Blosum62
0
0
3
7
8
18
28
103
84
139
95
436
24
47
0
DCMut
0
0
1
0
1
9
35
103
176
207
249
199
8
4
0
RtREV
0
0
0
0
1
5
29
234
175
174
190
157
14
13
0
MtMam
0
0
0
0
0
2
5
12
10
15
16
14
49
638
230
MtREV
0
0
0
0
0
0
1
8
11
6
20
25
849
69
3
MtArt
0
0
0
0
0
0
0
0
0
0
0
0
19
216
757
The number on the cell of model M and column p indicates the number of alignments where M model stands at the rank p over 15 models tested.
For example, FLU model stands at the first rank for 680 out of 992 alignments.
We also examined the influence of the temporal aspect
of influenza evolution on FLU. To this end, the data set D
was divided into 2 nearly equal subsets Dt1 (27,752 protein sequences before 2004) and Dt2 (23,397 protein
sequences since 2004). We used subset Dt1 (Dt2) to esti-
mate model FLUt1 (FLUt2). FLUt1 and FLUt2 were nearly
identical (correlation ~0.99). Moreover, FLUt1 and FLUt2
were highly correlated to FLU (correlation ~0.97). The
high correlations indicate that the influence of the temporal aspect of influenza evolution on estimating the
Table 6: Comparisons of FLU and 14 other models in constructing maximum likelihood trees (+F option).
1st
2nd
3rd
4th
5th
6th
7th
8th
9th
10th
11th
12th
13th
14th
15th
FLU
635
123
202
19
5
2
2
1
2
0
1
0
0
0
0
HIVb
196
375
105
109
61
25
21
22
22
16
35
5
0
0
0
HIVw
148
146
290
73
36
41
22
11
17
56
36
93
19
3
1
JTT
6
168
218
540
23
20
9
5
1
2
0
0
0
0
0
MtREV
3
1
2
9
77
127
102
66
43
38
115
91
307
10
1
MtMam
2
4
6
7
52
62
53
60
42
62
39
92
71
343
97
WAG
1
166
124
52
33
96
146
130
89
63
55
25
12
0
0
CpREV
1
3
5
18
451
159
158
64
95
28
4
3
3
0
0
VT
0
3
11
21
34
35
46
80
83
135
73
101
206
151
13
LG
0
1
16
110
131
240
134
83
140
53
42
40
2
0
0
Dayhoff
0
1
11
19
60
93
151
227
145
147
91
28
13
5
1
Blosum62
0
1
1
3
1
2
5
11
25
20
115
192
106
203
307
DCMut
0
0
1
11
24
73
108
153
213
143
145
88
26
6
1
MtArt
0
0
0
1
3
1
5
4
4
5
12
32
137
219
569
RtREV
0
0
0
0
1
16
30
75
71
224
229
202
90
52
2
The number on the cell of model M and column p indicates the number of alignments where M model stands at the rank p over 15 models tested.
For example, FLU model stands at the first rank for 635 out of 992 alignments.
Dang et al. BMC Evolutionary Biology 2010, 10:99
/>
Page 7 of 11
Table 7: Comparisons of FLU and 14 other models in constructing maximum likelihood trees.
LogLK/site
LogLK/site
without F option (-F)
with F option (+F)
FLU
-10.51
-10.49
HIVb
-10.65
-10.61
HIVw
-10.71
-10.65
JTT
-10.68
-10.63
LG
-10.78
-10.82
cpREV
-10.74
-10.93
WAG
-10.78
-10.70
Dayhoff
-10.89
-10.71
VT
-10.89
-10.78
Blosum62
-10.92
-10.72
DCMut
-10.89
-10.75
RtREV
-10.89
-10.85
MtMam
-11.36
-10.75
MtREV
-11.23
-11.01
MtArt
-11.42
-10.79
FLU trees have the highest average likelihoods.
amino acid substitution model is insignificant. Thus, FLU
is applicable to analyze both old and recent influenza proteins.
Conclusions
We propose the FLU model that has been specifically
estimated for modeling the evolution of influenza viruses.
Analyses revealed significant differences between FLU
and existing models in both amino acid frequencies and
exchangeability coefficients. Experiments showed that
FLU better characterizes the evolutionary patterns of
influenza viruses than general models.
Both the global test and 2-fold cross validation confirmed that FLU is better than existing models in constructing maximum likelihood trees. Using the KH test,
FLU proved significantly better than other models for a
majority of alignments tested. Nevertheless, there were a
few alignments (typically from M2 and PB1-F2 proteins)
where FLU was significantly worse than the HIV-specific
models or general models, e.g. LG, or JTT. In this study,
Table 8: Pairwise comparisons between FLU and HIVb, HIVw, JTT, LG models.
LogLK/site
#M1 > M2
#M2 > M1
M1 > M2
(p < .05)
(p < .05)
0.14
696
484
49
HIVw (-F)
0.19
843
689
46
JTT (-F)
0.17
926
731
10
M1
M2
FLU (-F)
HIVb (-F)
FLU (-F)
FLU (-F)
FLU (-F)
LG (-F)
0.26
971
907
6
FLU (+F)
HIVb (+F)
0.12
674
437
89
FLU (+F)
HIVw (+F)
0.16
734
561
84
FLU (+F)
JTT (+F)
0.13
958
755
3
FLU (+F)
LG (+F)
0.23
988
954
0
LogLK/site: the log likelihood difference between trees inferred using M1 and M2; a positive (negative) value means M1 is better (worse) than
M2. #M1 > M2: the number of alignments among 992 alignments where M1 results in better likelihood value than M2. #M1 > M2 (p < 0.05): the
number of alignments where the Kishino-Hasegawa test indicates that M1 is significantly better than M2. #M2 > M1 (p < 0.05): the same as #M1
> M2, but now M2 is significantly better than M1.
Dang et al. BMC Evolutionary Biology 2010, 10:99
/>
Page 8 of 11
Table 9: Pairwise comparisons between FLU and HIVb, HIVw, JTT, LG models.
M1
#T1 > T2
#T2 > T1
(p < .05)
(p < .05)
M2
#T1 > T2
FLU (-F)
HIVb (-F)
655/917
454
40
FLU (-F)
HIVw (-F)
792/932
655
41
FLU (-F)
JTT (-F)
890/938
710
6
FLU (-F)
LG (-F)
921/935
868
5
FLU (+F)
HIVb (+F)
627/916
412
83
FLU (+F)
HIVw (+F)
701/932
540
78
FLU (+F)
JTT (+F)
887/912
705
3
FLU (+F)
LG (+F)
922/924
897
0
T1 (T2) is the tree inferred using M1 (M2) model. #T1 > T2: the number of alignments where topologies of T1 and T2 are different and the likelihood
of T1 is higher than the likelihood of T2 (the first number), and the number of alignments where topologies of T1 and T2 are different (the
second number). #T1 > T2 (p < 0.05): special cases of #T1 >T2, where T1 is significantly better than T2. #T2 > T1 (p < 0.05): the same as #T1 > T2 (p
< 0.5), but now T2 is significantly better than T1.
amino acid sequences were aligned by Muscle [23] to produce alignments that serve as inputs for estimating FLU.
Recently, Liu et al. [24] proposed a method for coestimating sequence alignments and phylogenetic trees, and
showed that it improved tree and alignment accuracy
compared with 2-phase methods for large DNA data sets.
Although previous studies showed that models estimated
using near-optimal phylogenetic trees are relatively stable
[[10], and references therein], it would be interesting to
assess the influence of the coestimation method on the
estimation of amino acid substitution models in future
work. The occurrence of homologous recombination
within influenza virus genes has been reported, however,
it is rare and controversial [25,26]. Therefore, the FLU
was estimated in a standard phylogenetic framework.
The effect of the homologous recombination, if it occurs
at all, on the FLU model would be discovered in future
work. In summary, FLU model is useful for any influenza
protein analysis system that demands an accurate
Figure 4 The Robinson-Foulds distance between trees inferred
using FLU and HIVb (LG, JTT, HIVw) models. The horizontal axis indicates the RF distance between 2 tree topologies, whereas the vertical
axis indicates the number of alignments.
description of amino acid substitutions. It should
enhance our understanding of the evolution, transmission and infection processes of influenza viruses.
Methods
Data
Influenza viruses are RNA viruses from the Orthomyxoviridae family, which is divided into 3 types: influenzas A,
B, and C. Influenza A viruses frequently cause serious
epidemics and pandemics, such as Spanish flu H1N1,
Asian flu H2N2, Hong Kong flu H3N2, or avian flu H5N1
(see Table 4 for a short summary of influenza viruses).
Influenza viruses have been isolated since the beginning
of the 20th century, and a huge number of their proteins
have been sequenced and stored at the NCBI [13,16].
To estimate the amino acid substitution model for
influenza viruses, we downloaded the entire influenza
database at NCBI (July 26th 2009 version) [16], including
112,450 protein sequences (103,626 for A; 7,892 for B;
and 932 for C). The sequences were processed before
estimating the model.
• Cleaning step: Only distinct sequences were kept.
The set consisted of 51,061 sequences, i.e. 46,909 for
A; 3,845 for B; and 307 for C.
• Dividing step: These distinct sequences were randomly divided into small groups such that each group
contained from 5 to 100 homologous sequences (the
same protein type) of the same virus type. This
resulted in 1046 groups.
• Aligning step: The 1046 groups were aligned by
Muscle, a multiple alignment program [23]. The
alignments were cleaned by the GBLOCKS [27] to
eliminate sites containing many gaps. We selected 992
alignments which contain at least 5 sequences and 50
sites for estimating the model.
Dang et al. BMC Evolutionary Biology 2010, 10:99
/>
Page 9 of 11
Table 1: 0Correlations between FLU, FLU1 and FLU2 models.
exchangeability matrix
frequency vector
FLU vs FLU1
99.95%
99.98%
FLU vs FLU2
99.95%
99.98%
FLU1vs FLU2
99.81%
99.94%
The exchangeability (frequency) column gives the correlations between exchangeability matrices (frequency vectors) of these models.
Model
We assume, as usual, that amino acid sites evolve independently, and the process has remained constant
throughout the course of evolution. The substitution process between amino acids is modeled by a time-homogeneous, time-continuous, time-reversible, and stationary
Markov process [[1,2,28], and references therein]. The
central component of the process is the so-called instantaneous substitution rate 20 × 20-matrix Q = {qxy} where
qxy (x ≠ y) is the number of substitutions from amino acid
x to amino acid y per time unit. The diagonal elements qxx
are assigned such that the sum of each row equals zero.
The matrix Q can be decomposed into symmetric
exchangeability rate matrix R = {rxy} and amino acid frequency vector π = {πx} such that qxy = rxyπy and qxx = -Σy≠x
qxy.
The likelihood of a multiple sequence alignment D =
{d1, ..., dn} of n sites given their phylogenetic tree T and
the model Q is
n
L(T , Q | D) =
∏ L(T , Q | d )
i
(1)
i =1
where L(T, Q|di) is the likelihood of site di given tree T
and model Q that can be efficiently calculated by a pruning algorithm [29].
In Equation 1, we assumed the same substitution rate
across amino acid sites. To incorporate the variability of
substitution rates across sites we used the combination of
invariant model [30,31] and Γ-distribution model [32].
The heterogeneous rate model r assumes a fraction θinv of
sequence sites to be invariant, and other sites are variant
with global substitution rates following the Γ-distribution
[33].
The likelihood of D given the phylogenetic tree T, substitution model Q, and rate model r is computed as
where L(inv|di) is the likelihood of site di following the
invariant model, that is, L(inv|di) is equal to πx if site di is
constant and contains only amino acid x, otherwise zero
when the site di is not constant; rcT denotes the tree T
with all branch lengths being multiplied by rc.
Model estimation
Given a set of m protein alignments D = {D1, ..., Dm}, the
substitution model Q can be estimated by the counting or
the maximum likelihood approach [[1], and references
therein]. A number of studies have shown that the maximum likelihood approach can avoid systematic errors
and makes more efficient use of information in the protein alignments compared with the counting approach
[10]. We applied the maximum likelihood approach,
introduced by Le and Gascuel in [6], to estimate the
model Q.
The model Q is estimated by maximizing the likelihood
L(D):
⎧⎪
Q = arg max ⎨ L(D) =
Q′
⎩⎪
m
∏
i =1
⎫⎪
L(Ti , Q′, ri | D i ) ⎬
⎭⎪
(2)
where Ti and ri are the phylogenetic tree and rate model
of the alignment Di, respectively. Optimizing the likelihood L(D) is a difficult problem because we have to construct all phylogenetic trees (topologies and branch
lengths), Q coefficients and rate parameters. Fortunately,
previous studies discovered that the estimated coefficients of Q remained nearly unchanged when near-optimal phylogenetic trees and rate parameters were used
[[10], and references therein]. Thus, the Equation 2 can
be simplified and approximated to:
m
L(D) =
∏ L(Q | T , r , D ),
i
i
i
(3)
i =1
n
L(T , Q, r | D) =
∏ L(T , Q, r | d )
i
i =1
n
=
∏
i =1
C
⎡
⎤
1
⎢ q inv L(inv | d i ) + (1 − q inv )
L(rc T , Q | d i ) ⎥
C
⎢⎣
⎥⎦
c =1
∑
where Ti and ri are near-optimal phylogenetic tree
and rate model of Di, respectively. We designed a 5-step
procedure to estimate the model Q (see Figure 5):
Dang et al. BMC Evolutionary Biology 2010, 10:99
/>
Figure 5 Flowchart to estimate the influenza-specific amino acid
substitution model.
• Step 1: Collect all influenza protein sequences from
the influenza database at NCBI (112,450 protein
sequences).
• Step 2: Process retrieved sequences as described in
the 'Data' section to obtain 992 multiple alignments.
• Step 3(Q = LG as the default): Estimate trees, rates,
etc., using Q and the phylogenetic software PhyML
[18].
• Step 4: Estimate a new model Q' using the approach
introduced in [6] and the XRate software [34].
• Step 5: Compare 2 models Q and Q'. If Q' is nearly
identical to Q, return Q' and consider it as the model
for influenza viruses. Otherwise, Q Q' and goto Step
3.
FLU was obtained after two iterations.
Authors' contributions
CCD, QSL, VSL, and OG discussed ideas. CCD implemented programs, conducted experiments, and wrote the draft manuscript. QSL and VSL designed
experiments and revised the manuscript. All authors read and approved the
final manuscript.
Acknowledgements
We would like to express our special thanks to Leopold Parts, and Hang Phan
for carefully reading the manuscript. We thank two anonymous reviewers for
helpful suggestions. Financial support from Vietnam National Foundation for
Science and Technology Development is greatly appreciated.
Author Details
1College of Technology, Vietnam National University Hanoi, 144 Xuan Thuy,
Cau Giay, Hanoi, Vietnam, 2Wellcome Trust Sanger Institute, Wellcome Trust
Genome Campus, Hinxton, Cambridge, CB10 1SA, UK and 3Methodes et
Algorithmes pour la Bioinformatique, LIRMM, CNRS, Universite Montpellier II,
Montpellier, France
Received: 21 September 2009 Accepted: 12 April 2010
Published: 12 April 2010
©
This
BMC
2010
is
article
Evolutionary
an
Dang
Open
is available
etAccess
al;Biology
licensee
from:
article
2010,
BioMed
/>distributed
10:99
Central
under
Ltd. the terms of the Creative Commons Attribution License ( which permits unrestricted use, distribution, and reproduction in any medium, provided the original work is properly cited.
Page 10 of 11
References
1. Felsenstein J: Infering Phylogenies Sunderland, Massachusetts, US: Sinauer
Associates; 2004.
2. Ziheng Y: Computational Molecular Evolution 1st edition. Oxford, UK:
Oxford University Press; 2006.
3. Opperdoes FR: Phylogenetic analysis using protein sequences. In The
Phylogenetics Handbook A Practical Approach to DNA and Protein Phylogeny
Edited by: Salemi M, Vandamme AM. Cambridge: Cambridge University
Press; 2003:207-235.
4. Setubal C, Meidanis J: Introduction to Computational Molecular Biology 1st
edition. Boston, Massachusetts, US: PWS Publishing; 1997.
5. Thorne J: Models of protein sequence evolution and their applications.
Currrent Opinion in Genetics and Development 2000, 10:602-605.
6. Le S, Gascuel O: An improved general amino acid replacement matrix.
Mol Biol Evol 2008, 25:1307-1320.
7. Dayhoff MO, Schwartz RM, Orcutt BC: A Model of Evolutionary Change in
Proteins. In Atlas of Protein Sequence Structure Volume 5. Edited by:
Dayhoff MO. Washington DC: National Biomedical Research Foundation;
1978:345-352.
8. Jones DT, Taylor WR, Thornton JM: The rapid generation of mutation
data matrices from protein sequences. Comput Appl Biosci 1992,
8:275-282.
9. Adachi J, Hasegawa M: Model of Amino Acid Substitution in Proteins
Encoded by Mitochondrial DNA. J Mol Evol 1996, 42:459-468.
10. Whelan S, Goldman N: A General Empirical Model of Protein Evolution
Derived from Multiple Protein Families Using a Maximum Likelihood
Approach. Mol Biol Evol 2001, 18:691-699.
11. Dimmic MW, Rest JS, Mindell DP, Goldstein RA: rtREV: an amino acid
substitution matrix for inference of retrovirus and reverse transcriptase
phylogeny. J Mol Evol 2002, 55:65-73.
12. Nickle DC, Heath L, Jensen MA, Gilbert PB, Mullins JI, Pond SK: HIV-Specific
Probabilistic Models of Protein Evolution. PLoS ONE 2007, 2:e503.
13. Fauci A: Race against time. Nature 2009, 435:423-424.
14. Ghedin E, Sengamalay N, Shumway M, Zaborsky J, Feldblyum T, Subbu V,
Spiro D, Sitz J, Koo H, Bolotov P, Dernovoy D, Tatusova T, Bao Y, St George
K, Taylor J, Lipman D, Fraser C, Taubenberger J, Salzberg S: Large-scale
sequencing of human influenza reveals the dynamic nature of viral
genome evolution. Nature 2005, 437:1162-1166.
15. Janies DA, Hill A, Guralnick R, Habib F, Waltari E, Wheeler WC: Genomic
Analysis and Geographic Visualization of the Spread of Avian Influenza
(H5N1). Systematic Biology 2007, 56:321-329.
16. Bao Y, Bolotov P, Dernovoy D, Kiryutin B, Zaslavsky L, Tatusova T, Ostell J,
Lipman D: The Influenza Virus Resource at the National Center for
Biotechnology Information. J Virol 2008, 82:596-601.
17. Nguyen T, Nguyen T, Vijaykrishna D, Webster R, Guan Y, Malik Peiris J,
Smith G: Multiple Sublineages of Influenza A Virus (H5N1), Vietnam,
2005-2007. Emerging Infectious Diseases 2008, 14:632-636.
18. Guindon S, Gascuel O: A Simple, Fast and Accurate Algorithm to
Estimate Large Phylogenies by Maximum Likelihood. Syst Biol 2003,
52:696-704.
19. Akaike H: A new look at the statistical model identification. IEEE Trans
Automat Contr 1974, 19:716-722.
20. Kishino H, Hasegawa M: Evaluation of the maximum likelihood estimate
of the evolutionary tree topologies from DNA sequence data, and the
branching order in hominoidea. J Mol Evol 1989, 29:170-179.
21. Goldman N, Anderson J, Rodrigo A: Likelihood-based tests of topologies
in phylogenetics. Syst Biol 2000, 49:652-670.
22. Pagel M, Meade A: Mixture models in phylogenetic inference. In
Mathematics of evolution and phylogeny Edited by: Gascuel O. Oxford, UK:
Oxford University Press; 2005:121-142.
23. Edgar RC: MUSCLE: multiple sequence alignment with high accuracy
and high throughput. Nucl Acids Res 2004, 32:1792-1797.
24. Kevin L, Sindhu R, Serita N, Randal L, Tandy W: Rapid and Accurate LargeScale Coestimation of Sequence Alignments and Phylogenetic Trees.
Science 2009, 324:1561-1564.
25. Boni M, Zhou Y, Taubenberger J, Holmes E: Homologous Recombination
is Very Rare or Absent in Human Influenza A Virus. Journal Virology
2008, 82:4807-4811.
26. He CQ, Xie ZX, Han GZ, Dong JB, Wang D, Liu JB, Ma LY, Tang XF, Liu XP,
Pang YS, Li GR: Homologous Recombination as an Evolutionary Force in
the Avian Influenza A Virus. Mol Bio Evol 2009, 26:177-187.
Dang et al. BMC Evolutionary Biology 2010, 10:99
/>
27. Castresana J: Selection of conserved blocks from multiple alignments
for their use in phylogenetic analysis. Molecular Biology and Evolution
2000, 17:540-552.
28. Strimmer K, Haeseler AV: Nucleotide Substitution Models. In The
Phylogenetics Handbook A Practical Approach to DNA and Protein Phylogeny
Edited by: Salemi M, Vandamme AM. Cambridge: Cambridge University
Press; 2003:72-100.
29. Felsenstein J: Evolutionary trees from DNA sequences: A maximum
likelihood approach. Journal of Molecular Evolution 1981, 17:368-376.
30. Fitch WM, Margoliash E: A method for estimating the number of
invariant amino acid position in a gene using cytochrome c as a model
case. Biochem Gene 1967, 1:65-71.
31. Churchill GA, Haeseler AV, Navidi WC: Sample Size for Phylogenetic
Inference. Mol Biol Evol 1992, 9:753-769.
32. Yang Z: Maximum-likelihood estimation of phylogeny from DNA
sequences when substitution rates differ over sites. Mol Biol Evol 1993,
10:1396-1401.
33. Gu X, Fu YX, Li WH: Maximum Likelihood Estimation of the
Heterogeneity of Substitution Rate among Nucleotide Sites. Mol Biol
Evol 1995, 12:546-557.
34. Klosterman P, Uzilov A, Bendana Y, Bradley R, Chao S, Kosiol C, Goldman N,
Holmes I: XRate: a fast prototyping, training and annotation tool for
phylo-grammars. BMC Bioinformatics 2006, 7:428.
doi: 10.1186/1471-2148-10-99
Cite this article as: Dang et al., FLU, an amino acid substitution model for
influenza proteins BMC Evolutionary Biology 2010, 10:99
Page 11 of 11