DSpace at VNU: Synthesis and optical properties of Al 2O 3:Cr 3+ powders
Bạn đang xem bản rút gọn của tài liệu. Xem và tải ngay bản đầy đủ của tài liệu tại đây (1.05 MB, 5 trang )
e-Journal of Surface Science and Nanotechnology
27 December 2011
Conference - IWAMN2009 -
e-J. Surf. Sci. Nanotech. Vol. 9 (2011) 531-535
Synthesis and Optical Properties of Al2 O3 :Cr3+ Powders∗
Trinh Thi Loan,† Nguyen Ngoc Long, and Le Hong Ha
Faculty of Physics, Hanoi university of Science, 334 Nguyen Trai, Thanh Xuan, Hanoi, Vietnam
(Received 11 December 2009; Accepted 18 March 2011; Published 27 December 2011)
The Al2−x Crx O3 powders with dopant contents ranging from x = 0.005 to 0.35 have been prepared by sol-gel
method. The powders were prepared from aluminium nitrate Al(NO3 )3 ·9H2 O, chrome nitrate Cr(NO3 )3 ·9H2 O,
and citric acid and heat-treated at 650-1300◦ C for 5 h. The effect of dopant concentration and heat-treating
temperature on the structural and optical properties of the synthesized samples has been studied. The results
showed that the structure, the size and optical properties of Al2−x Crx O3 crystallites strongly depended on the
mole fraction x and heating temperature. At low heating temperatures, the samples with the low mole fraction x
exhibit γ-Al2 O3 phase and the emission spectra consist of a broad asymmetric peak with the maximum at 691 nm.
With the high mole fraction x, the samples consist of α-Al2 O3 and Cr2 O3 phases. By increasing the mole fraction
x, the emission bands are broadened and shifted towards the long-wavelength side. At high heating temperatures,
all the synthesized samples are α-Al2 O3 single phase and the emission spectra mainly consist of lines at 691.6 and
693.2 nm. [DOI: 10.1380/ejssnt.2011.531]
Keywords: Cr3+ -doped Al2 O3 powders; Sol-gel method; Structural properties; Optical properties
I.
INTRODUCTION
Aluminium oxide materials play a key role in many
technologies due to its remarkable physical properties,
such as a high melting point, hydrophobicity, high elastic
modulus, high optical transparency, high refractive index
(about 1.76 at 632.8 nm wavelength), thermal and chemical stability, low surface acidity, and dielectric characteristics. The Al2 O3 materials exhibit more than 15 distinct
crystallographic phases, and it can undergo a variety of
transitions until the most-stable α-Al2 O3 phase, in which
all the cations are in a six-coordinate environment, forms
at high temperature [1]. It is well-known that γ-Al2 O3 is
an extremely important form of the known alumina crystalline phases, widely applied as a catalyst and catalyst
support of transition element clusters in the automotive
and petroleum industries. α-Al2 O3 doped with transition
metal Cr3+ and Ti3+ ions is the most important phase
for laser hosts, possessing excellent emitting properties
[2]. The Al2 O3 :Cr3+ crystal has no absorption band in
the near infrared range and has ever acted as a landmark
in development of laser history [3], and will still play an
important role in future. There are many methods to prepare Al2 O3 :Cr3+ materials, such as the sol-gel method,
solid-state reaction, pulsed laser deposition, hydrothermal method and so on. Because of the existence of many
various crystallographic phases, in order to obtain the alumina materials with desired phase, in this work we studied
the effect of dopant concentration and heat-treating temperature on the structural and optical properties of the
Al2 O3 :Cr3+ samples synthesized by sol-gel method.
II.
EXPERIMENTAL
The Al2−x Crx O3 powders with dopant contents ranging from x = 0.005 to 0.3 have been prepared
∗ This paper was presented at the International Workshop on Advanced Materials and Nanotechnology 2009 (IWAMN2009), Hanoi
University of Science, VNU, Hanoi, Vietnam, 24-25 November, 2009.
† Corresponding author:
by sol-gel method.
The powders were prepared
from Al(NO3 )3 ·9H2 O, Cr(NO3 )3 ·9H2 O, and citric acid.
Al(NO3 )3 ·9H2 O and Cr(NO3 )3 ·9H2 O solutions were
mixed with the Al3+ -to-Cr3+ mole ratios of (2-x) : x. Citric acid aqueous solution was added to the above solution
and the mixed solution temperature was kept constant at
70◦ C until a highly viscous gel was formed. After drying
in air at 120◦ C for 24 h, the gel is converted to a xerogel more opaque and dense. The xerogel was annealed in
the temperature range of 650-1300◦ C in air for 5 h. The
crystal structure of the samples was characterized by a
Siemens D5005 X-ray diffraction (XRD) diffractometer.
Photoluminescence (PL) spectra and photoluminescence
excitation (PLE) spectra were measured at room temperature using a Fluorolog FL3-22 spectrofluorometer with a
xenon lamp of 450 W being used as an excitation source.
III.
RESULTS AND DISCUSSION
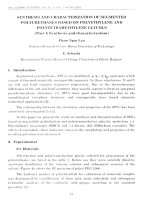
The XRD patterns of the of the Al2−x Crx O3 samples
with x = 0.005 and heat-treated at 650-900◦ C are shown
in Fig. 1. The samples heat-treated at 650 and 750◦ C are
amorphous. The γ-Al2 O3 phase with very broad diffraction peaks are clearly seen in the samples calcined at 800900◦ C. In the XRD patterns no any peak of impurity
phase has been observed. In the heat-treating temperature range from 800 to 900◦ C, the position and the full
width at half maximum of the diffraction peaks are similar.
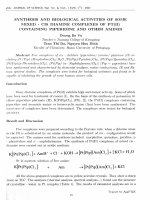
Figure 2 shows the XRD patterns of the Al2−x Crx O3
samples with x = 0.1 and heat-treated at 650-900◦ C. Unlike the samples with x = 0.005, for the samples with
x = 0.1, the characteristic peaks of γ-Al2 O3 phase can be
clearly seen already in the samples calcined at 750◦ C.
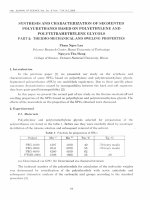
The XRD patterns of the Al2−x Crx O3 samples with
x = 0.2 and heat-treated at 650-900◦ C are shown in Fig. 3.
Contrary to the case of the samples with x = 0.005 and
0.1, in the XRD pattern of the sample with x = 0.2 undergone a heat-treatment at the temperature of 650◦ C, the
peaks corresponding to Cr2 O3 phase appeared . No additional peaks due to γ-Al2 O3 phase are observed. With
increasing heat-treatment temperature, the intensity of
c 2011 The Surface Science Society of Japan ( />ISSN 1348-0391 ⃝
531
Loan, et al.
Volume 9 (2011)
FIG. 1: XRD patterns of the Al2−x Crx O3 samples with x =
0.005, heat-treated at different temperatures. (a) T = 650, (b)
750, (c) 800, (d) 850, and (e) 900◦ C.
FIG. 3: XRD patterns of the Al2−x Crx O3 samples with x =
0.2, heat-treated at different temperatures. (a) T = 650, (b)
750, (c) 800, (d) 850, and (e) 900◦ C.
FIG. 2: XRD patterns of the Al2−x Crx O3 samples with x =
0.1, heat-treated at different temperatures. (a) T = 650, (b)
750, (c) 800, (d) 850, and (e) 900◦ C.
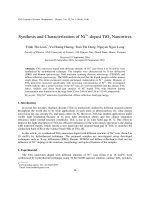
FIG. 4: XRD patterns of the Al2−x Crx O3 samples with x =
0.35, heat-treated at different temperatures. (a) T = 650, (b)
750, (c) 800, (d) 850, and (e) 900◦ C.
the diffraction peaks of Cr2 O3 phase decreases, but that
of the diffraction peaks of γ-Al2 O3 phase increases. Besides, some weak diffraction peaks of α-Al2 O3 phase are
also observed.
The lattice constants and the average crystalline sizes
of all the mentioned samples calculated from the XRD
patterns are shown in Table I. It can be seen from the
table, for each value of x, the lattice constants almost keep
constant in the calcined temperature range of 750-900◦ C.
It is also interested to notice that the grains of the γAl2 O3 phase in the samples calcined at the temperatures
in the range of 750-900◦ C have very small average sizes
of 6-7 nm.
For studying the effect of high dopant concentration on
the structure of the synthesized samples, the XRD patterns of the samples with x = 0.35, heat-treated at different temperatures were examined. The results presented
in Fig. 4 show that at heat-treating temperature 650◦ C,
in addition to the diffraction peaks of the Cr2 O3 phase,
the α-Al2 O3 phase narrow peaks are observed, although
it is well-known that the α-Al2 O3 phase only exists at the
high temperature. For higher heat-treating temperature,
the γ-Al2 O3 phase weak peaks are observed. With in-
creasing heat-treatment temperature, the intensity of the
diffraction peaks of the Cr2 O3 phase decreases, but that
of the diffraction peaks of the α-Al2 O3 phase increases.
Different from the samples with x = 0.2, for the samples
with x = 0.35, the intensity of the α-Al2 O3 phase peaks
stronger than that of the γ-Al2 O3 phase peaks.
For examining the effect of dopant concentration on the
structural properties of the synthesized samples at high
heat-treating temperature, the XRD patterns of samples
with different mole fractions x and undergone a heattreatment at 1000◦ C and 1300◦ C were investigated and
the results are presented in Figs. 5 and 6, respectively.
At 1000◦ C, for x = 0.005, the XRD patterns present the
cubic γ-Al2 O3 phase with additional weak peaks that correspond to the presence of the hexagonal α-Al2 O3 phase.
With increasing the mole fraction x, the intensity of the
diffraction peaks of the γ-Al2 O3 phase decreases, but that
of the diffraction peaks of the α-Al2 O3 phase increases
and for x = 0.35, no diffraction peaks of the γ-Al2 O3 are
observed. Beside, for x = 0.25, characteristic peaks of
the Cr2 O3 phase are observed. At 1300◦ C, all the synthesized samples with different mole fractions x are pure αAl2 O3 phase. It can be noticed that at high heat-treating
532
(J-Stage: />
e-Journal of Surface Science and Nanotechnology
Volume 9 (2011)
TABLE I: The dependence of the lattice constants and the average crystalline sizes on the amount of Cr in Al2−x Crx O3 with
different heat-treatment temperatures.
x
0.005
0.1
0.2
T (◦ C)
800-900
750-900
750-900
˚)
a (A
7.92 ± 0.02
7.94 ± 0.02
7.96 ± 0.02
D (nm)
7
6-7
6
FIG. 5: XRD patterns of the Al2−x Crx O3 samples with different mole fractions x, heat-treated at 1000◦ C. (a) x = 0.005,
(b) 0.1 (c) 0.25, (d) 0.3, and (e) 0.35.
FIG. 7: PL spectra of the Al2−x Crx O3 samples with x =
0.005, heat-treated at different temperatures, excited by 556
nm wavelength. (a) T = 650, (b) 750, (c) 800, (d) 850, and
(e) 900◦ C.
FIG. 6: XRD patterns of the Al2−x Crx O3 samples with different mole fractions x, heat-treated at 1300◦ C. (a) x = 0.005,
(b) 0.1 (c) 0.25, (d) 0.3, and (e) 0.35.
FIG. 8: PL spectra of the Al2−x Crx O3 samples with different
mole fractions x, heat-treated at 900◦ C, excited by 556 nm
wavelength. (a) x = 0.005, (b) 0.01, (c) 0.05, (d) 0.1, (e) 0.15,
and (f) 0.2.
temperature, with increasing the mole fraction x, the position of the diffraction peaks shifted towards the hightheta side, which is associated with a increase in the dhkl
and the lattice constants. The values of dhkl and the lattice constants of the samples calculated from the XRD
patterns are shown in Table II.
The PL spectra of the Al2−x Crx O3 samples with x =
0.005, heat-treated at 650-900◦ C, excited by 556 nm wavelength are shown in Fig. 7. The results showed that
the PL spectra of the γ-Al2 O3 nanocrystalline samples
with size 6-7 nm consist of a broad asymmetric peak
with the maximum at 691 nm (noted by R-line). The
position of the peak at 691 nm indicates that the broad
band belong to the non-uniformly broadened 2 E(2 G)→
4
A2 (4 F) transitions in the Cr3+ ions. The extended longwavelength structure of the non-uniformly broadened Rline is assigned to a vibronic tail of the pure electronic
2
E(2 G)→4 A2 (4 F) transitions [4].
Figure 8 shows the PL spectra of the Al2−x Crx O3 samples with different mole fractions x and undergone a heattreatment at 900◦ C, excited by 556 nm wavelength. It is
seen from Fig. 8, with increasing the mole fraction x,
the emission bands are broadened and shifted towards
the long-wavelength side. As can be seen from table 1,
with increasing the mole fraction x, the lattice constants
of the γ-Al2 O3 nanocrystals slightly increase, which is associated with a decrease in the ligand field located of the
(J-Stage: />
533
Loan, et al.
Volume 9 (2011)
TABLE II: The dependence of the dhkl and lattice constants on the mole fraction x with different heat-treatment temperatures.
x
0.005
0.1
0.25
0.3
0.35
d012 (˚
A)
3.500
3.504
3.506
3.509
T = 1000 ◦ C
d104 (˚
A)
a = b (˚
A)
2.563
4.15
2.566
4.15
2.566
4.16
2.569
4.16
˚)
c (A
13.04
13.05
13.05
13.06
FIG. 9: PL spectrum of the Al2−x Crx O3 samples with x =
0.005, heat-treated at 1300◦ C, excited by 556 nm wavelength.
d012 (˚
A)
3.488
3.492
3.499
3.505
3.512
T = 1300 ◦ C
d104 (˚
A)
a = b (˚
A)
2.554
4.13
2.558
4.14
2.565
4.14
2.566
4.16
2.572
4.16
heat-treated at 1300◦ C consists of two strong lines at
691.6 and 693.2 nm and weakly lines at 659, 699, 674,
678, 700, 706, 712, and 725 nm. Two lines at 691.6 (noted
by R1 -line) and 693.2 nm (R2 -line) are well-known due to
the E(2 E(2 G)) → 4 A2 (4 F) and 2A(2 E(2 G)) → 4 A2 (4 F)
transitions within the Cr3+ ions in the α-Al2 O3 octahedral crystal field, respectively [4–6]. Figure 10 shows the
PLE spectra of the Al2−x Crx O3 samples with x = 0.005,
heat-treated at 1300◦ C, recorded at all the emission peaks
shown in Fig. 9. As seen from the Fig. 10, the PLE spectra of sample did not depend on the recorded wavelengths.
This result shows that the lines at 659, 699, 674, 678, 700,
706, 712, and 725 nm are phonon-sidebands of the lines R1
and R2 . The PLE spectra consist of two strong broad absorption bands with peak positions at around 399 and 556
nm, corresponding to spin-allowed 4 A2 (4 F) → 4 T1 (4 P)
and 4 A2 (4 F) → 4 T2 (4 F) transitions of the Cr3+ ions on
the octahedral sites of α-Al2 O3 [5, 6]. Beside, a weak
sharp peak at 692 nm corresponding to the transitions
from the basic level 4 A2 (4 F) to the lowest excited level
2
E(2 G), is also observed.
IV.
FIG. 10: PLE spectra of the Al2−x Crx O3 samples with x =
0.005, heat-treated at 1300◦ C, recorded at all the emission
peaks shown in Fig. 9
Cr3+ ions. Therefore, the broad emission bands may be
due to the 4 T2 (4 F) → 4 A2 (4 F) transitions. In addition, a
large quantity of hanging bonds and defects also exist in
these nanosized imperfect crystals, in particular, for the
samples with high dopant contents, which further leads
to the broadening towards the long-wavelength side of the
emission band related to the Cr3+ ions.
The PL spectra of the Al2−x Crx O3 samples with x =
0.005, undergone a heat-treatment at 1300◦ C, and excited
by 556 nm wavelength are shown in Fig. 9. Unlike the
samples with x = 0.005, heat-treated at 650-900◦ C, the
PL spectrum of the Al2−x Crx O3 samples with x = 0.005,
534
c (˚
A)
12.99
13.03
13.06
13.05
13.09
CONCLUSION
The effect of dopant concentration and heat-treating
temperature on the structural and optical properties of
the synthesized samples has been studied. The results
showed that the structure, the size and the optical properties of the Al2−x Crx O3 crystallites strongly depended
on the mole fraction x and the heating temperature. At
low heating temperatures, the samples with the low mole
fraction x exhibit the γ-Al2 O3 phase and the emission
spectra consist of a broad asymmetric peak with the maximum at 691 nm corresponding to the 2 E(2 G) → 4 A2 (4 F)
transitions within the Cr3+ ions in the octahedral sites
of the γ-Al2 O3 and a vibronic tail of the pure electronic
2
E(2 G) → 4 A2 (4 F) transitions. With the high mole fraction x, the synthesized samples consist of the α-Al2 O3
and Cr2 O3 phases. By increasing the mole fraction x,
the emission bands, which originate from the 4 T2 (4 F) →
4
A2 (4 F) transitions within the Cr3+ ions in the octahedral sites of the γ-Al2 O3 phase, are broadened and shifted
towards the long-wavelength side. At high heating temperatures, all the synthesized samples are α-Al2 O3 single
phase and the emission spectra consist of mainly lines at
691.6 and 693.2 nm corresponding to the E(2 E(2 G)) →
4
A2 (4 F) and 2A(2 E(2 G)) → 4 A2 (4 F) transitions of the
Cr3+ ions in the α-Al2 O3 octahedral crystal field.
(J-Stage: />
e-Journal of Surface Science and Nanotechnology
[1] T. Dellwig, G. Rupprechter, G. Unterhalt, and H. J. Freund, J. Phys. Rev. Lett. 85, 776 (2000).
[2] N. P. Padture, M. Gell, and E. H. Jordan, Science 296,
280 (2002).
[3] T. H. Maiman, Nature 187, 493 (1960).
[4] S. V. Bulyarskii, A. E. Kozhevin, S. N. Mikov, and V. V.
Volume 9 (2011)
Prikhodko, Phys. Stat. Sol. (a) 180, 555 (2000).
[5] B. Cheng, S. Qu, H. Zhou, and Z. Wang, J. Phys. Chem.
B 110, 15749 (2006).
[6] M. Milos, S. Kairouuani, S. Rabaste, and A. Hauser, Coord. Chem. Rev. 252, 2540 (2008).
(J-Stage: />
535