DSpace at VNU: A comparative study on the corrosion behavior of porous and dense NiTi shape memory alloys in NaCl solution
Bạn đang xem bản rút gọn của tài liệu. Xem và tải ngay bản đầy đủ của tài liệu tại đây (1.94 MB, 8 trang )
Electrochimica Acta 56 (2011) 6389–6396
Contents lists available at ScienceDirect
Electrochimica Acta
journal homepage: www.elsevier.com/locate/electacta
A comparative study on the corrosion behavior of porous and dense NiTi shape
memory alloys in NaCl solution
X.T. Sun a , Z.X. Kang b , X.L. Zhang c , H.J. Jiang a , R.F. Guan a , X.P. Zhang a,∗
a
b
c
School of Materials Science and Engineering, South China University of Technology, Guangzhou 510640, China
School of Mechanical and Automotive Engineering, South China University of Technology, Guangzhou 510640, China
MEMS Center, Harbin Institute of Technology, Harbin 150001, China
a r t i c l e
i n f o
Article history:
Received 12 October 2010
Received in revised form 4 May 2011
Accepted 6 May 2011
Available online 13 May 2011
Keywords:
Porous NiTi alloy
Porous electrode
Corrosion behavior
Potential distribution
Interconnectivity
a b s t r a c t
The corrosion behaviors of porous and dense NiTi shape memory alloys with the same nominal composition were investigated in a 0.9% aqueous NaCl solution using electrochemical methods. The study
clarified the role of the porous structure in influencing the corrosion behavior of the porous NiTi alloys,
which exhibited porosity values ranging from 35.5% to 63.8%. The results indicated that the porous NiTi
alloy was more susceptible to localized corrosion than was the dense NiTi alloy. However, the porous
NiTi alloy sample with a higher porosity did not suffer more serious corrosion than the one with a lower
porosity. Furthermore, the potential distribution exists on the pore wall of the porous NiTi alloys as a
result of current flow within the pore electrolyte. Thus, the role of potential distribution inside the pore
and porous structure in the corrosion behavior of the porous NiTi alloys is an important factor.
© 2011 Elsevier Ltd. All rights reserved.
1. Introduction
In recent decades, porous NiTi shape memory alloys have drawn
a great deal of attention as one of the promising biomaterials for
orthopedic implants and hard-tissue replacements because of the
combined virtue of the shape memory effect, superelasticity and
adjustable mechanical properties, in particular the tailored pore
structure of promoting tissue in-growth [1,2].
However, the high nickel content of the NiTi alloys might result
in potentially negative effects on the surrounding tissue by inducing allergic responses [3,4]. It has been reported that Ni ions
released due to the corrosion process can maintain high levels for
up to 8 weeks or even for several months [5,6]. In particular, compared with conventional dense NiTi alloys, the complex interface
structure and larger exposed surface areas of porous NiTi alloys
pose a more serious issue with regard to leaching of Ni [7–10],
which indicates the need for a better understanding of the corrosion
behavior of porous NiTi alloys.
The corrosion of metal implants in the human body is primarily
driven by electrochemical reactions. Consequently, electrochemical tests have been used to evaluate the corrosion resistance of
NiTi alloys [7–13]. In contrast with the dense electrode, the porous
electrode generally suffers from non-uniform potential distribu-
∗ Corresponding author. Tel.: +86 20 22236396; fax: +86 20 22236393.
E-mail address: (X.P. Zhang).
0013-4686/$ – see front matter © 2011 Elsevier Ltd. All rights reserved.
doi:10.1016/j.electacta.2011.05.019
tion because of the ohmic potential drop and the concentration
decay of the electroactive species [14–20]. It is known that the role
of potential distribution inside cavities or recesses in a metal surface is quite important to its crevice corrosion and pitting corrosion
behavior, since the potential distribution has a strong effect on the
distribution of cathodic and anodic reactions at various distances
into the cavity or recess [21,22]. Thus, the electrode potential distribution should be an important consideration in understanding
the electrochemical corrosion behavior of porous NiTi alloy.
Furthermore, the electrochemical reaction is essentially a heterogeneous electron transfer reaction occurring at a solid-liquid
interface. The three-dimensional nature of the porous NiTi alloys
significantly increases the interfacial structure complexity. A previous study [23] has shown that the sintered porous titanium with a
higher porosity ratio undergoes more corrosion than does a sample
with a low porosity because of the larger real surface area. However,
the unsintered sample (i.e., the green sample of cold compacted
titanium powder) with a higher porosity ratio (produced under low
compaction pressure) experienced less corrosion than the one with
a low porosity (produced under high compaction pressure). The
discrepancy was related to the pore characteristics of the porous
titanium.
Currently, there are many published results on the corrosion
behavior of dense NiTi alloys [7–11], while only very limited studies
have been published on the corrosion characteristics of porous NiTi
alloys. In a previous study, porous NiTi alloys were determined to be
less corrosion resistant than the dense NiTi alloys [24]. Additionally,
6390
X.T. Sun et al. / Electrochimica Acta 56 (2011) 6389–6396
Fig. 1. Optical macrograph of the cylindrical porous NiTi alloy sample.
the corrosion resistance of porous NiTi alloys decreased when the
porosity of the alloy increased from 50.2% to 60.4%.
The present study aimed to clarify the influences of the electrode
potential distribution within the pore and the pore characteristics on the corrosion behavior of the porous NiTi alloys during
electrochemical tests; this was accomplished through a systematic comparison of the corrosion characteristics of the porous and
dense NiTi alloys. Both the porous NiTi alloy samples with porosity ranging from 35.5% to 63.8% and the dense NiTi alloy samples
having the same nominal atomic composition as the porous samples were prepared, and their corrosion characteristics in a 0.9%
aqueous NaCl solution at 37 ◦ C were investigated.
2. Experimental
2.1. Preparation of porous and dense NiTi alloy samples
The porous NiTi alloy samples were fabricated by a pore-forming
technique and powder metallurgy method using a high-purity
ammonium bicarbonate (NH4 HCO3 ) powder and a blend of elemental titanium and nickel powders with a nominal atomic ratio
of 50.8 at.% Ni to 49.2 at.% Ti [25–27]. The pore characteristics and
porosity ratios of the NiTi alloy samples were tailored by adjusting
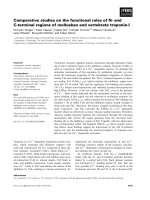
the amount of NH4 HCO3 powder added to the samples. Fig. 1 shows
an optical macrograph of the porous NiTi alloy sample. Dimensions of the cylindrical samples are 14–15 mm in diameter and
10–20 mm in height. There were four types of samples with porosity ratios of 35.5%, 44.9%, 55.8% and 63.8%, respectively, and had
average pore sizes of approximately 100–200 m.
The general porosity of the porous NiTi alloy samples, P, can be
calculated by the following equation:
P(%) =
1−
m
0V
× 100
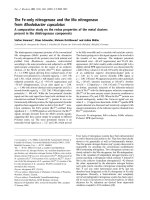
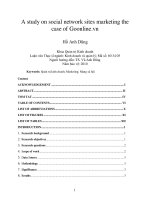
Fig. 2. A schematic diagram of porous and dense NiTi alloy samples for electrochemical tests.
vacuum arc-melting furnace with the protection of argon under
normal pressure. Finally, the molten sample was furnace-cooled
and a dense NiTi alloy ingot (nearly a hemi-sphere, with a base
diameter of 18 mm and a height of 6 mm) was obtained for followup studies.
2.2. Sample preparation for corrosion testing
The corrosion may have occurred throughout the thickness of
the porous alloy. To accurately characterize the corrosion, both
sides of the sample were examined as the test surface. A dense
NiTi alloy rod (2.0 mm diameter) was used as the connect electrode, which was directly screwed into the threaded blind hole
on the cylindrical side of the test sample, as shown in Fig. 2. The
severe wear and deformation produced a pore-free tapped hole.
Therefore, the electrolyte was hardly in contact with the screwed
rod. The edges of the working electrodes were not covered by the
non-conducting resin because the resin could penetrate the porous
samples with different porosities.
The disc-shaped porous NiTi alloy samples with a diameter of
15 mm and a thickness of 3 mm were cut from the porous NiTi alloy
rods (as-fabricated) and the dense NiTi alloy ingots by electrical
discharge machining.
The exposed surfaces of both the porous and dense NiTi alloy
samples were well polished. The samples were then degreased with
acetone in an ultrasonic cleaner for 20 min, followed by rinsing in
distilled water. Finally, the dense NiTi samples were dried in air
at room temperature; the porous samples were placed in a drying
oven at a constant temperature of 80 ◦ C for 4 h.
(1)
where m and V are the mass and volume of the porous samples,
respectively, and 0 is the theoretical density of NiTi alloy (i.e.,
6.45 g/cm3 for the bulk near-equiatomic NiTi alloy).
For a comparative study, the dense NiTi alloy was prepared in
a non-consumable vacuum arc-melting furnace. In the preparation
process, the elemental titanium and nickel powders, with the same
nominal composition as the porous sample (i.e., Ni 50.8 at.% – Ti
49.2 at.%), were blended and cold pressed into green compacts with
a geometry of 15 × 10 (diameter × length, mm). The green sample
was first smelted and then remelted five times in a non-consumable
2.3. Electrochemical test procedure
Electrochemical measurements were performed using a Zahner
(model IM6ex) potentiostat, according to the ASTM G5 [28]; the
standard three-electrode system was adopted. The working electrode was a porous or dense NiTi alloy sample with both sides
exposed to the solution. The reference electrode was a saturated
calomel electrode (SCE), which was connected to the working
electrode via a Luggin capillary, and double symmetrical graphite
electrodes were used as counter electrodes. The test electrolyte
was 0.9 wt.% NaCl (analytical reagent) in de-ionized water. Prior
X.T. Sun et al. / Electrochimica Acta 56 (2011) 6389–6396
6391
Fig. 3. Evolution of open circuit potential over time for dense and porous NiTi alloys
in a 0.9% NaCl solution.
to immersion of the electrodes, the electrolyte cell was heated to a
constant temperature of 37 ◦ C using a water bath.
The potentiodynamic polarization tests and electrochemical
impedance spectroscopy (EIS) were performed 24 h after immersion at open circuit. Potentiodynamic curves were measured by
scanning the potential from −0.4 V below the open circuit potential
to +1.0 V at a scan rate of 0.02 mV/s. Each electrochemical experiment was repeated three times with a fresh specimen for each
test. The corrosion potential and the corrosion current density were
obtained through Tafel approximation. The EIS measurements were
obtained using a polarization of ±10 mV in the frequency range of
100 kHz to 1 mHz and 6 points measuring per decade. EIS spectra
were interpreted by the software ZSimpWin 3.10.
2.4. Morphology of porous NiTi alloy samples
The pore features of the fabricated NiTi alloy samples were characterized by an optical microscope (Leica, DM2500P) and via digital
image analysis. The surface morphologies of the porous NiTi samples were examined before and after the electrochemical tests using
a scanning electron microscopy (SEM Quanta 200, FEI).
3. Results
3.1. Open circuit potential measurement
The open circuit potentials (OCP) of dense and porous NiTi alloys
in 0.9% NaCl solution were measured over a period of 24 h. Fig. 3
presents the evolution of the OCP as a function of time, where it is
obvious the OCP of porous NiTi alloys experienced a sharper rate of
change compared to the dense NiTi alloys. In all cases, the porous
NiTi alloys exhibited a more positive OCP than did the dense NiTi
alloys.
3.2. Potentiodynamic polarization measurements
The corresponding changes in the behavior of the potentiodynamic polarization of the NiTi alloys with the structure variation
from dense to porous are shown in Fig. 4a, and presentation of the
extracted electrochemical parameters are shown in Fig. 4b. Both
the dense and porous NiTi alloys exhibited a typical passive region
and were pitting attacked at the chemical breakdown potential,
where the current density sharply increased. The corrosion current
densities of the dense and porous NiTi alloys seen in Fig. 4b are cal-
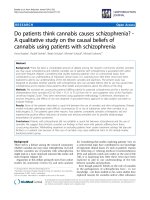
Fig. 4. (a) Polarization curves of porous and dense NiTi alloy samples after immersing in a 0.9% NaCl solution for 24 h and (b) evolutions of extracted electrochemical
parameters from polarization curves with porosity ratio.
culated from the geometrical area for comparison (i.e. the apparent
area, not necessarily the real area). The values suggested that the
current densities (icorr ) of porous NiTi alloys were markedly higher
than the icorr values of the dense ones, and the breakdown potentials (Eb ) of porous NiTi alloys were clearly lower than the Eb values
of the dense samples. However, it was worth noting that the corrosion potentials (Ecorr ) of porous NiTi alloys exhibited a positive
shift by more than 200 mV from the Ecorr value of the dense NiTi
alloy.
The typical surface morphologies of the porous NiTi alloy samples polarized to a potential of 1.0 V from −1.0 V were examined
by SEM, as shown in Fig. 5. It was shown that the observed pitting
primarily existed on the edge of the porous NiTi alloy samples, as
indicated by the white arrows in Figs. 5(b), (d) and (f). The edge
attack may have been related to a combination of geometry and
metallurgical conditions (e.g., inclusion stringers [26,27]), which
can complicate the test results. However, it was likely that the
uncertainties in the sample geometry and metallurgical conditions
were consistent across the samples and, hence, conclusions based
on the comparisons between the damage at the edges should still
be valid. In the repeated tests, the observed damage of the edge was
reproducible.
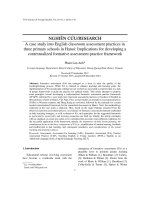
In particular, the characteristics of the surface morphologies did
not show an obvious tendency of deterioration of corrosion resistance with an increase in the porosity ratio. As shown in Figs. 5(g)
and (h), compared with the samples with the porosity of 35.5% and
6392
X.T. Sun et al. / Electrochimica Acta 56 (2011) 6389–6396
Fig. 5. Typical SEM surface morphologies of the edge region of disc-shaped porous NiTi alloy samples with different porosity ratios before (a, c, e and g) and after (b, d, f and
h) potentiodynamic polarization measurement in a 0.9% NaCl solution, terminated at 0.8 V: (a and b) 35.5%; (c and d) 43.9%; (e and f) 55.8%; and (g and h) 63.8%.
X.T. Sun et al. / Electrochimica Acta 56 (2011) 6389–6396
6393
Fig. 6. Bode spectra for porous and dense NiTi alloys: (a) impedance modulus plot;
and (b) phase angle plot.
43.9%, it was difficult to distinguish the morphologies of the sample
with the porosity of 63.8% before and after the polarization test.
3.3. Electrochemical impedance spectroscopy
Impedance spectra for porous and dense NiTi alloy samples after
immersion in a 0.9% NaCl solution at 37 ◦ C for 24 h are presented as
Bode plots (Fig. 6), where both porous and dense NiTi alloy samples
exhibited similar spectral features. A capacitive behavior, which is
represented by the phase angle approaching −90◦ and typical of in
passive materials [7,29], appeared in a medium to low frequency
range, Fig. 6(b). This meant that a passive film had formed on all
samples in the electrolyte, which was consistent with the passive
region determined in the polarization tests (Fig. 4a).
The large phase angle peak could be indicative of the interaction
of at least two time constants. Therefore, an equivalent circuit was
proposed to model the EIS data obtained from both the porous and
dense NiTi alloys, as shown Fig. 7a. This model was widely accepted
for Ti and Ti-rich alloys on which a passive film with a double-layer
structure was formed [7,29,30]. In the model, Rs is the resistance
of the solution, Rp is the additional resistance of the solution inside
the pores, Rb is the charge transfer resistance of the barrier layer,
Fig. 7. (a) Equivalent circuits used for fitting the experimental data and (b and c)
experimental results and simulated data for the porous NiTi alloy with a porosity of 63.8% and dense NiTi alloy after immersion in a 0.9% NaCl solution for 24 h,
respectively.
Qp is the capacitance of the pore wall and Qb is the capacitance of
the barrier layer. Here, Q is the magnitude of the constant-phase
element (CPE), representing a deviation from the ideal capacitor,
n −1
the impedance of which is defined as ZCPE = Y0 (jw)
, where
−1 ≤ n ≤1. The value of n is associated with the non-uniform distribution of current as a result of roughness and surface defects. This
was the case for the results presented in this study, where the n
values of the porous NiTi alloy samples ranged from 0.81 to 0.87,
while the dense NiTi alloy samples was approximately 0.94.
The resistance, capacitance and n values from measurements
upon the NiTi alloys, extracted using equivalent circuit illustrated
in Fig. 7(a), are tabulated in Table 1. The impedance results were
6394
X.T. Sun et al. / Electrochimica Acta 56 (2011) 6389–6396
Table 1
Electrical parameters of the equivalent circuits by fitting the experimental results of EIS.
Samples
Cp (F cm−2 )
np
Rp (k
cm−2 )
Cdl (F cm−2 )
nb
Rb (k
cm−2 )
2
P = 35.5%
P = 43.9%
P = 55.8%
P = 63.8%
279(82) (16.4 )
202(75) (26.2)
208(64) (14.7)
263(88) (23.4)
0.84(0.22)
0.87(0.24)
0.86(0.26)
0.81(0.30)
17(12)
24(22)
25(18)
32(27)
240(62)
119(45) (13.5)
110(57) (21.7)
205(89) (33.2)
0.28(0.15)
0.59(0.18)
0.59(0.17)
0.82(0.14)
29(21)
56(37)
51(40)
41(32)
8 × 10⁻⁴
4 × 10⁻⁴
7 × 10⁻⁴
8 × 10⁻⁴
Dense NiTi
3.3(0.9)
0.81(0.05)
1.9(0.6) × 10−3
13.2(7.4) (16.8)
0.96(0.1)
5.3(3.4) × 104
2 × 10⁻⁴
*
*
Mean values, with sample standard deviations in parentheses.
interpreted using the ZsimpWin software, and the respective fittings were evaluated by a Chi-squared value, 2 . The experimental
and simulation data by the equivalent circuit are shown in Fig. 7(b)
and (c). The Chi-square (2 ) value between 10−4 and 10−5 indicated
good agreement between the experimental and simulated data for
both the dense and porous NiTi alloy samples.
4. Discussion
varied in size from 2 m to 200 m. Parts of the pores were nearly
circular and other parts of pores exhibited irregular shapes. Moreover, some small pores existed in the walls of the bigger pores, as
manifested by the interconnection between these pores; thus, the
inner walls of the pores were generally unsmooth. These features
accounted for what may also be vulnerable sites and imperfections
in any passive films, which is consistent with the EIS results (The
resistance value Rb of porous NiTi alloy is three orders of magnitude
lower than that of dense NiTi alloy.)
4.1. Effect of porous structure on the corrosion resistance of
porous NiTi alloy
The corrosion current density of the porous NiTi alloy samples were about two orders of magnitude higher compared to the
dense samples. The correspondingly smaller passive window for
the porous NiTi alloy is also clearly seen in the polarization curves.
As such the porous NiTi alloy was qualitatively more susceptible
to pitting corrosion than the dense NiTi alloy. This is to a certain
extent expected from the larger ‘real’ surface area. Moreover, it is
known that corrosion resistance of the NiTi alloy is associated with
the formation of the resistant titanium oxide films on the alloy’s
surface [7,31].
The surface-finish quality, the amount of the residues left on the
surface and the microstructures inhomogeneity of the porous NiTi
alloy were the critical factors that affected the formation and quality of the oxide films. These factors were strongly influenced by the
preparation process of the alloy. However, the preparation of the
porous NiTi alloys generally consisted of complex thermomechanical processes. Fig. 8 shows the SEM photographs of pore structure
for porous NiTi alloy with the porosity ratio of 55.8%. The pores
Fig. 8. SEM image of pore morphology for porous NiTi alloy formed by the poreforming technique.
4.2. Effect of porosity ratio on the corrosion behavior of porous
NiTi alloys
The changes in electrochemical parameters obtained from the
polarization curves and impedance results of the porous NiTi alloys
with increasing porosity ratio are summarized in Table 1 and
abridged into Fig. 4b. It was difficult to identify a trend in these
parameters with varying porosity ratio. In fact, the real surface area
of the porous NiTi alloys generally increases with increasing porosity ratio within certain limits; however, the surface quality and
structure uniformity of the porous NiTi alloys does not necessarily
get worse with the porosity increasing.
Fig. 9 shows the optical micrographs for the polished porous NiTi
alloy samples with different porosity ratios. Clearly, there were two
types of pores. The large pores with sizes of 100–200 m are primarily formed by the decomposition of the space-holder, NH4 HCO3
particles [26,27]. The small pores (also called secondary pores) with
sizes below 10 m could be attributed to the trapped residuals of
NH4 HCO3 decomposition and the non-metallic impurities existing
in the raw powders, as well as the volume shrinkage and the Kirkendall diffusion between Ni and Ti atoms. The small pores showed a
better size-uniformity and a more uniform distribution than did the
large ones. When the porosity ratio increased, the interconnectivity
of larger pores was clearly increased.
For the samples with a lower porosity, the majority of the pores
were the isolated secondary pores (see Fig. 9a), which is unlikely
to have trapped appreciable volumes of solution. This caused
the samples relative resistant to induced pitting corrosion. When
the porosity ratio increased, the interconnectivity of the larger
pores had been markedly improved. The interconnected channels
allowed the free flow of the liquid and fewer sites were available
to induce pitting corrosion. When the porosity ratio reached 63.8%,
the pore morphology was dominated by wider and more highly
interconnected pore structures (Fig. 9d). As shown in Fig. 5(g) and
(h), there was no visible damage on the edge of the sample.
Furthermore, with the change of porosity ratio, pore size, pore
size distribution and pore shape of the porous NiTi alloys change
correspondingly. It was difficult to provide a complete characterization of the pores by solely measuring the sample porosity. This
also accounted for no obvious trend in the corrosion behavior with
the single factor change.
X.T. Sun et al. / Electrochimica Acta 56 (2011) 6389–6396
6395
Fig. 9. Optical micrographs of porous NiTi alloy samples with different porosity ratios: (a) 35.5%; (b) 43.9%; (c) 55.8%; and (d) 63.8%.
4.3. Effect of potential distribution on the corrosion behavior of
porous NiTi alloys
5. Conclusions
From the EIS results, the Rp value of porous NiTi alloys was four
orders of magnitude higher comparing to the dense NiTi alloys.
This can prove that the typical potential distribution exists on the
internal pore surface as a result of current flow within the pore
electrolyte [22,32]. The typical potential distribution follows that
x
E(x) = E(0) −
I(x) R(x) dx
(2)
0
where E(x) is the electrode potential at a distance x into the pore, E(0)
is the potential at the pore opening, and I(x) and R(x) are the magnitudes respectively of the current flowing at a distance x through the
pore electrolyte and of the resistance of the electrolytic path within
the pore [32,33]. Since the electrode potential varies with distance
x into the pore, the rate of metal dissolution also varies over the
internal pore surface in accord with the polarization behavior of
the metal under the local electrochemical conditions.
In the active region of anodic polarization, E(x) became less noble
with increasing distance into the internal pore, and thus the rate of
the NiTi alloy dissolution reaction decreased with increasing distance x. This explains the discrepancy that the porous NiTi alloys
with the poor protective oxide films exhibited much nobler corrosion potential than the dense NiTi alloys. In the passive region of
the anodic polarization, with the external surface inside the pore
polarized into the passive region, E(x) decreased with increasing distance x and may be still in the active region, which depends on the
dimensions of the pore and the electrochemical conditions prevailing at the whole porous structure of porous NiTi alloy electrode [33].
Thus, the potential distribution is playing a role that strengthens the
differences among the different parts of the porous metal surface.
This is the essential electrochemical condition that results in the
localized metal corrosion. Therefore, the role of potential distribution inside the pore and porous structure in the electrochemical
corrosion behavior of the porous NiTi alloys is an important factor.
From the potentiodynamic polarization and EIS results, it was
concluded that the porous NiTi alloy was more susceptible to localized corrosion than was the dense NiTi alloy. However, the porous
NiTi alloy sample with a higher porosity did not suffer obviously
more corrosion than the one with a lower porosity.
The potential distribution should exist on the pore wall as a
result of current flow within the pore electrolyte during the electrochemical tests. Therefore, the role of potential distribution in the
electrochemical corrosion behavior of the porous NiTi alloys is an
important factor, since the non-uniform potential distribution can
strengthen the differences among the different parts of the porous
metal surface.
Acknowledgements
This research was supported by the National Natural Science
Foundation of China (Nos. 50871039 and 51001050), China Postdoctoral Science Foundation (20100470917) and the Fundamental
Research Funds for the Central Universities allocated in South China
University of Technology (No. 2009ZM0160).
References
[1] A. Bansiddhi, T.D. Sargeant, S.I. Stupp, D.C. Dunand, Acta Biomaterialia 4 (2008)
773.
[2] A.C. Jones, C.H. Arns, D.W. Hutmacher, B.K. Milthorpe, A.P. Sheppard, M.A.
Knackstedt, Biomaterials 30 (2009) 1440.
[3] D.J. Wever, A.G. Veldhuizen, M.M. Sanders, J.M. Schakenraad, J.R. Horn, Biomaterials 18 (1997) 1115.
[4] M. Es-Souni, M. Es-Souni, H. Fischer-Brandies, Analytical and Bioanalytical
Chemistry 381 (2005) 557.
[5] H.H. Huang, Y.H. Chiu, T.H. Lee, S.C. Wu, H.W. Yang, K.H. Su, C.C. Hsu, Biomaterials 24 (2003) 3585.
[6] M. Cioffi, D. Gilliland, G. Ceccone, R. Chiesa, A. Cigada, Acta Biomaterialia 1
(2005) 717.
[7] N. Figueira, T.M. Silva, M.J. Carmezim, J.C.S. Fernandes, Electrochimica Acta 54
(2009) 921.
[8] X.J. Li, J.Q. Wang, E.H. Han, W. Ke, Acta Biomaterialia 3 (2007) 807.
6396
X.T. Sun et al. / Electrochimica Acta 56 (2011) 6389–6396
[9] F.T. Cheng, K.H. Lo, H.C. Man, Journal of Alloys and Compounds 437 (2007) 322.
[10] G. Rondelli, Biomaterials 17 (1996) 2003.
[11] R.Q. Hang, S.L. Ma, V. Ji, Chu.F P.K., Electrochimica Acta (2010) 061,
doi:10.1016/j.electacta.2010.04.
[12] P. Rocher, L.E. Medawar, J.C. Hornez, M. Traisnel, J. Breme, H.F. Hildebrand,
Scripta Materialia 50 (2004) 255.
[13] D.J. Wever, A.G. Veldhuizen, J. Vries, H.J. Busscher, D.R.A. Uges, J.R. Horn, Biomaterials 19 (1998) 761.
[14] T. Doherty, J.G. Sunderland, E.P.L. Roberts, D.J. Pickett, Electrochimica Acta 41
(1996) 519.
[15] S.E. Like, S.H. Langer, Journal of Electrochemical Society 138 (1991) 2327.
[16] M.R.V. Lanza, R. Bertazzoli, Journal of Applied Electrochemistry 30 (2000) 61.
[17] R.E. Sioda, Electrochimica Acta 16 (1971) 1569.
[18] D.N. Bennion, J. Newman, Journal of Applied Electrochemistry 2 (1972)
113.
[19] R.C. Burshtein, V.S. Markin, A.G. Pshenichnikov, V.A. Chismadgev, Y.G. Chirkov,
Electrochimica Acta 9 (1964) 773.
[20] E. Bosco, Journal of Electroanalytical Chemistry 366 (1994) 43.
[21] H.W. Pickering, Corrosion Science 29 (1989) 325.
[22] B.G. Ateya, H.W. Pickering, Corrosion Science 37 (1995) 1443.
[23] K.H.W. Seah, R. Thampuran, X. Chen, S.H. Teoh, Corrosion Science 37 (1995)
1333.
[24] Y.H. Li, G.B. Rao, L.J. Rong, Y.Y. Li, Materials Letters 57 (2002) 448.
[25] Y.P. Zhang, D.S. Li, X.P. Zhang, Scripta Materialia 57 (2007) 1020.
[26] D.S. Li, Y.P. Zhang, G. Eggeler, X.P. Zhang, Journal of Alloys and Compounds 470
(2009) L1.
[27] D.S. Li, Y.P. Zhang, X. Ma, X.P. Zhang, Journal of Alloys and Compounds 474
(2009) L1.
[28] ASTM Standard G 5-94 Standard Reference Test Method for Making Potentiostatic and Potentiodynamic Anodic Polarization Measurements. Annual Book
of ASTM Standards, vol. 03.02, American Society for Testing and Materials,
Philadelphia, PA, 1994, p. 48.
[29] S.L. Assis, S. Wolynec, I. Costa, Electrochimica Acta 51 (2006) 1815.
[30] J.E.G. Gonzaˇılez, J.C. Mirza-Rosca, Journal of Electroanalytical Chemistry 471
(1999) 109.
[31] G. Rondelli, B. Vicentini, Biomaterials 20 (8) (1999) 785.
[32] B.G. Ateya, H.W. Pickering, Corrosion Science 38 (1996) 1245.
[33] A.M. Al-Zahrani, H.W. Pickering, Electrochimica Acta 50 (2005) 3420.