DSpace at VNU: Luminescence, energy transfer, and upconversion mechanisms of Y(2)O(3) nanomaterials doped with Eu(3+), Tb(3+), Tm(3+), Er(3+), and Yb(3+) ions
Bạn đang xem bản rút gọn của tài liệu. Xem và tải ngay bản đầy đủ của tài liệu tại đây (1.67 MB, 10 trang )
Hindawi Publishing Corporation
Journal of Nanomaterials
Volume 2007, Article ID 48247, 10 pages
doi:10.1155/2007/48247
Research Article
Luminescence, Energy Transfer, and Upconversion
Mechanisms of Y2O3 Nanomaterials Doped with
Eu3+, Tb3+, Tm3+, Er3+, and Yb3+ Ions
TranKim Anh,1 Paul Benalloul,2 Charles Barthou,2 Lam thiKieu Giang,1 Nguyen Vu,1 and LeQuoc Minh1, 3
1 Institute
of Materials Science, Vietnamese Academy of Science and Technology, 18 Hoang Quoc Viet Road, Cau Giay,
Hanoi, Vietnam
2 Institute des Nanosciences de Paris (INSP), UMR-CNRS 7588, Universites Pierre et Marie Curie et Denis Diderot,
140 Rue de Lourmel, Paris 75015, France
3 College of Technology, Vietnam National University, 144 Xuan Thuy Street, Cau Giay District, Hanoi, Vietnam
Received 21 May 2007; Revised 16 December 2007; Accepted 31 December 2007
Recommended by Wieslaw Strek
Luminescence, energy transfer, and upconversion mechanisms of nanophosphors (Y2 O3 : Eu3+ , Tb3+ , Y2 O3 : Tm3+ , Y2 O3 : Er3+ ,
Yb3+ ) both in particle and colloidal forms were studied. The structure, phase, and morphology of the nanopowders and nanocolloidal media were determined by high-resolution TEM and X-ray diffraction. It was shown that the obtained nanoparticles have
a round-spherical shape with average size in the range of 4 to 20 nm. Energy transfer was observed for Y2 O3 : Eu3+ , Tb3+ colloidal
and powders, upconversion transitions were observed for both Y2 O3 : Er3+ and Y2 O3 : Er3+ , Yb3+ nanophosphors. The dependence
of photoluminescence (PL) spectra and decay times on doping concentration has been investigated. The infrared to visible conversion of emission in Y2 O3 : Er3+ , Yb3+ system was analyzed and discussed aiming to be applied in the photonic technology.
Copyright © 2007 TranKim Anh et al. This is an open access article distributed under the Creative Commons Attribution License,
which permits unrestricted use, distribution, and reproduction in any medium, provided the original work is properly cited.
1.
INTRODUCTION
Luminescent nanomaterials in the form of nanoparticles,
nanorods, nanowires, nanotubes, as well as colloidal or bulk
nanocrystals are of interest not only for basic research, but
also for interesting application [1–3]. High surface to volume ratio, local phenomena such as absorption or change
in the surface electronic state may contribute significantly to
special properties. An understanding of luminescent properties, energy transfer (ET), and upconversion could determine
how to tailor nanophores for a given application. Nanomaterials have potential application as efficient display phosphors, such as in new flat panel displays with low-energy
excitation source [2, 3]. Y2 O3 :Eu3+ phosphor, one of the
most promising oxides-based red phosphors, was studied for
a long time because of its efficient luminescence under ultraviolet (UV) and cathode-ray excitation. Y2 O3 :Eu3+ with
micrometer size grains was used as the red component in
three chromatic lamps and projection color television [4–6].
Numerous studies were focused on synthesis and optical
properties of nanosized Y2 O3 :Eu3+ phosphors [7–10]. Sizedependence efficiency in Y2 O3 :Tb3+ [11] and effect of grain
size on wavelength of Y2 O3 :Eu3+ [12] were investigated. Different methods were used to prepare Y2 O3 :RE3+ nanocrystals
[13–19] such as chemical vapor synthesis [15], combustion
[16, 17], sol-gel [18], and aerosol pyrolysis [19]. Relationship between optical properties and crystalline of nanometer Y2 O3 :Eu3+ phosphor has been investigated [20]. The new
method of polyol-mediated synthesis of nanoscale materials was presented [21, 22] and the luminescence properties
of nanocrystalline Y2 O3 :Eu3+ were investigated [23]. Anh
et al. studied the ET between Tb3+ and Eu3+ in Y2 O3 microcrystals [4]. The role of the active center concentrations
in the ET of lanthanide ions was investigated not only for
Y2 O3 :Tb3+ , Eu3+ , but also for organic compound glutamic
acid as well as LnP5 O14 laser crystals [24]. ET and relaxation
processes in Y2 O3 :Eu3+ were studied [25]. Preparation and
optical spectra of trivalent rare earth ions doped cubic Y2 O3
nanocrystal have received our considerable attention over 10
years [10, 16, 26–33]. Not only the Eu3+ -Tb3+ couple, but
also the Er3+ -Yb3+ one are attractive for application in visible
emission by ET and upconversion processes. Among emission properties of Y2 O3 doped with rare earth ions, upconversion is the most attractive phenomenon not only from
2
Journal of Nanomaterials
photophysic mechanism, but also for application. The enhancement of the red emission via upconversion in bulk and
nanocrystalline cubic Y2 O3 :Er3+ has been studied [34]. Red,
green, and blue upconversion luminescences of trivalent rare
earth ion doped Y2 O3 nanocrystals were investigated [35].
Effect of Yb3+ codoping on the upconversion luminescence
properties of Y2 O3 :Yb3+ , Er3+ nanocrystallines and nanostructures have been studied [36–38]. The absorption and
emission spectroscopy of Er3+ -Yb3+ doped aluminum oxide
waveguides were reported [39].
The oxide lattice has proved to be an excellent host material for some of the most powerful laser built. Among
them, Y2 O3 is characterized by low-phonon frequencies
which make inefficient nonradiative relaxation of the excited
states. The Y2 O3 host was chosen due to its high refractory properties with a melting point of about 2450◦ C, a very
high thermal conductivity of 33 W m−1 K−1 , and a density of
5.03 g cm3 . Y2 O3 is a suitable material for photonic waveguide due to its high-energy band gap of 5.8 eV, a high refractive index about 2, and a wide transmission region from
280 nm to 8 micrometer. Eu3+ exhibits an atomic-like transition in red region at 612 nm. Er3+ emissions lie in infrared
around 1530 nm as well as upconversion in visible ranges
of green and red. The blue emission of Tm3+ ions is one of
the three important basic colors of display. However, up to
now, few articles were devoted to Y2 O3 doped with Tm3+ and
codoped with Tb3+ , Eu3+ or Yb3+ , Er3+ in both the nanopowder or nanocolloidal forms.
In this work, we report on new synthesis of Y2 O3
nanophosphor in the two forms of powders and colloidal
doped with Tb3+ , Eu3+ , Tm3+ , Er3+ , and Yb3+ . The concentration dependence and the influence of size on the luminescent properties will be discussed. The investigation of ET
between Tb3+ and Eu3+ , and the mechanism of upconversion
in Y2 O3 :Er3+ , Yb3+ nanosize are of the main points.
2.
EXPERIMENT
The powder nanophosphors Y2 O3 :Eu3+ (1–10 mol%),
Y2 O3 :Er3+ (1–15 mol%) and Y2 O3 :Er3+ (1 mol%), Yb3+
(5%), and Y2 O3 :Tm3+ (1–4 mol%) were prepared by combustion reaction. Europium oxide (99.995%, CERAC),
Yttrium oxide (99.999%, ALFA), and nitric acid and urea
(99%, SIGMA-ALDRICH) were used as starting raw materials to prepare Y2 O3 :Eu3+ . Y(NO3 )3 and RE(NO3 )3 stock
solutions were prepared by dissolving Y2 O3 , Er2 O3 , Yb2 O3 ,
and Eu2 O3 in nitric acid and diluting with deionized water.
The synthesis reaction is [28]
(2 − 2x)Y(NO3 )3 + 2x RE(NO3 )3 + 5(NH2 )2 CO
−→ (Y1−x REx )2 O3 + 5CO2 + 8N2 + 10 H2 O.
(1)
Nanocolloidal samples of Y2 O3 , Y2 O3 :Eu3+ , Tb3+ ,
Y2 O3 :Tm3+ with different Eu3+ concentrations of 1, 3,
5, 7, and 10 mol%, Tb3+ concentration of 1.25 mol%, and
Tm3+ concentrations of 1–4 mol% were prepared by a direct
precipitation route from high-boiling polyol solution [22].
The starting materials were YCl3 , EuCl3 , TbCl3 , TmCl3 ,
NaOH, and diethylene glycol (DEG) with high purity grade.
The samples were checked by the X-ray diffractometer (D5000, Siemens). The morphology and particle sizes
of Y2 O3 :RE3+ were observed by transmission electron microscopy (TEM, H7600, Hitachi), high-resolution transmission electron microscopy HRTEM Philips CM200, 160
KV, and FE-SEM (S4800, Hitachi). Photoluminescent measurements were performed using a Jobin Yvon HR 460
monochromator and a multichannel CCD detector from instruments SA model Spectraview-2D for the visible and near
infrared range and a Triax 320 with a PDA multichannel 256
pixels detector for the IR range. The decay time was analyzed by a PM Hamamatsu R928 and Nicolet 490 scope with
a time constant of the order of 7 nanoseconds. Kimmon HeCd laser (325 nm excitation), Nitrogen laser (337.1 nm), and
Diode laser or Ti-Sapphire laser were used as the excitation
sources.
3.
3.1.
RESULTS AND DISCUSSION
Morphology and structure of nanopowders
and nanocolloidal media
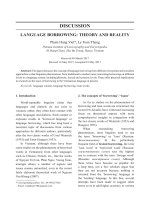
Figure 1 shows TEM and HRTEM images of Y2 O3 nanocolloidal and electron diffraction of Y2 O3 nanoparticles. One
can notice that our samples are spherical shaped, small sized
(5 nm), and with narrow distribution.
The synthesis of useful amounts of sub 5 nm size
lanthanide-doped oxides remains a challenge in optical material research. A few weeks ago, stable colloidal was prepared and has been reported in [22]. For the first time,
nanocolloidal codoped Tb3+ and Eu3+ and oxide particle
suspension were prepared in our laboratory. The transparent suspensions of particles dispersed in organic solvent
were obtained with high stability for a year. The absorption spectra of the colloids have been characterized with
a strong and broad band for Y2 O3 , Y2 O3 :Eu3+ , Y2 O3 :Tb3+ ,
Y2 O3 :Tm3+ , Y2 O3 :Eu3+ , Tb3+ nanoparticles in the long range
from 230 nm to 380 nm with the maxima around 240–
250 nm.
X-ray diffraction of Y2 O3 :RE3+ samples annealed at different temperatures was studied. The pure polycrystalline
Y2 O3 was used as standard sample for the correction of
the instrumental line broadening. The profiles of diffracting peaks were fitted to the ps-voigt1 function. The grain
sizes and size distribution have been determined by the WINCRYSIZE program packet [40]. The column length distribution can be obtained from double differentiation of the
Fourier transform of the line profile [41]. According to this
method, the reflection intensity of the given set of lattice
planes is expressed in terms of a sum of the intensities
from all columns of lattice cells perpendicular to the planes
[42, 43].
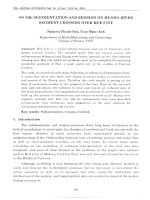
Figure 2 exhibits X-ray diffraction (XRD) patterns of
Y2 O3 :Eu3+ (5%) annealed at 500, 550, 600, 700, and 900◦ C.
The powder annealed at 500◦ C is amorphous. The Y2 O3 cubic phase appears when annealed above 550◦ C.
The main diffraction peaks, in agreement with the JCPDS
41-1105 reference, correspond to the [222], [400], [440], and
[622] planes. However, the widths of the diffraction lines are
TranKim Anh et al.
3
5 nm
50 nm
(a)
(b)
(c)
Figure 1: (a) TEM, (b) HRTEM images of Y2 O3 nanocolloidal, and (c) the corresponding electron diffraction pattern of Y2 O3 nanoparticles.
2000
2θ-sacle
SIEMENS D5000, X-ray lab., Hanoi 10-May-2006 15 : 58
222
(Cps)
440
622
400
411
0
e
d
c
b
a
332
431
521
433 541
26 28 30 32 34 36 38 40 42 44 46 48 50 52 54 56 58
2θ (deg)
Figure 2: (a) XRD diffraction pattern of Y2 O3 :Eu3+ (5 mol%) powders annealed at 500◦ C, (b) 550◦ C, (c) 600◦ C, (d) 700◦ C, and (e)
900◦ C.
broadened because of the small size of the crystallites. Then
they get narrower and narrower at higher temperatures. This
process reflects the fact that the crystalline size is increasing
with temperature of annealing process. The peak profiles of
[222] reflection (in Figure 2, at 2θ = 29.150) were used for
starting data of Warren-Averbach method [41]. This method
was used to study nanocrystalline gold [42]. It was noted that
the results of the average column length usually differ from
crystallite sizes evaluated from Scherer equation [43]. The
main reason is due to the Warren-Averbach method which
provides a volumetric average of the crystallite size. We can
see that the size distributions for small grains <10 nm have
asymmetrical shape with small FWHM (of the size distribution), while for bigger grains they become more symmetrical and their FWHM are larger. The size distribution of
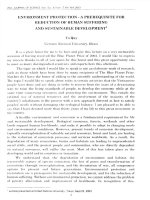
Y2 O3 :Eu3+ (5%) versus annealing temperature and time calculated by Warren-Averbach method is presented in Table 1
and Figure 3.
The XRD of Y2 O3 :Er3+ 10 mol% nanomaterials (annealed at 600◦ C for 30 minutes) also shows a cubic symmetry
like the Y2 O3 reference powder. The FWHM of the diffraction lines for nanomaterials is larger than that of the Y2 O3
crystals. The sizes are about 7 nm and 23.4 nm, respectively,
the FWHM of the size distribution for the nanopowder is
11 nm and 20.1 nm for the sample annealed at 600◦ C for 30
Table 1: Size and FWHM of Y2 O3 :Eu3+ particles versus annealing
temperature and time.
T (◦ C)
550
600
700
900
900
Time (min)
60
30
30
30
60
d (nm)
4.4
5.6
15.2
46.1
72.2
FWHM (nm)
7.3
6.9
9.3
20.6
22.6
minutes and at 800◦ C for 30 minutes, respectively. These data
were also calculated by using the Warren-Averbach method.
For the Y2 O3 :Tm3+ nanophores, the mean sizes of the particle are 7.2, 7.4, and 7.7 nm, respectively, with Tm3+ concentrations of 0.1, 1, and 4 mol%.
3.2.
Luminescent spectra
Size-dependent efficiency was reported in Tb-doped Y2 O3
nanocrystalline phosphor [11]. In Y2 O3 :Tb3+ nanocrystalline, the efficiency varied as the square of the particle size
˚ It could be nonradiative contriranged from 100 to 40 A.
butions decrease with the decrease in particle size. On the
other hand, effects of grain size from 43 nm to 71 nm on
wavelength of Y2 O3 :Eu3+ emission spectra are investigated
in detail [12]. The blue shift effect of emission was observed
very small in Y2 O3 :Eu3+ nanophosphor. In contrast, we could
not find any blue shift change in the luminescent spectra of
Y2 O3 :Eu3+ prepared by combustion reaction.
The photoluminescent (PL) spectra of Y2 O3 :Tb3+
nanocolloidal correspond to the 5 D4 -7 FJ transitions according to the energy diagram and fluorescence processes of Tb3+
[5] (Figure 4(a)).
The PL spectra of Y2 O3 :Eu3+ nanocolloidal with different concentrations (from 1 to 10 mol%) under 337.1 nm N2
laser excitation show narrow emission peaks corresponding
to the 5 D0 -7 FJ (J = 0, 1, 2, 3, 4) transitions of Eu3+ , with the
most intense peak at 611 nm for the case of J = 2. Figure 4(b)
presents the luminescent spectra of Y2 O3 -doped 1, 3, 5, 7,
and 10% Eu3+ nanocolloidal under 337.1 nm N2 laser excitation. The PL spectra of Y2 O3 :Eu3+ nanocolloidal also indicate
Relative frequency
(×102 )
Journal of Nanomaterials
Relative frequency
(×102 )
4
12
9
Y2 O3 :Eu3+
550◦ C, 60 min
6
3
0
10
20
30
40
50
Size (nm)
60
70
80
12
9
Y2 O3 :Eu3+
600◦ C, 30 min
6
3
0
90
10
20
30
12
9
Y2 O3 :Eu3+
700◦ C, 30 min
6
3
0
10
20
30
60
70
80
90
(b)
Relative frequency
(×102 )
Relative frequency
(×102 )
(a)
40
50
Size (nm)
40
50
Size (nm)
60
70
80
12
90
9
Y2 O3 :Eu3+
900◦ C, 30 min
6
3
0
10
20
30
(c)
40
50
Size (nm)
60
70
80
90
(d)
Figure 3: Size distribution calculated by W-A method of Y2 O3 :Eu3+ (5%) powder annealed in 30 minutes at the temperatures of 550◦ C,
600◦ C, 700◦ C, and 900◦ C.
10
5
200
Intensity (a.u.)
Intensity (a.u.)
15
611.5
250
Y2 O3 :Tb (1.25)
λexc = 325 nm
(He-Cd laser)
5 D −7 F
5
4
5 D −7 F
0
2
×103
×103
150
5 D −7 F
0
0
10% Eu
5 D −7 F
0
1
7% Eu
100
5% Eu
5 D −7 F
4
6
5 D −7 F
4
4
3% Eu
50
5 D −7 F
4
3
1% Eu
0
500
550
600
Wavelength (nm)
650
700
(a)
0
580
600
Wavelength (nm)
620
640
(b)
Figure 4: (a) Luminescent spectra of Y2 O3 :Tb3+ nanoparticles excited at 325 nm, (b) luminescent spectra of Y2 O3 doped 1% Eu, 3% Eu, 5%
Eu, 7% Eu, and 10% Eu nanoparticles (from colloidal) excited by N2 laser at 337.1 nm.
that not any quenching of the PL intensity for Eu3+ concentration up to 10 mol%. Y2 O3 presents a cubic structure with
˚ The primitive unit cell contains
lattice constant a = 1.0604 A.
80 atoms (48 O and 32 Y), Y atoms occupy two sites with
the C2 and S6 (C3i ) symmetry site. Our samples of Y2 O3 :Eu3+
nanopowder and nanocolloidal present a clearly dominant
typical C2 symmetry site.
For the Y2 O3 :Tm3+ phosphor, luminescent intensity is
stronger and synthesis temperature is lower in the case of
nanocolloidal than in the powder’s one. From excited luminescence spectra one can notice that optimal intensity was
observed when excited by 362 nm. The luminescent spectra
of Y2 O3 :Tm3+ nanopowder under 362 nm excited were presented in Figure 5.
The spectra of nanocolloidal and nanopowder under
337.1 nm excited are presented in the inset of Figure 5. The
position is not different, but the spectral resolution in the
nanocolloidal seems to be better in the powder.
The nanocolloidals have a narrow size distribution and
these spherical particles in the size range 5–10 nm are easy to
mix with water or polymer solution. That can explain why
the quenching concentration of Eu3+ , Tm3+ , and Er3+ has
been raised remarkably. This nanocolloidal media is useful
for preparing optical thin films.
TranKim Anh et al.
5
×105
×103
452.5 nm
463 nm
6000
Intensity (a.u.)
Intensity (a.u.)
459.5 nm
4000
1
2000
1 G −3 H
4
6
488 nm
525
20
450
500
Wavelength (nm)
460
λ (nm)
550
470
0
600
1% Tm
2% Tm
4% Tm
Figure 5: Luminescent spectra in dependence on Tm3+ concentration in Y2 O3 :Tm3+ (1, 2, 4 mol%) nanopowder under 362 nm excitation. Inset: luminescent spectra of Y2 O3 :Tm3+ nanocolloidal (1)
and nanopowder (2) under 337.1 nm excitation.
3.3. Energy transfer and upconversion mechanisms
The role of concentration, temperature, solvents as well as
upconversion, and ET mechanism were investigated in detail for Y2 O3 nanophores containing Eu3+ , Tb3+ , Er3+ , and
Yb3+ rare earth ions [34]. ET between Tb3+ and Eu3+ in
nanopowder has been elucidated from the luminescent spectra of (Y0.95 Eux Tby )2 O3 (with x/y = 8/2, 9/1, 7/3) by Anh
et al. in our previous paper [28]. In Y2 O3 :Tb3+ , Eu3+ sample, the spectra exhibits the well-known 5 D0 -7 FJ line emissions (J = 0, 1, 2, . . .) of the Eu3+ ion with the strongest line
for J = 2 at 612 nm in the red region. The peak at 546 nm
assigned to the 5 D4 -7 F5 transition of Tb3+ ions is also observed. But the intensity of this peak is much lower than the
peak corresponding to the 5 D0 -7 F2 transition of Eu3+ . The
peak at 546 nm was also lower for the Eu3+ and Tb3+ codoped
sample than the Tb3+ doped one. One can notice that the
emission spectra of Tb3+ in Y2 O3 nanocrystal are slightly
quenched by Eu3+ ions due to energy transfer from Tb3+ to
Eu3+ . The luminescent spectra of Y2 O3 :Tb3+ (1.25%), Eu3+
(5%), and Y2 O3 :Tb3+ (1.25%) nanocolloidals are shown in
Figure 6. The intensity of the Eu3+ emission based on energy
transfer from Tb3+ was analyzed in previous papers [28, 32].
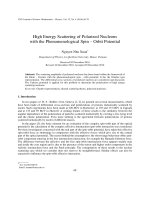
Under 980 nm irradiation, upconversion spectra in the
visible range from 500 nm–700 nm of Y2 O3 : Er3+ (dash
dot line) and Y2 O3 :Er3+ , Yb3+ (solid line) are presented in
Figure 7(a). The Er3+ -Er3+ upconversion mechanism is explained in accordance with the energy schema (Figure 7(b),
right). There is a great interest in the use of upconversion
materials for efficient conversion of infrared radiation to
visible light. This phenomenon has applications in several
5 D −7 F
0
2
(Eu3+ )
550
575
5 D −7 F
4
5 5
D0 −7 F0,1
(Tb3+ )
(Eu3+ )
500
5 D −7 F
0
4
(Eu3+ )
5 D −7 F
0
3
(Eu3+ )
5 D −7 F
4
6
(Tb3+ )
0
450
λexc = 325 nm
(He-Cd laser)
1
40
2
0
400
5 D −7 F
4
5
(Tb3+ )
2
2
1
1
Intensity (a.u.)
3
60
λexc = 362 nm
T = 300 K
1 D −3 F
2
4
2
550
600
650
Wavelength (nm)
700
Figure 6: Luminescent spectra of Y2 O3 :1.25%Tb3+ (1) and
Y2 O3 :1.25%Tb3+ , 5%Eu3+ (2) nanocolloidal excited by He-Cd laser
at 325 nm, inset to compare intensity of Tb3+ in Y2 O3 :1.25%Tb3+
and Y2 O3 :1.25%Tb3+ , 5%Eu3+ .
areas, such as upconversion lasing, and two photons fluorescence imaging, cathodoluminescence, and other applications. The Er3+ ion finds uses in laser materials and optical amplifiers under ground- and excited-state transitions
near 800 and 980 nm, where high-power diodes are available
[5]. In Y2 O3 :Er3+ nanophosphor, the green and red fluorescence lines are observed in our samples after 800 nm excitation, owing to the transitions (2 H11/2 ,4 S3/2 ) → 4 I15/2 (515–
575 nm) and 4 F9/2 → 4 I15/2 (640–690 nm) [26, 34]. Under
980 nm irradiation, the Er3+ ion is excited to the 4 F7/2 state
via two successive energy transfers. An NIR photon from the
pump beam will excite an Er+3 ion from the 4 I15/2 ground
state to the 4 I11/2 state. Another Er3+ ion also in the 4 I11/2
state and in close proximity will transfer its energy to the
initial ion, thereby exciting it to the 4 F7/2 state. The lower
emitting levels are then populated via multiphonon relaxation and green and red emissions are then observed.
Interactions between two Er3+ ions cannot be ignored.
Following the addition of Yb3+ ions, this process is greatly
diminished due to the large absorption cross-section of the
Yb3+ ions. The Er3+ absorption cross-section at this 980 nm
wavelength is not very high. By the addition of Yb3+ , pumping promotes an electron from the 2 F7/2 ground state to the
2F
3+
3+
7/2 manifold of Yb ; the excited Yb ion then transfers its
3+
4
I11/2 level (Figure 7(b)).
energy to the Er
Since the population of the 4 I13/2 level was increased, the
lifetime was also increased. Two deleterious processes can
also occur: via back energy transfer from Er3+ to Yb3+ ions,
or double energy transfer, where a second excited Yb3+ ion
transfers its energy to the Er3+ ion and promotes one electron
from the 4 I11/2 to the 4 F7/2 . When the Yb3+ concentration is
enhanced, the Er3+ ions start to “see” Yb3+ ions and deleterious Er3+ ↔Er3+ energy exchanges are progressively replaced
by the beneficial Yb3+ ↔Er3+ transfers.
6
Journal of Nanomaterials
20
4F
7/2
2H
11/2
4S
3/2
15
4F
9/2
∼ 550 nm
E (×103 cm−1 )
Intensity (a.u.)
4F
4
9/2 → I15/2
2H
4
4
11/2 , S3/2 → I15/2
4I
9/2
2F
5/2
4I
11/2
10
∼ 650 nm
4I
13/2
5
520
560
600
Wavelength (nm)
640
680
∼ 1550 nm
2F
7/2
0
4I
15/2
Yb3+
Er3+
Y2 O3 :Er (1%)
Y2 O3 :Er (1%), Yb (5%)
(a)
(b)
Figure 7: (a) Upconversion spectra in the visible range from 500 nm to 700 nm of Y2 O3 :Er3+ (dash doted line) Y2 O3 :Er3+ , Yb3+ (solid line)
following 980 nm irradiation, (b) energy schema presented the upconversion fluorescence interacted between Er-activator and Yb-sensitizer.
3.4. Study energy transfer based on the
decay times of fluorescence
The decay curves of Eu3+ and Tb3+ of Y2 O3 :Eu3+ , Tb3+
nanopowders for Eu3+ /Tb3+ = 9/1, 8/2, and 7/3, respectively,
(for 5 mol% rare earth ions) are presented in Figure 9(a)
(Eu3+ emission at 612 nm) and Figure 9(b) (Tb3+ emission
10
Intensity (a.u.)
Comparing codoped Y2 O3 :Er3+ , Yb3+ nanophosphors
with Er3+ concentration varying from 0.1 to 5 mol% and
5 mol% Yb3+ , the optimal content for the luminescent intensity at 1538 nm ( 4 I13/2 -4 I15/2 transition) is 1 mol% Er3+ . The
upconversion in the red region 640–675 nm presents also a
maximum for 1 mol% Er3+ . The effect of Er3+ concentration
on upconversion luminescence of Y2 O3 :Er3+ , Yb3+ is complicated depending on the power of the excitation laser. Red
upconversion luminescence is caused by a two-photon process, when excitation power is high enough, as to the samples
with lower concentration of Er3+ the intensity of green light
is weaker than that of red light because more ions will nonradiatively decay from higher levels to 2 H11/2 and 4 S3/2 levels
[30].
An advantage offered by our nanophosphors over the
two-photon excitable organic dye is that the upconversion
process in the Y2 O3 :Er3+ , Yb3+ nanophosphor occurs by sequential multistep absorption through real states and is thus
considerably stronger. One can use a low-power continuous
wave diode laser in the near infrared region to excite the
upconverted emission. By contrast, the two photon absorption in organic dyes that is directed (simultaneous) requires
a high-peak power pulse laser source for two-photon absorption through a virtual state. Figure 8 shows the luminescent
intensities of the band at 564 nm and 1538 nm versus the excitation power at 803.7 nm of a diode laser.
λexc = 803.7 nm
T = 300 K
1
0.1
100
1000
P (mW)
λanal = 564 nm
λanal = 1538 nm
Figure 8: Luminescent intensities of the band at 564 nm and
1538 nm versus the excitation power at 803.7 nm.
at 546 nm). The decay curves being nonexponential, we have
considered the normalized area SN under the decay curve.
The lifetimes of Eu3+ are 940, 360, and 650 microseconds for
the case Eu3+ /Tb3+ = 9/1, 8/2, and 7/3, respectively. The lifetimes of Tb3+ decreased from 400 microseconds to 175 microseconds for the case Eu3+ /Tb3+ = 9/1, 8/2, respectively, by
ET process.
The results have indicated that the ratio between
Eu3+ /Tb3+ plays an important role in the ET process. The
most effective ET is clearly for the sample with Eu3+ /Tb3+
ratio of 8/2. The ET between Tb3+ and Eu3+ has been also
investigated in Y2 O3 crystals [4] and in Tb1−x Eux P5 O14 crystals [44]. Site-selective spectra and time-resolved spectra
TranKim Anh et al.
Intensity (normalized)
Anealed temperature = 600◦ C
0.1
SN = 940 μs
0.01
λexc = 337.1 nm
SN = 650 μs
λanal = 612 nm (Eu3+ )
T = 300 K SN = 360 μs
1E − 3
0
2
Nanophosphors Y2 O3 :Tb, Eu (powders)
1
Nanophosphors Y2 O3 :Tb, Eu (powders)
1
Intensity (normalized)
7
4
t (ms)
6
8
Anealed temperature = 600◦ C
λexc = 337.1 nm
λanal = 545 nm (Tb3+ )
T = 300 K
SN = 400 μs
0.1
0.01
SN = 175 μs
1E − 3
0
Eu/Tb
9/1
8/2
7/3
2
4
t (ms)
6
8
Eu/Tb
9/1
8/2
7/3
(a)
(b)
Figure 9: Decay curves at wavelength of 611 nm for Eu3+ (a) and of 545 nm for Tb3+ (b) in Y2 O3 :Eu3+ , Tb3+ (5%) nanophosphor, annealed
at 600◦ C, in 30 minutes.
Intensity (a.u.)
1
λexc = 970 nm
T = 300 K
0.1
0.01
0
0.002
Time (s)
7.5%
5%
times are not purely exponential. There are two kinds of lifetimes: the short lifetimes are 250, 150, 35, and 15 microseconds in the case of 1%, 2.5%, 7.5%, and 15% Er; the second long lifetime decreases from 1300, 620, and 110 microseconds to 80 microseconds, respectively. The lifetime of
the emission IR increases as the concentration decreases. As
for luminescence, it would be interesting to obtain a series
of samples prepared under the same conditions and having undergone more significant temperatures of annealing,
one could then determine the temperature from which one
observes effects extinction. Lastly, let us note that the results of the spectra and the decays are coherent between
them.
0.004
3.5.
2.5%
1%
Figure 10: Decay curves for the band at 1535 nm of Y2 O3 :Er3+
nanophosphor versus Er3+ -concentration, under excitation at
970 nm.
of Y2 O3 :Eu3+ nanocrystal were investigated [45]. Recently,
Hongei Song studies the dependence of photoluminescent
properties of cubic Y2 O3 :Tb3+ nanocrystal on particles size
and temperature [46]. Up to now, our group is the only
group which has studied energy transfer between Tb3+ -Eu3+
in nanophosphors (powder and colloidal) of Y2 O3 codoped
with Tb3+ -Eu3+ .
In studying the decay behavior of the infrared emission
of the 4 I13/2 -4 I15/2 , transitions of Er3+ at 1535 nm depending on the Er-concentration from 1, 2.5, 5, 7, 5, 10, up to
15 mol% have been measured for Y2 O3 :Er3+ phosphor and
presented in Figure 10. Under 970 nm excitation, the decay
Application potential
Flat panel displays (FPDs) are thinner, lighter, and consume less than the conventional cathode-ray tube (CRT)
displays. The field emission displays (FEDs) are the most
promising FPDs technology. Rare earth-yttrium oxide is
one of the important materials for application not only for
FEDs, but also for waveguide and laser host. Enhancement
of cathodoluminescent and photoluminescent properties of
Y2 O3 :Eu3+ luminescent films by vacuum cooling were observed [47], structural and optical properties of rare-earthdoped Y2 O3 waveguides grown by pulsed-laser deposition
were studied [48]. Growth of rare earth (RE-) doped concentration gradient crystal fibers and analysis of dynamical
processes of laser resonant transitions in RE-doped Y2 O3
(RE = Yb3+ , Er3+ , Ho3+ ) were also studied [49]. Nanostructured ZnO/Y2 O3 :Eu3+ for use as in luminescent polymer electrolyte composites was presented [50]. Thin films
were prepared [51, 52] in order to apply for FPDs. The
upconverting nanophores for bioimaging were presented in
detail by Prasad [53]. The lifetimes of the nanophosphors
8
Journal of Nanomaterials
contained rare-earth ions in the range of millisecond and
microsecond are compared to organic dye fluorescence with
a lifetime typically in nanosecond. Specially, in our institute infrared cards were successfully proposed by mixing
Y2O3:Er3+ , Yb3+ , or Y2O3:Er3+ with polymethylmethacrylate (PMMA) with active imaging area of 20 × 20 mm2 . These
cards allow to detect a diode laser emitting at 980 nm with
power of 7 mW/cm2 . The red (655 nm–675 nm) or the green
(520 nm–570 nm) emissions could be observed in depending on the concentration of Er-Yb couple. They are stable
under 980 nm irradiation in the tropical conditions with
humidity near to 90%. The optical coding systems based
on the nanophosphors with ET luminescent and upconversion effect contained Eu3+ -Tb3+ (excitedby UV light at 370,
365, 337.1, and 325 nm) and Er3+ -Yb3+ activators (excited
by diode laser at 800 nm, 980 nm) have been successfully
developed for examination of commercial products, banknote [28, 54, 55], nanobarcodes [53], or planar waveguide
[56].
4.
CONCLUSIONS
In this paper, we have presented two simple and efficient
methods to prepare highly luminescent Y2 O3 nanophosphor
doped with Eu3+ , Tb3+ , Tm3+ , Er3+ , and Yb3+ . The average
size and its distribution of the nanophosphor can be tailored
sharply in nanoscale.
The optical properties and photophysic process, especially ET in Y2 O3 host matrix, have been investigated and
elucidated for improving the luminescence and upconversion processes.
Y2 O3 nanophosphor in colloidal media with averaged
size of 5 nm, narrow distribution, and spherical shape was
successfully prepared. The colloidal are transparent and well
stable at the concentration of 10%. The luminescence was
strong and energy transfer was observed in Y2 O3 :Tb3+ ,
Eu3+ . The upconversion emission from Y2 O3 :Er3+ , Yb3+
nanophosphor is remarkable for developing an infrared display card. Y2 O3 :Tm3+ together with both Y2 O3 :Tb3+ , Eu3+
and Y2 O3 :Er3+ , Yb3+ is good candidate for interesting application such as infrared cards and coding cards or biosensors.
The transparent colloidal could be a promising approach for
fabricating an optoelectronic thin film with higher optical
quality.
ACKNOWLEDGMENTS
The authors would like to thank Professor Nguyen Van
Hieu for his help, National Project for Advanced Materials
Science and Technology, no. KC.02.14, National Nanoprogram 810304, the Basis research state projects of CB20 and
Program for application of nanophosphors of Vietnamese
Academy of Science and Technology 2007-2008 KHCN (financially supported this work). A part of the authors work
was done in the National Key Laboratory of Electronic Materials and Devices, Institute of Materials Science, and Vietnamese Academy of Science and Technology.
REFERENCES
[1] C. Feldmann, T. J¨ustel, C. R. Ronda, and P. J. Schmidt, “Inorganic luminescent materials: 100 years of research and application,” Advanced Functional Materials, vol. 13, no. 7, pp.
511–516, 2003.
[2] A. S. Edelstein and R. C. Cammarata, Eds., Nanomaterials:
Synthesis, Properties and Applications, Taylor & Francis, London, UK, 1998.
[3] B. R. Ratna, A. D. Dinsmore, et al., “Nanophosphors: synthesis, properties and application,” in Proceedings of the 5th International Conference on the Science and Technology of Display Phosphors (ICSTDP ’99), p. 295, San Diego, Calif, USA,
November 1999.
[4] T. K. Anh, T. Ngoc, P. T. Nga, V. T. Bich, P. Long, and W.
Strek, “Energy transfer between Tb3+ and Eu3+ in Y2 O3 crystals,” Journal of Luminescence, vol. 39, no. 4, pp. 215–221, 1988.
[5] S. Shionoya and W. M. Yen, Phosphor Handbook, CRC Press,
Boca Raton, Fla, USA, 1999.
[6] G. Blasse and B. C. Grabmaier, Luminescent Materials,
Springer, Berlin, Germany, 1994.
[7] H. Eilers and B. M. Tissue, “Laser Spectroscopy of Nanocrystals Eu2 O3 and Eu3+ :Y2 O3 ,” Chemical Physics Letters, vol. 251,
no. 1-2, pp. 74–78, 1996.
[8] M. Kottaisamy, D. Jeyakumar, R. Jagannathan, and M. M. Rao,
“Yttrium oxide: Eu3+ red phosphor by self-propagating high
temperature synthesis,” Materials Research Bulletin, vol. 31,
no. 8, pp. 1013–1020, 1996.
[9] B. Bihari, H. Eilers, and B. M. Tissue, “Spectra and dynamics
of monoclinic Eu2 O3 and Eu3+ :Y2 O3 nanocrystals,” Journal of
Luminescence, vol. 75, no. 1, pp. 1–10, 1997.
[10] T. Ye, Z. Guiwen, Z. Weiping, and X. Shangda, “Combustion
synthesis and photoluminescence of nanocrystalline Y2 O3 :Eu
phosphors,” Materials Research Bulletin, vol. 32, no. 5, pp. 501–
506, 1997.
[11] E. T. Goldburt, B. Kulkarni, R. N. Bhargava, J. Taylor, and
M. Libera, “Size dependent efficiency in Tb doped Y2 O3
nanocrystalline phosphor,” Journal of Luminescence, vol. 72–
74, pp. 190–192, 1997.
[12] Q. Li, L. Gao, and D. Yan, “Effects of grain size on wavelength of Y2 O3 :Eu3+ emission spectra,” Nanostructured Materials, vol. 8, no. 7, pp. 825–831, 1997.
[13] J. A. Cooper, H. G. Paris, S. R. Stock, C. J. Summers, and D. N.
Hill, “Investigation of the effect of process variables on properties of europium-doped yttrium-oxide phosphor,” Journal of
the Society for Information Display, vol. 6, no. 3, pp. 163–166,
1998.
[14] D. K. Williams, B. Bihari, B. M. Tissue, and J. M. McHale,
“Preparation and fluorescence spectroscopy of bulk monoclinic Eu3+ :Y2 O3 and comparison to Eu3+ :Y2 O3 nanocrystals,”
Journal of Physical Chemistry B, vol. 102, no. 6, pp. 916–920,
1998.
[15] A. Konrad, T. Fries, A. Gahn, et al., “Chemical vapor synthesis and luminescence properties of nanocrystalline cubic
Y2 O3 :Eu,” Journal of Applied Physics, vol. 86, no. 6, pp. 3129–
3133, 1999.
[16] T. K. Anh, N. Vu, P. T. M. Chau, L. Q. Minh, N. T. Oanh, and
C. Barthou, “Preparation and optical properties of Y2 O3 :Eu
nanophosphors,” in Proceedings of the 3rd International Workshop on the Materials Science, F. F. Bekker, N. D. Chien, J. J. M.
Franse, T. D. Hien, N. T. Hien, and N. P. Thuy, Eds., Trends
in Materials and Technology, pp. 320–323, Hanoi, Vietnam,
November 1999.
TranKim Anh et al.
[17] J. A. Capobianco, F. Vetron, T. D’Alesio, G. Tessari, A. Speghini, and M. Bettinelli, “Optical spectroscopy of nanocrystalline
cubic Y2 O3 :Er3+ obtained via combustion synthesis,” Physical
Chemistry Chemical Physics, vol. 2, pp. 3203–3207, 2000.
[18] J. Zhang, Z. Zhang, Z. Tang, Y. Lin, and Z. Zheng, “Luminescent properties of Y2 O3 :Eu synthesized by sol-gel processing,”
Journal of Materials Processing Technology, vol. 121, no. 2-3, pp.
265–268, 2002.
[19] G. Y. Hong, B. S. Jeon, Y. K. Yoo, and J. S. Yoo, “Photoluminescence characteristics of spherical Y2 O3 :Eu phosphors
by aerosol pyrolysis,” Journal of the Electrochemical Society,
vol. 148, no. 11, pp. H161–H166, 2001.
[20] T. Igarashi, M. Ihara, T. Kusunoki, K. Ohno, T. Isobe, and
M. Senna, “Relationship between optical properties and crystallinity of nanometer Y2 O3 :Eu phosphor,” Applied Physics Letters, vol. 76, no. 12, pp. 1549–1551, 2000.
[21] C. Feldmann, “Polyol-mediated synthesis of nanoscale functional materials,” Advanced Functional Materials, vol. 13, no. 2,
pp. 101–107, 2003.
[22] R. Bazzi, M. A. Flores-Gonzalez, C. Louis, et al., “Synthesis
and luminescent properties of sub-5-nm lanthanide oxides
nanoparticles,” Journal of Luminescence, vol. 102-103, pp. 445–
450, 2003.
[23] G. Wakefield, E. Holland, P. J. Dobson, and J. L. Hutchison,
“Luminescence properties of nanocrystalline Y2 O3 :Eu,” Advanced Materials, vol. 13, no. 20, pp. 1557–1560, 2001.
[24] T. K. Anh, “The role of active centre concentration in the phenomena of energy transfer in lanthanide compounds,” Doctoral thesis, Wroclaw-Warsaw, Poland, 1987.
[25] D. R. Tallant, C. H. Seager, and R. L. Simpson, “Energy transfer
and relaxation in europium-activated Y2 O3 after excitation by
ultraviolet photons,” Journal of Applied Physics, vol. 91, no. 7,
pp. 4053–4064, 2002.
[26] N. Vu, T. K. Anh, L. Q. Minh, and C. Barthou, “Optical properties of Er3+ doped Y2 O3 nanophosphors,” Communication in
Physics, vol. 12, pp. 119–123, 2002.
[27] T.-L. Phan, M. H. Phan, N. Vu, T. K. Anh, and S.-C. Yu, “Luminescent properties of Eu-doped Y2 O3 nanophosphors,” Physica Status Solidi (a), vol. 201, no. 9, pp. 2170–2174, 2004.
[28] T. K. Anh, L. Q. Minh, N. Vu, et al., “Nanomaterials containing rare-earth ions Tb, Eu, Er and Yb: preparation, optical
properties and application potential,” Journal of Luminescence,
vol. 102-103, pp. 391–394, 2003.
[29] N. Vu, T. K. Anh, C. Barthou, and L. Q. Minh, “Preparation,
optical properties and up conversion effect of the nanophosphors doped with Er and Yb rare earth ions,” in Proceedings
of the 9th Asia Pacific Physics Conference (APPC ’04), pp. 579–
580, Hanoi, Vietnam, October 2004.
[30] N. Vu, Preparation, optical properties of nanophosphors
Y2 O3 :Eu, Tb, Er and Yb, Ph.D. thesis, Institute of Materials Science, Hanoi, Vietnam, 2007.
[31] N. Nguyen, M. H. Nam, T. K. Anh, L. Q. Minh, and E. Tanguy, “Optical properties of Eu3+ doped Y2 O3 nanophosphors,”
Advances in Natural Sciences, vol. 6, pp. 119–123, 2006.
[32] T. K. Anh, L. T. K. Giang, N. Vu, et al., “Luminescence and
energy transfer of Y2 O3 nanocolloidal containing rare earth
ions,” Journal on Science and Technology for Development,
vol. 24, pp. 85–93, 2007.
[33] N. Vu, T. K. Anh, G.-C. Yi, and W. Strek, “Photoluminescence
and cathodoluminescence properties of Y2 O3 :Eu nanophosphors prepared by combustion synthesis,” Journal of Luminescence, vol. 122-123, pp. 776–779, 2007.
9
[34] J. A. Capobianco, F. Vetrone, J. C. Boyer, A. Speghini, and M.
Bettinelli, “Enhancement of red emission (4 F9/2 → 4 I15/2 ) via
upconversion in bulk and nanocrystalline cubic Y2 O3 :Er3+ ,”
Journal of Physical Chemistry B, vol. 106, no. 6, pp. 1181–1187,
2002.
[35] D. Matsuura, “Red, green, and blue upconversion luminescence of trivalent-rare-earth ion-doped Y2 O3 nanocrystals,”
Applied Physics Letters, vol. 81, no. 24, pp. 4526–4528, 2002.
[36] A. M. Pires, O. A. Serra, and M. R. Davolos, “Morphological
and luminescent studies on nanosized Er, Yb-yttrium oxide
up-converter prepared from different precursors,” Journal of
Luminescence, vol. 113, no. 3-4, pp. 174–182, 2005.
[37] F. Vetrone, J. C. Boyer, J. A. Capobianco, A. Speghini, and M.
Bettinelli, “Effect of Yb3+ codoping on the up conversion emission in nanocrystalline Y2 O3 :Er3+ ,” Journal of Physical Chemistry B, vol. 107, no. 5, pp. 1107–1112, 2003.
[38] G. De, W. Qi, J. Zhang, et al., “Upconversion luminescence
properties of Y2 O3 :Yb3+ , Er3+ nanostructures,” Journal of Luminescence, vol. 119-120, pp. 258–263, 2006.
[39] C. Strohh¨ofer and A. Polman, “Absorption and emission spectroscopy in Er3+ -Yb3+ doped aluminum oxide waveguides,”
Optical Materials, vol. 21, no. 4, pp. 705–712, 2003.
[40] SIEMENS, Profile User’s Guide, 1994, Diffrac-AT, Version 3.2.
[41] SIEMENS Win-Crysize, 1998.
[42] T. Inami, M. Kobiyama, S. Okuda, H. Maeta, and H. Ohtsuka,
“Grain size measurement of nanocrystalline gold by X-ray
diffraction method,” Nanostructured Materials, vol. 12, no. 5–
8, pp. 657–660, 1999.
[43] L. T. C. Tuong and P. V. Phuc, “Determination of nanocrystalsizes and their distribution by X-ray diffraction method for
Y2 O3 :Eu nanophosphors,” in Proceedings of the International
Workshop on Optics and Spectroscopy, pp. 501–504, Hanoi,
Vietnam, March-April 2000.
[44] T. K. Anh and W. Strek, “Dynamics of energy transfer in
Tb1−x Eux P5 O14 crystals,” Journal of Luminescence, vol. 42,
no. 4, pp. 205–210, 1988.
[45] H. Song and J. Wang, “Dependence of photoluminescent
properties of cubic Y2 O3 :Tb3+ nanocrystals on particle size
and temperature,” Journal of Luminescence, vol. 118, no. 2, pp.
220–226, 2006.
[46] Z. Wei-Wei, X. Mei, Z. Wei-Ping, et al., “Site-selective spectra
and time-resolved spectra of nanocrystalline Y2 O3 :Eu,” Chemical Physics Letters, vol. 376, no. 3-4, pp. 318–323, 2003.
[47] D. Kumar, J. Sankar, K. G. Cho, V. Craciun, and R. K. Singh,
“Enhancement of cathodoluminescent and photoluminescent
properties of Eu:Y2 O3 luminescent films by vacuum cooling,”
Applied Physics Letters, vol. 77, no. 16, pp. 2518–2520, 2000.
[48] O. Pons-Y-Moll, J. Perriere, E. Millon, et al., “Structural
and optical properties of rare-earth-doped Y2 O3 waveguides
grown by pulsed-laser deposition,” Journal of Applied Physics,
vol. 92, no. 9, pp. 4885–4890, 2002.
[49] L. Laversenne, C. Goutaudier, Y. Guyot, M. Th. Cohen-Adad,
and G. Boulon, “Growth of rare earth (RE) doped concentration gradient crystal fibers and analysis of dynamical processes
of laser resonant transitions in RE-doped Y2 O3 (RE=Yb3+ ,
Er3+ , Ho3+ ),” Journal of Alloys and Compounds, vol. 341, no. 12, pp. 214–219, 2002.
[50] M. Abdullah, C. Panatarani, T.-O Kim, and K. Okuyama,
“Nanostructured ZnO/Y2 O3 :Eu for use as in luminescent
polymer electrolyte composites,” Journal of Alloys and Compounds, vol. 377, no. 1-2, pp. 298–305, 2004.
10
[51] N. Joffin, J. Dexpert-Ghys, M. Verelst, G. Baret, and A. Garcia,
“The influence of microstructure on luminescent properties of
Y2 O3 :Eu prepared by spray pyrolysis,” Journal of Luminescence,
vol. 113, no. 3-4, pp. 249–257, 2005.
[52] S.-S. Yi, J. S. Bae, B. K. Moon, J. H. Jeong, J.-C. Park, and I.
W. Kim, “Enhanced luminescence of pulsed-laser-deposited
Y2 O3 :Eu3+ thin-film phosphors by Li doping,” Applied Physics
Letters, vol. 81, no. 18, pp. 3344–3346, 2002.
[53] P. N. Prasad, Nanophotonic, Wiley-Interscience, New York, NY,
USA, 2004.
[54] T. K. Anh, N. Vu, T. T. Huong, and L. Q. Minh, “Nanomaterials containing rare earth ions for infrared card and planar
waveguide applications,” in The 2nd International Workshop on
Nanophysics and Nanotechnology (IWONN ’04), pp. 161–164,
Hanoi, Vietnam, October 2004.
[55] T. K. Anh, L. T. K. Giang, L. D. Tuyen, et al., “Oxide nanoparticles and colloidal, preparation, optical properties and application potential,” in Proceedings of the 1st International Workshop
on Functional Materials and the 3rd International Workshop on
Nanophysics and Nanotechnology, pp. 424–427, Halong, Vietnam, December 2006.
[56] T. T. Huong, T. K. Anh, M. H. Nam, C. Barthou, W. Strek,
and L. Q. Minh, “Preparation and infrared emission of silicazirconia-alumina doped with erbium for planar waveguide,”
Journal of Luminescence, vol. 122-123, pp. 911–913, 2007.
Journal of Nanomaterials