DSpace at VNU: Occurrence of Phthalate Diesters in Particulate and Vapor Phases in Indoor Air and Implications for Human Exposure in Albany, New York, USA
Bạn đang xem bản rút gọn của tài liệu. Xem và tải ngay bản đầy đủ của tài liệu tại đây (597.02 KB, 11 trang )
Arch Environ Contam Toxicol
DOI 10.1007/s00244-015-0140-0
Occurrence of Phthalate Diesters in Particulate and Vapor Phases
in Indoor Air and Implications for Human Exposure in Albany,
New York, USA
Tri Manh Tran • Kurunthachalam Kannan
Received: 14 October 2014 / Accepted: 1 February 2015
Ó Springer Science+Business Media New York 2015
Abstract Phthalate diesters are used as plasticizers in a
wide range of consumer products. Because phthalates have
been shown in laboratory animal studies to be toxic, human
exposure to these chemicals is a matter of concern. Nevertheless, little is known about inhalation exposure to phthalates in the United States. In this study, occurrence of
nine phthalates was determined in 60 indoor air samples
collected in 2014 in Albany, New York, USA. Airborne
particulate and vapor phase samples were collected from
various sampling locations by use of a low-volume air
sampler. The median concentrations of nine phthalates in
air samples collected from homes, offices, laboratories,
schools, salons (hair and nail salons), and public places
were 732, 143, 170, 371, 2600, and 354 ng/m3, respectively. Diethyl phthalate (DEP) was found at the highest
concentrations, which ranged from 4.83 to 2250 ng/m3
(median 152) followed by di-n-butyl phthalate, which
Electronic supplementary material The online version of this
article (doi:10.1007/s00244-015-0140-0) contains supplementary
material, which is available to authorized users.
T. M. Tran Á K. Kannan (&)
Wadsworth Center, New York State Department of Health, and
Department of Environmental Health Sciences, School of Public
Health, State University of New York at Albany, Empire State
Plaza, P.O. Box 509, Albany, NY 12201-0509, USA
e-mail:
T. M. Tran
Faculty of Chemistry, Hanoi University of Science, Vietnam
National University at Hanoi, 19 Le Thanh Tong, HoanKiem,
Hanoi, Vietnam
K. Kannan
Biochemistry Department, Faculty of Science and Experimental
Biochemistry Unit, King Fahd Medical Research Center, King
Abdulaziz University, Jeddah 21589, Saudi Arabia
ranged from 4.05 to 1170 ng/m3 (median 63.3). The median inhalation exposure dose to phthalates was estimated
at 0.845, 0.423, 0.203, 0.089, and 0.070 lg/kg-bw/d for
infants, toddlers, children, teenagers, and adults, respectively. Inhalation is an important pathway of human exposure to DEP.
Phthalate diesters (or phthalates) are esters of phthalic acid
and are used widely as plasticizers in various consumer and
industrial products. Phthalates are present in building materials, clothing, personal care products (PCPs), food
packaging, toys, vinyl products, lubricating oils, solvents,
and detergents (Antian 1973; Hubinger and Havery 2006;
United States Environmental Protection Agency [USEPA]
2008; Clausen et al. 2010). Certain cooking utensils, such as
spatulas, were reported to contain di(2-ethylhexyl) phthalate
(DEHP) and di-n-butyl phthalate (DBP) at concentrations of
60–5830 and 60–80 lg/g, respectively (Kawamura et al.
2001). In addition, degassing of DEHP from polyvinyl
chloride (PVC) flooring and the emission of DEHP and diisononylphthalate (DiNP) into indoor air from various phthalate-containing products has been reported (Clausen et al.
2012). Diethyl phthalate (DEP) and DBP were found in
cosmetics and personal care products at concentration as
high as 25,500 and 24,300 lg/g, respectively (Koniecki
et al. 2011; Buck Louis et al. 2013; Guo and Kannan 2013;
Guo et al. 2014). DEHP was the major phthalate ester found
in foods with a median concentration of 28 ng/g in dairy
products, 86 ng/g in fish, and 44.5 ng/g in meats from the
United States (Schecter et al. 2013). These studies suggest
the existence of a wide variety of sources of human exposure
to phthalates in the environment.
A few studies have reported the occurrence of phthalates
in various indoor environmental samples. A total of 17
123
Arch Environ Contam Toxicol
phthalate diesters were found in house dust collected from
Canada, and DEHP was found at the highest concentration,
ranging from 36 to 3840 lg/g (Kubwabo et al. 2013). The
total median concentration of nine phthalates in house dust
from China and the United States ranged from 151 to
765 lg/g (Guo and Kannan 2011b). In another study, seven
phthalates were measured in house dust from the United
States at concentrations that ranged from 1 to 570 lg/g
(Bergh et al. 2012).
Although a large number of studies have reported the
occurrence of phthalates in house dust, very few have reported the occurrence of these compounds in the airborne
particulate and vapor phases of indoor air. DEP (range
145–7120 ng/m3) and DBP (range 755–14,800 ng/m3) were
reported to occur in indoor air from the United States and
Poland (Adibi et al. 2002; Rudel et al. 2003). Fromme et al.
(2004) reported the occurrence of DBP in indoor air at median concentrations of 1080 ng/m3 in apartments and
1190 ng/m3 in kindergartens in Berlin, Germany. The mean
concentrations of six individual phthalates in the indoor air
of homes, day care centers, and offices in Stockholm ranged
from 4.6 to 1600 ng/m3 (Bergh et al. 2011). The median
concentrations of seven phthalates in indoor air from France
were reported at \0.6–326 ng/m3 (Blanchard et al. 2014).
Indoor air is a major source contamination by phthalates in
ambient and outdoor air (Cousins et al. 2014). A recent study
showed that concentrations of phthalates in indoor air
were B27 times greater than in outdoor air in California
(Gaspar et al. 2014). Thus, measurement of phthalates in
indoor air will provide an understanding of potential sources
and pathways of these chemicals in the environment.
Studies have shown that phthalates elicit reproductive
and developmental toxicities in laboratory animals (Gray
et al. 2006; Boberg et al. 2008). Specifically, phthalate
exposure was shown to be associated with endocrine disruption, respiratory effects, and reproductive and developmental toxicities (Lin et al. 2011; Hauser and Calafat
2005; Calafat and Mckee 2006; Buck Louis et al. 2013). A
negative association between environmental phthalate exposure and intelligence or behavior in children has been
shown (Cho et al. 2010; Engel et al. 2010). Therefore, if we
are to develop strategies to mitigate exposures, a comprehensive assessment of sources of human exposure to phthalates is necessary. Our research group has reported the
occurrence of phthalates in foodstuffs, indoor dust, and
personal care products in previous studies from the United
States (Guo and Kannan 2011b, 2012a, 2013; Guo et al.
2012b, 2014). In the present study, 9 phthalate diesters
were determined in 60 indoor air samples collected from
Albany, New York, USA. Partitioning of phthalate esters
between particulate and vapor phases of indoor air was
determined. Furthermore, human exposure to phthalates
through the inhalation of indoor air was assessed.
123
Materials and Methods
Standards and Solvents
Nine phthalate diesters—i.e., dimethyl phthalate (DMP),
diethyl phthalate (DEP), diisobutyl phthalate (DIBP), DBP,
di-n-hexyl phthalate (DNHP), benzyl butyl phthalate
(BzBP), dicyclohexyl phthalate (DCHP), DEHP, and di-noctyl phthalate (DOP)—along with their corresponding d4
(deuterated) internal standards, with a purity of [99 %,
were purchased from AccuStandard Inc (New Haven,
Connecticut, USA). Analytical-grade acetone was purchased from Macron Chemical (Nashville, Tennessee,
USA), and hexane and dichloromethane were purchased
from J. T. Baker (Phillipsburg, New Jersey, USA).
Sample Collection and Extraction
Precleaned polyurethane foam (PUF) plugs (ORBO-1000
small PUF; 2.2-cm O.D 9 7.6-cm length) were purchased
from Supelco (Bellefonte, Pennsylvania, USA). For the
analysis of background levels of phthalates, PUFs were
extracted with dichloromethane (DCM) and hexane (3:1,
v:v) and analyzed by gas chromatography-mass spectrometry (GC-MS). It was found that each of the newly
purchased PUF plugs contained DMP, DEP, DBP, DIBP,
BzBP, and DEHP at 2.8–5.9, 8.4–46.3, 15.6–70.2, 5.1–33.3,
2.9–10.5, and 21.5–168 ng, respectively (n = 5). Therefore,
all PUF plugs required additional purification before use.
PUFs were purified by shaking with a 100-mL mixture of
DCM and hexane (3:1, v:v) for 30 min. This procedure was
repeated twice. The cleaned PUFs were wrapped in solventrinsed aluminum foil, stored in a glass jar, and placed in an
oven at 100 °C until use. The quartz fiber filters (Whatman,
grade QM-A, pore size 2.2 lm with a particle retention
rating at 98 % efficiency in liquid, 32-mm diameter) were
prepared by heating at 450 °C for 20 h. The purified quartz
fiber filters were kept in an oven at 100 °C until use. The
quartz fiber filters were weighed in an analytical balance
(0.01 mg) before and after the collection of air samples for
the determination of particle content in air.
Two PUF plugs were packed in tandem in a glass tube
(ACE glass Inc., Vineland, New Jersey; 2.2-cm outer diameter 9 25-cm length), and the quartz fiber filter was held
with a Teflon cartridge (Supelco, PUF filter cartridge
assembly) on top of the glass tube packed with PUF plugs.
Indoor air samples were collected for 12–24 h by a lowvolume air sampler (LP-20; A.P. Buck Inc., Orlando, Forida, USA) at a flow rate of 5 l/min. The total volume of air
collected from each location ranged from 3.6 to 7.2 m3. Air
samples (both PUFs and filters) were kept at -18 °C until
analysis. The samples were kept frozen for no longer than
3 weeks before analysis. The samples were collected from
Arch Environ Contam Toxicol
January to May 2014 at several locations in Albany, New
York, USA. The sampling locations were grouped into six
categories: homes (n = 20), offices (n = 7), laboratories
(n = 13), schools (n = 6), salons (n = 6 [hair and nail salons]), and public places (n = 8 [e.g., shopping malls]).
Before analysis, samples (both PUFs and filters) were
spiked with 100 ng of deuterated internal standards (except
for d4-DEHP, which was spiked at 500 ng). The particulate
samples were extracted by shaking glass fiber filters with a
mixture of DCM and hexane (3:1; 20 mL; v:v) three times
for 5 min each time. The extracts were concentrated in a
rotary evaporator at 40 °C to approximately 5 mL. The
solution was then transferred into a 12-mL glass tube and
concentrated by a gentle stream of nitrogen to exactly
1 mL, which was then transferred into a GC vial.
PUF plugs were extracted by shaking in an orbital
shaker (Eberbach Corp., Ann Arbor, Michigan, USA) with
DCM and hexane (3:1, v:v) for 30 min. The extraction was
performed twice with 100 mL of solvent mixture for the
first time and 80 mL for the second time. The extracts were
concentrated in a rotary evaporator and then by a gentle
stream of nitrogen to exactly 1 mL. The sample was then
transferred into a GC vial.
Instrumental Analysis
Nine phthalate diesters were analyzed on a gas chromatograph
(6890 N; Agilent, Santa Clara, California, USA) coupled with
a 5973 mass spectrometer. A fused-silica capillary column
(HP-5MS; Agilent; 5 % diphenyl 95 % dimethylpolysiloxane, 30 m 9 0.25-mm inner diameter; 0.5-lm film thickness) was used for the separation of phthalates. Samples were
injected in the splitless mode, and the injection volume was
2 lL.
The oven temperature was programmed from 80 °C
(held for 1.0 min) to 180 °C at 12 °C/min (held for
1.0 min), increased to 230 °C at 6 °C/min, then to 270 °C
at 8 °C/min (held for 2.0 min), and finally increased to
280 °C at 30 °C/min (held for 12.0 min) (Guo et al. 2014).
Ion fragments m/z 163, m/z 279, and m/z 149 were monitored for the quantification of DMP, DOP, and seven other
phthalate diesters, respectively. The fragment ions m/z 177
for DEP, m/z 233 for DIBP and DBP, m/z 223 and m/z 206
for BzBP, m/z 167 for DCHP, m/z 167 and m/z 279 for
DEHP, and m/z 279 for DNHP were monitored for the
confirmation of the target compounds (Guo et al. 2012b).
Ion fragment m/z 167 was monitored for d4-DMP and m/z
153 for other internal standards.
laboratory materials. Residue levels of phthalates in laboratory materials, including solvents used in extraction, have
been studied in our laboratory (Guo and Kannan 2011b,
2012a, 2013; Guo et al. 2011a, 2011c, 2012b, 2014). Before
the analysis of air samples, considerable effort was made to
decrease the background levels of contamination in the analytical procedures. All glassware was heated at 450 °C for
20 h before use. The baked glassware was covered in clean
aluminum foil and kept in an oven at 100 °C until further use.
Newly opened solvents were used directly from glass bottles,
and exposure of solvent to air was kept minimal. Procedural
blanks were analyzed with every batch of samples. Trace
levels of DEP (1.9–14.8 ng), DIBP (1.2–11.7 ng), DBP
(3.1–22.1 ng), BzBP (1–3.2 ng), and DEHP (3.2–26.1 ng)
were found in procedural blanks (n = 12) involving new
PUFs, and DIBP (0.5–3.3 ng), DBP (1–6.7 ng), and DEHP
(2.1–14.9 ng) were found in procedural blanks (n = 12)
containing quartz fiber filters. All reported concentrations in
indoor air samples were subtracted from the mean value found
in procedural blanks. The calibration curve was linear over a
concentration range from 0.3 to 500 ng/mL for individual
phthalate diesters (R2 [ 0.99).
A total of 100 ng of internal standards (d4-phthalates)
were spiked into a blank PUF and glass fiber filter (except
for d4-DEHP, which was spiked at 500 ng) and passed
through the entire analytical procedure. The average recoveries of internal standards in method blanks were
90–118 % with an RSD that ranged from 5.17 to 11.9 % for
PUFs and were 82–116 % with an RSD that ranged from
5.6 to 11 % for the glass fiber filter. The method detection
limit (MDL) and the method quantification limit (MQL)
were determined based on the lowest point in the calibration standard with signal-to-noise ratios of 3 and 10, respectively; the average volume of air collected, which was
3.6 m3, and the average mass of airborne particle collected,
which was 0.25 mg, were included in the calculation. For
the particulate phase, the MQL ranged from 1.5 to 6 lg/g,
and for the vapor phase, the MQL ranged from 0.1 to
0.45 ng/m3 (Supporting Information Table S1). Statistical
analysis of the data was performed using Microsoft Excel,
Microsoft Office 2010, and Graph Pad Prism, Version 5.0.
Concentrations lower than the MQL were assigned a value
equal to half the MQL for statistical analysis.
Results and Discussion
Phthalates in Particulate and Vapor Phases in Indoor
Air
Quality Assurance and Quality Control
One of the major challenges associated with the analysis of
phthalates in air is the potential for contamination from the
The mass of airborne particles in air samples was determined
based on the difference in the weight of the quartz fiber filter
before and after the collection of samples. The mass of
123
Arch Environ Contam Toxicol
particles in air samples ranged from 0.15 to 0.45 mg (mean
0.25). In the particulate phase, DMP, DNHP, DCHP, and
DOP were found at a detection frequency of 95, 55, 15, and
15 % respectively (Tables S2 and S3). Nevertheless, DEP,
DIBP, DBP, BzBP, and DEHP were found at high concentrations in all of the samples. DEHP, followed by DBP
(427 lg/g) and DIBP (370 lg/g), was found at the highest
median concentration (465 lg/g) in the particulate phase
(Table 1). The total median concentration of sum of nine
phthalates in the particulate phase ranged from 1030 lg/g
(i.e., approximately 0.1 %) for public places to 14,700 lg/g
(i.e., approximately 1.5 %) for salons (hair and nail salons).
The overall median concentration of phthalates in airborne
particles in 60 samples was 2070 lg/g (approximately
0.2 %). The measured concentrations of phthalate diesters in
the particulate phase were similar to those reported for house
dust from several countries including the United States and
Canada (Bornehag et al. 2005; Guo and Kannan 2011b;
Bergh et al. 2012; Kubwabo et al. 2013).
The median concentration of DEP in the vapor phase was
112 ng/m3, whereas that value in the particulate phase (on a
volumetric basis) was 17.3 ng/m3 (Table S2 and S3). The
concentration of DEP was six times greater in the vapor phase
than in the particulate phase. Blanchard et al. (2014) reported
that the ratio of DEP between the vapor and the particulate
phases was 157, which was much greater than the ratios found
in our study. Similarly, the DMP concentration in the vapor
phase was 33.2 ng/m3, which was 25 times greater than that in
the particulate phase (1.35 ng/m3). Concentrations of other
phthalates (i.e.,, DIBP, DBP, BzBP, and DEHP) in the vapor
and the particulate phases were not significantly different.
DNHP, DCHP, and DOP were found less frequently in indoor
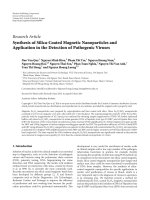
air samples (Fig. 1). The median concentration of individual
phthalates in the vapor phase ranged from lower than the
MQL to 112 ng/m3, and those in the particulate phase ranged
from lower than the MQL to 24.9 ng/m3.
Gas-Particle and Octanol-Air Partition Coefficient
of Phthalates
The gas-particle partition coefficient (KP) and the octanolair partition coefficient (KOA) of phthalate diesters were
calculated on the basis of the concentrations measured in
the vapor and particulate phases of indoor air. The partition
coefficient, Kp, which has the units of m3/lg, was determined by Eq. (1):
KP ¼ ðF=TSPÞ=A
3
ð1Þ
3
where F (ng/m ) and A (ng/m ) are the particulate and
vapor phase concentrations, respectively, and TSP (lg/m3)
is the total suspended particulate matter concentration
(Finizio et al. 1997; Schossler et al. 2011). F/TSP, which
has the unit ng/lg, can be combined to give the fraction of
123
Fig. 1 Median concentrations of individual phthalate esters found in
particulate and vapor phases in indoor air from Albany, NY, USA
(n = 60 samples)
target compound concentration in the particulate phase.
Finizio et al. (1997) showed a fundamental relationship
between KOA and KP as shown in Eq. (2):
KP ¼ ðfomÀpart KOA Þ=qpart
ð2Þ
By applying fom-part = 0.4 for the organic fraction of
dust (Fromme et al. 2005) and a particle density of
qpart = 1000 kg/m3 (Turpin et al. 2001; Weschler et al.
2008; Weschler and Nazaroff 2010), Schossler et al. (2011)
obtained Eq. (3):
logðKP Þ ¼ logðKOA Þ À 12:4
ð3Þ
We determined KP and log(KP) based on the ratio of
concentrations of individual phthalates between the particulate and vapor phases. Equation (3) was used in the
calculation of log(KOA) (Table 2). The log(KP) and the
log(KOA) values of the low molecular-weight phthalates
were lower than those of high molecular-weight phthalates.
The log(KOA) value ranged from 8.60 for DMP (lowest) to
11.1 for DEHP (highest) (Table 2). In a previous study, the
log(KOA) values for six phthalates were reported to range
from 6.69 (for DMP) to 12.6 (for DEHP) (Schossler et al.
2011). Nevertheless, our results indicate that the low
molecular-weight phthalates, such as DEP and DMP,
preferentially partition to the vapor phase, whereas the high
molecular-weight phthalates, such as DEHP, tend to partition toward the particulate phase in air.
Concentrations of Phthalates (Particulate Plus Vapor)
in Bulk Indoor Air
Total concentrations of individual phthalate diesters in the
bulk of indoor air were determined by the summation of
1.35
95
Median
DR (%)
0.49
100
Median
DR (%)
ND–2.40
0.57
Mean
0.35
\MQL–1.14
Range
Range
21.6–143
100
DR (%)
Mean
100
0.36
Median
100
17.3
67.8
0.34–466
40.0
100
54.1
231
224
0.39
17.7–466
100
Mean
100
DR (%)
40.4
0.25–0.52
0.31
Median
60.3
8.89–202
100
1.41
2.57
0.34–14.9
1.0
100
42.9
Range
0.28
Mean
46.2
DR (%)
0.11–0.48
0.29
Median
Range
0.45
0.25
100
Median
DR (%)
ND–0.36
0.28
Mean
Mean
0.37–237
\MQL–0.4
Range
Range
100
100
19.4
53.6
1.29–579
24.2
100
23.2
4.71–45.0
100
225
234
12.5–579
100
24.1
25.2
3.64–69.5
100
2.43
4.65
1.48–17.1
7.30
100
44.3
1.29–192
100
100
24.9
42.8
0.85–451
21.4
100
22.7
11.0–40.2
100
66.3
65.8
35.5–90.8
100
45.1
44.6
9.62–94.3
100
5.40
6.67
2.01–21.3
14.3
100
28.4
3.92–102
100
44.7
3
100
1.02
3.31
0.11–59.8
1.30
100
1.37
0.33–3.08
100
0.78
0.88
0.27–1.98
100
7.12
5.45
0.68–8.35
100
0.99
1.40
0.11–4.22
0.89
100
0.94
0.36–1.95
100
1.19
100
24.7
27.0
2.04–90.3
23.9
100
23.0
3.89–52.2
100
27.5
27.5
12.4–42.7
100
5.93
15.8
2.04–58.7
100
34.0
37.3
2.48–90.0
29.3
100
29.7
11.0–52.8
100
22.9
100
33.2
15.5
0.41–120
10.9
100
8.95
1.17–16.2
100
91.0
96.8
23.9–120
100
11.7
13.4
6.67–25.9
100
4.87
4.53
0.57–8.48
21.5
100
14.8
0.41–33.8
100
57.5
56.2
1.95–83.1
100
33.9
24.1
4.95–72.0
DR (%)
18.0
6.26
0.11–59.8
0.27
71.9
0.85–451
Median
55.3
1.47–178
0.50
79.6
3.42–361
\MQL–2.40
Mean
DEHP
Range
BzBP
DMP
DBP
DEP
DMP
DIBP
Vapor phase
Particulate phase
ND not detectable, DR % detection rate, \MQL lower than the MQL (range 0.1–0.45 ng/m for individual phthalate)
Total (n = 60)
Public places (n = 8)
Salons (n = 6)
Schools (n = 6)
Laboratories (n = 13)
Offices (n = 7)
Homes (n = 20)
Building type
100
112
377
3.87–1940
125
100
246
13.6–675
100
1480
1450
897–1940
100
134
137
9.39–280
100
10.4
12.5
3.87–28.8
11.9
100
248
4.46–1010
100
390
463
13.2–1630
DEP
Table 1 Concentrations of phthalate diesters in particulate and vapor phases (ng/m3) in indoor air from Albany, New York, USA
100
19.9
45.7
0.85–802
5.68
100
19.1
1.07–104
100
151
303
37.3–802
100
28.4
30.4
8.32–67.7
100
2.62
4.76
0.85–12.2
9.82
100
10.6
1.64–20.7
100
19.6
22.4
1.50–80.0
DIBP
100
27.8
69.6
1.09–1130
65.7
100
68.6
1.58–203
100
315
473
33.1–1130
100
20.3
19.7
4.41–33.4
100
4.35
8.86
1.22–40.7
17.0
100
18.6
1.36–36.4
100
22.6
21.2
1.09–111
DBP
100
3.33
5.94
0.20–26.0
3.72
100
4.42
0.70–17.2
100
10.7
10.9
0.94–26.0
100
8.6
9.3
0.40–15.9
100
3.15
5.81
1.03–20.6
3.83
100
5.97
0.57–17.4
100
2.99
6.22
0.20–24.7
BzBP
100
20.7
68.3
2.65–663
11.8
100
13.8
6.66–25.8
100
43.1
195
9.54–663
100
5.10
18.4
2.65–72.8
100
77.0
155
15.4–562
10.8
100
22.0
5.49–37.8
100
17.4
27.4
2.98–132
DEHP
Arch Environ Contam Toxicol
123
Arch Environ Contam Toxicol
Table 2 Estimated log(KP) and log(KOA) values for phthalate diesters (on the basis of the concentrations measured in particulate and
vapor phases in indoor air)
Phthalate diesters
log(KP)
Range
log(KOA)
Mean
Range
Mean
DMP
-3.96 to -3.12
-3.80
8.44–9.28
8.60
DEP
-2.99 to -1.83
-2.59
9.41–10.6
9.81
DIBP
-1.75 to -1.45
-1.73
10.5–10.9
10.7
DBP
-2.59 to -1.33
-1.81
9.81–11.1
10.6
BzBP
-2.66 to -1.32
-2.14
9.74–11.1
10.3
DEHP
-1.97 to -1.18
-1.32
10.6–11.2
11.1
Log(KP) and log(KOA) were estimated based on the concentrations of
individual phthalate diesters determined in particulate and vapor
phases in indoor air (n = 60 samples)
concentrations measured in the particulate and vapor
phases and reported on the basis of air volume (m3). The
concentrations of individual phthalate esters determined in
bulk indoor air (sum of vapor and particulate phases) are
listed in Table 3. DEP was found in all indoor air samples
at the highest concentration with values that ranged from
4.83 to 2250 ng/m3 (median 152). The concentrations of
DBP ranged from 4.05 to 1170 ng/m3 (median 63.3) and
DIBP from 2.95 to 1380 ng/m3 (median 48.8). The measured concentrations of DEP were similar to those reported
in indoor air from homes in Stockholm (4.6–1600 ng/m3)
(Bergh et al. 2011) but were six times lower than those
reported for indoor air of homes in Krakow, Poland
(1000 ng/m3) (Adibi et al. 2002). A study from Berlin,
Germany (Fromme et al. 2004), reported DEP concentrations at 1080 ng/m3 for apartments and 1190 ng/m3 for
kindergartens, which are within the range of values found
in our study.
DNHP, DCHP, and DOP were detected in 41.7, 13.3,
and 35 % of indoor air samples, respectively, although
their median concentrations were lower than the MDL.
Several studies have shown that low molecular-weight
phthalate esters (e.g., DEP and DBP) are present in cosmetics and personal care products (Guo et al. 2014). The
highest concentration of DEP found in personal care
products from the United States was 937 lg/g (approximately 0.9 %, w/w) (Guo et al. 2014). DEP was detected at concentrations B38,700 lg/g (approximately
3.9 %), and DBP was found at concentrations B59,800 lg/
g (approximately 6 %) in cosmetics from Washington, DC,
USA (Hubinger et al. 2006). DEP was found in almost all
types of surveyed products, and the highest concentrations
(25,500 lg/g [2.6 %]) were found in fragrances. DBP was
largely present in nail polishes, and a concentration as high
as 24,300 lg/g (approximately 2.4 %) was reported from
Canada (Koniecki et al. 2011). These results explain high
levels of phthalates, especially DEP, found in indoor air in
123
salons (hair and nail salons). The highest measured concentration of DEP in indoor air from salons was 2250 ng/
m3 (median 1680). DIBP and DBP were detected at similar
levels in indoor air from salons with a median concentration of approximately 350 ng/m3. DNHP, DCHP, and DOP
were not found in indoor air from salons.
The overall median concentration for the sum of nine
phthalates in 60 indoor air samples was 390 ng/m3. These
values are two times lower than those reported from homes
in Cape Cod, Massachusetts, USA (1030 ng/m3) (Rudel
et al. 2003). However, our values were similar to the
concentrations (450 ng/m3) reported for residential dwellings in Sapporo, Japan (Kanazawa et al. 2010). Pei et al.
(2013) reported 30 times greater levels of five phthalates in
indoor air from newly decorated apartments in China
(12,000 ng/m3) than what was found in our study.
A comparison of total concentration of nine phthalates
in indoor air among six categories of sampling locations is
shown in Fig. 2. Indoor air samples from salons (hair and
nail salons) contained the highest total concentration of
phthalates (median 2600 ng/m3), which was one order of
magnitude greater than that found in other locations. The
concentrations of phthalates measured in other five categories of sampling locations were similar, and the offices
had the lowest concentration at 143 ng/m3.
Composition of Phthalates in Indoor Air
The composition profile of phthalates in indoor air varied
among the sampling locations (Fig. 3). Overall DEP,
DIBP, DBP, and DEHP, collectively, accounted for C94 %
of the total phthalate concentrations in indoor air. In
homes, schools, salons (hair and nail salons), and public
places, DEP was the dominant compound found at 68, 58,
67, and 48 %, respectively, of the total phthalate concentrations. A high proportion of DEP in indoor air was similar
to that reported in personal air samples collected in
northern Manhattan, New York, USA, which contained
DEP at 70 % of the total phthalate concentrations (Adibi
et al. 2002). Pei et al. (2013) showed that DEP, BzBP, and
DEHP, collectively, accounted for 72 % of the total phthalate concentrations in indoor air from homes in China.
Bergh et al. (2011) reported that DEP accounted for [50 %
of the total phthalate concentrations in indoor air from
Stockholm, Sweden. DIBP and DBP concentrations in indoor air from Albany, New York, USA, were 5–27.2 % of
the total phthalate concentrations. DEHP was the dominant
compound in indoor air from laboratories (75 %) and offices (42 %). Great proportions of DEHP in laboratories
suggest that the sources are predominantly from plastics
and PVC products (Rudel and Perovich 2009; Clausen
et al. 2010, 2012). The high proportion of DEP and DBP in
indoor air can be explained by the fact that these low
152
100
34.4
100
Median
DR (%)
100
4.83–2250
445
100
DR (%)
156
300
35.2–819
100
1680
1670
1270–2250
100
211
197
56.1–288
100
15.1
13.1
6.61–34.6
100
12.9
291
4.83–1250
100
432
0.57–120
15.9
11.7
Median
Range
Mean
9.52
Mean
100
DR (%)
1.34–16.8
91.4
Median
Range
97.2
100
DR (%)
24.4–120
12.1
Median
Mean
13.7
Mean
Range
6.80–26.3
100
DR (%)
Range
4.61
4.09
100
DR (%)
Mean
Median
23.5
Median
0.57–8.50
14.9
Mean
Range
0.66–34.2
100
DR (%)
Range
57.7
Median
543
28.0–1780
DEP
100
48.8
2.95–1380
99.3
100
33.3
42.3
9.18–144
100
305
537
123–1380
100
59.0
55.6
12.1–93.8
100
9.42
6.14
2.95–27.7
100
18.0
54.9
8.94–209
100
72.5
77.8
11.9–253
DIBP
100
63.3
4.05–1170
112
100
81.5
91.3
22.3–237
100
373
539
122–1170
100
66.3
64.4
21.1–98.7
100
15.5
11.9
4.05–47.2
100
33.5
47.0
5.28–138
100
90.2
93.1
17.5–472
DBP
5.77
\MQL
10.9
\MQL
ND
2.91–27.0
5.64
\MQL
55
0.98–61.3
9.25
100
4.45
5.78
1.36–18.8
100
11.3
11.8
ND–3.44
\MQL
0
ND
ND
ND
0
ND
ND
100
11.7
\MQL
83.88
2.88–20.5
100
7.19
4.86
2.09–21.1
ND–3.13
84.6
0.55
0.25
ND–2.38
100
6.91
\MQL
71.4
1.24–18.2
ND–1.44
100
3.78
\MQL
80
0.98–61.3
12.5
ND–3.44
BzBP
\MQL
DNHP
40.6
\MQL
\MQL
ND–1.46
\MQL
37.9
5.88–706
85.3
100
36.8
\MQL
25
16.5–58.8
100
77.9
222
34.4–706
100
10.1
34.2
5.88–92.2
ND–1.01
0
ND
ND
ND
0
ND
ND
ND
100
192
111
\MQL
\MQL
61.5
32.5
100
45.1
51.6
23.8–81.1
100
45.2
51.5
11.2–162
DEHP
ND–1.46
0
ND
ND
ND
10
\MQL
\MQL
ND–1.24
DCHP
\MQL
ND–4.35
\MQL
50
\MQL
\MQL
ND–1.04
0
ND
ND
ND
50
\MQL
\MQL
ND–1.36
61.5
0.87
0.12
ND–4.35
57.1
\MQL
\MQL
ND–1.76
15
\MQL
\MQL
ND–1.67
DOP
100
13.3
100
35
P
3
ND not detectable, DR % detection rate, \MQL lower than the MQL (range 0.1–0.45 ng/m for individual phthalate), PHT total concentrations of nine phthalate diesters
Total (n = 60)
Public places (n = 8)
Salons (n = 6)
Schools (n = 6)
Laboratories (n = 13)
Offices (n = 7)
2.18–85.3
56.7
Mean
Homes (n = 20)
Range
DMP
Building type
Table 3 Concentrations of phthalates (ng/m3; sum of particulate and vapor phase concentrations) in indoor air from Albany, New York, USA
PHT
–
390
53.6–4850
778
–
354
486
86.1–1300
–
2600
3050
1570
–
371
373
105–610
–
242
170
49.0–753
–
143
457
45.0–1710
–
732
795
71.9–2820
P
Arch Environ Contam Toxicol
123
Arch Environ Contam Toxicol
Fig. 2 Total median concentrations with range of phthalate diesters
in indoor air from six categories of sampling locations in Albany,
New York, USA. Values in parentheses refer to the number of
samples
molecular-weight phthalates are widely used in cosmetics
and personal care products in the indoor environment
(Hubinger et al. 2006; Koniecki et al. 2011; Guo and
Kannan 2013; Guo et al. 2014).
Human Exposure to Phthalates by Way of Inhalation
Several studies have examined the exposure of humans to
phthalates (Koo and Lee 2005; Calafat and MaKee 2006;
Clark et al. 2011; Guo and Kannan 2011b, 2013; Guo et al.
2012b, 2014; Schecter et al. 2013). The sources of human
exposure to phthalates vary depending on the type of phthalates. For instance, diet is the major source of exposure
Fig. 3 Composition profiles of
six phthalate diesters in indoor
air samples from six types of
locations in Albany, New York,
USA. DNHP, DCHP, and DOP
were found less frequently, and
their median concentrations
were lower than the MQL;
therefore, they are not included
here
123
for DEHP, whereas dermal and inhalation pathways are the
major sources of exposure to DEP and DBP (Guo et al.
2014). The contribution of indoor air to phthalate exposure
has not been determined previously. We calculated the exposure dose to phthalates through the inhalation of indoor air
by multiplying the measured concentrations (lg/m3) with
the volume of air inhaled (m3). The average air inhalation
rate by adults and children was 0.54 m3/h (13 m3/d) (CEPA
1994). The estimated median inhalation exposure dose to
total phthalates in homes, offices, laboratories, schools, salons (hair and nail salons), and public places were 9.52, 1.86,
2.21, 4.82, 33.8, and 4.60 lg/d, respectively. Among various categories of sampling locations, salons contributed to
the highest exposure doses. The overall median value for
inhalation exposure to phthalates through indoor air
(n = 60) was 5.07 lg/d.
The daily inhalation exposure dose of phthalates was calculated for various age groups (Table 4). The calculated daily
inhalation exposure doses of total phthalates for infants, toddlers, children, teenagers, and adults were 0.845, 0.423, 0.203,
0.089, and 0.070 lg/kg-bw/d, respectively. These results
suggest that phthalate inhalation exposure doses decrease with
an increase in age. For DEP, inhalation was the major source
of exposure at an exposure dose of 0.027–0.329 lg/kg-bw/d,
which was followed by that of DBP (range 0.011–0.137 lg/
kg-bw/d), DIBP (range 0.009–0.106 lg/kg-bw/d), and DEHP
(range 0.007–0.082 lg/kg-bw/d).
Several earlier studies in our laboratory estimated human exposure to phthalates from various sources in the
United States (Guo and Kannan 2011b, 2012a, 2013; Guo
et al. 2012b, Guo et al. 2014; Schecter et al. 2013). The
contribution of human exposure to phthalates through indoor air inhalation was compared with doses calculated
from other exposure pathways (Table 5). The inhalation
exposure dose was similar to that calculated through dust
ingestion (0.186–1.7 lg/kg-bw/d) (Guo and Kannan
Arch Environ Contam Toxicol
Table 4 Human exposure to individual phthalate diesters through indoor air inhalation in Albany, New York, USA (lg/kg-bw/d)a
P
Age category
DMP
DEP
DIBP
DBP
BzBP
DEHP
Exposure
Infants
0.075
0.329
0.106
0.137
0.012
0.082
0.845
Toddlers
0.037
0.165
0.053
0.069
0.006
0.041
0.423
Children
0.018
0.079
0.025
0.033
0.003
0.019
0.203
Teenagers
0.008
0.035
0.011
0.014
0.001
0.009
0.089
Adults
0.006
0.027
0.009
0.011
0.001
0.007
0.070
Infants (\1 y) = 6 kg-bw; toddlers (1–3 y) = 12 kg-bw; children (3–11 y)P= 25 kg-bw; teenagers (11–18 y) = 57 kg-bw; adults ([18
y) = 72 kg-bw (Child-Specific Exposure Factors Handbook [USEPA 2008]; Exposure = total daily inhalation exposure dose to nine phthalates by way of indoor air
a
The average inhalation rate of air for all ages is 13 m3/d (CEPA 1994)
Table 5 Comparison of human exposure doses to total phthalates through various pathways (lg/kg-bw/d)*
Exposure route
Infants
Toddlers
Children
Teenagers
Adults
References
Dust ingestion
1.21
1.7
0.468
0.291
0.233
Guo and Kannan (2011b)
Dust dermal absorption
0.001
0.0008
0.0006
0.0005
0.0002
Guo and Kannan (2011b)
PCPs (dermal)a
0.0095
0.0059
–
–
0.013-0.49
Guo and Kannan (2013)
Dietb
–
–
4.68
–
1.03
Schecter et al. (2013)
Indoor air inhalation
0.845
0.423
0.203
0.089
0.070
This study
a
Exposure dose calculated based on the mean concentration of PCPs (rinse-off, leave-on, and baby care products)
b
Values are the mean daily dietary intakes of nine phthalates. Food samples (e.g., beverages, milk, fish, fruit, grain, beef, pork, poultry, meat and
meat products, vegetable oils, and infant food) were collected from Albany, New York
* USEPA reference doses (RfDs) = 200 lg/kg/d for BBzP (USEPA 2012c), 100 lg/kg/d for DBP (USEPA 2012b), 20 lg/kg/d for DEHP
(USEPA 2012c), and 800 lg/kg/d for DEP (USEPA 2012c). The USEPA has not published RfDs for the other phthalates
2011b). The inhalation exposure dose was seven times
lower than the exposure dose calculated through dietary
exposure (1.03 lg/kg-bw/d for adults and 4.68 lg/kg-bw/d
for children) (Schecter et al. 2013). In another study, Guo
and Kannan (2013) reported the daily dermal exposure
dose, based on the mean phthalate concentrations measured
in PCPs from Albany, New York, USA, and the values
were 0.0095, 0.0095, and 0.013–0.49 lg/kg-bw/d for infants, toddlers, and adult females, respectively. Accordingly, the daily exposure dosage of total phthalates from
PCPs was approximately 100 times lower than the inhalation exposure dose. However, it should be noted the
indoor air is an important contributor to DEP exposure. The
exposure dose calculated for individual phthalates through
various pathways was lower than the currently published
USEPA reference doses (USEPA 2012a, 2012a, 2012a,
2012a).
Median concentrations of total phthalates in indoor air
ranged from 143 to 2600 ng/m3, and the highest levels
were found in hair salons. DEP accounted for 40 % of the
total concentrations in indoor air. Inhalation exposure to
phthalates ranged from 0.070 to 0.845 lg/kg-bw/d, and
inhalation is a major source of exposure to DEP. The
current level of phthalate exposure in the United States is
lower than the USEPA’s reference doses. Studies have
reported emission of phthalates from vinyl flooring and
crib mattress covers in homes (Liang and Xu 2014, 2015).
The increase in the use of such products in buildings would
increase the environmental emission and human exposure
to these compounds. This study establishes baseline levels
for future environmental assessment of phthalates.
References
Conclusions
Concentrations of nine phthalate diesters were determined
in 60 indoor air samples from homes, offices, laboratories,
schools, salons (hair and nail salons), and public places
(shopping malls) in Albany, New York, USA, in 2014.
Adibi J, Whyatt R, Camann D, Peki K, Jedrychowski W, Perera F
(2002) Phthalate diester level in personal air samples during
pregnancy in two urban pollutions. Indoor Air 4:177–182
Antian J (1973) Toxicity and health threats phthalate esters: review of
the literature. Environ Health Perspect 4:1–26
Bergh C, Torgrip R, Emenius G, Ostman C (2011) Organophosphate
and phthalate esters in air and settled dust—a multi-location
indoor study. Indoor Air 21:67–76
123
Arch Environ Contam Toxicol
Bergh C, Luongo G, Wise S, Ostman C (2012) Organophosphate and
phthalate esters in standard reference material 2585 organic
contaminants in house dust. Anal Bioanal Chem 402:51–59
Blanchard O, Glorennec P, Mercier F, Bonvallot N, Chevrier C,
Ramalho O et al (2014) Semi-volatile organic compounds in
indoor air and settled dust in 30 French dwelling. Environ Sci
Technol 48:3959–3969
Boberg J, Metzdorff S, Wortziger R, Axelstad M, Brokken L,
Vinggaard AM et al (2008) Impact of diisobutyl phthalate and
other PPAR agonists on steroidogenesis and plasma insulin and
leptin levels in fetal rats. Toxicology 250:75–81
Bornehag CG, Lundgren B, Weschler CJ, Sigsgaard T, HagerhedEngman L, Sundell J (2005) Phthalates in indoor dust and their
association with building characteristics. Environ Health Perspect 113(10):1399–1404
Buck Louis GM, Peterson CM, Chen Z, Croughan M, Sundaram R,
Stanford J et al (2013) Bisphenol A and phthalates and
endometriosis: the endometriosis: natural history, diagnosis and
outcomes study. Fertil Steril 100:162–169
Calafat AM, McKee RH (2006) Integrating biomonitoring exposure
data into the risk assessment process: Phthalates [diethyl
phthalate and di(2-ethylhexyl) phthalate] as a case study.
Environ Health Perspect 114(11):1783–1789
California Environmental Protection Agency (1994) How much air do
we breathe? Brief report to the scientific and technical community.
Available at: Accessed 14 Oct 2014
Cho SC, Bhang SY, Hong YC, Shin MS, Kim BN, Kim JW et al
(2010) Relationship between environmental phthalate exposure
and the intelligence of school-age children. Environ Health
Perspect 118:1027–1032
Clark KE, David RM, Guinn R, Kramarz KW, Lampi MA, Staples
CA (2011) Modeling human exposure to phthalate esters: a
comparison of indirect and biomonitoring estimation methods.
Human Ecol. Risk Assess 17:923–965
Clausen PA, Liu Z, Xu Y, Korfoed-Sørensen V, Little JC (2010)
Influence of air flow rate on emission of DEHP from vinyl
flooring in the emission cell FLEC: measurements and CFD
simulation. Atmos Environ 44:2760–2766
Clausen PA, Liu Z, Kofoed-Søorensen V, Little J, Wolkoff P (2012)
Influence of temperature on the emission of di-(2-ethylhexyl)
phthalate (DEHP) from PVC flooring in the emission cell PLEC.
Environ Sci Technol 46:909–915
Cousins AP, Holmgren T, Remberger M (2014) Emissions of two
phthalate esters and BDE-209 to indoor air and their impact on
urban air quality. Sci Total Environ 470–471:527–535
Engel SM, Miodovnik A, Canfield RL, Zhu C, Silva MJ, Calafat AM
et al (2010) Prenatal phthalate exposure is associate with
childhood behavior and executive functioning. Environ Health
Perspect 118:565–571
Finizio A, Mackay A, Bidleman T, Harner T (1997) Octanol-air
partition coefficient as a predictor of partitioning of semi-volatile
organic chemicals to aerosols. Atmos Environ 31:2289–2296
Fromme H, Lahrz T, Piloty M, Gebhart H, Oddoy A, Ruden H (2004)
Occurrence of phthalate and musk fragrances in indoor air and
dust from apartments and kindergartens in Berlin (Germany).
Indoor Air 14:188–195
Fromme H, Lahrz T, Hainsch A, Oddoy A, Piloty M, Ru¨den H (2005)
Elemental carbon and respirable particulate matter in the indoor
air of apartments and nursery schools and ambient air in Berlin
(Germany). Indoor Air 15:335–341
Gaspar FW, Castorina R, Maddalena RL, Nishioka MG, McKone TE,
Bradman A (2014) Phthalate exposure and risk assessment in
California child care. Environ Sci Technol 48:7593–7601
Gray LE, Laskey J, Ostby J (2006) Chronic di-n-butyl phthalate
exposure in rats reduces fertility and alters ovarian function
123
during pregnancy in female long Evans hooded rats. Toxicol Sci
93(1):189–195
Guo Y, Kannan K (2011) Comparative assessment of human exposure
to phthalate esters from house dust in China and the United
States. Environ Sci Technol 45:3788–3794
Guo Y, Kannan K (2012) Challenges encountered in the analysis of
phthalate esters in foodstuffs and other biological matrices. Anal
Bioanal Chem 404(9):2539–2554
Guo Y, Kannan K (2013) A survey of phthalates and parabens in
personal care products from the United States and its implications for human exposure. Environ Sci Technol 47:14442–14449
Guo Y, Alomirah H, Cho HS, Minh TB, Mohd MA, Nakata H et al
(2011a) Occurrence of phthalate metabolites in human urine from
several Asian countries. Environ Sci Technol 45:3138–3144
Guo Y, Wu Q, Kannan K (2011b) Phthalate metabolites in urine from
China, and implications for human exposures. Environ Int
37:893–898
Guo Y, Zhang Z, Liu L, Li Y, Ren N, Kannan K (2012) Occurrence
and profiles of phthalates in foodstuffs from China and their
implications for human exposure. J Agric Food Chem
60:6913–6919
Guo Y, Wang L, Kannan K (2014) Phthalates and parabens in
personal care products from China: concentrations and human
exposure. Arch Environ Contam Toxicol 66:113–119
Hauser R, Calafat AM (2005) Phthalates and human health. Occup
Environ Med 62:806–818
Hubinger JC, Havery DC (2006) Analysis of consumer cosmetic
products for phthalate esters. J Cosmet Sci 57:127–137
Kanazawa A, Saito I, Araki A, Takeda M, Ma M, Saijo Y et al (2010)
Association between indoor exposure to semi-volatile organic
compounds and building-related symptoms among the occupants
of residential dwellings. Indoor Air 20:72–84
Kawamura Y, Nakajima A, Mutsuga M, Yamada T, Maitani T (2001)
Residual chemical in silicone rubber products for food contact
use. Shokuhin Eiseigaku Zasshi 2:316–321
Koniecki D, Wang R, Moody RP, Zhu J (2011) Phthalates in cosmetic
and personal care products: concentrations and possible dermal
exposure. Environ Res 111:329–336
Koo HJ, Lee BM (2005) Human monitoring of phthalates and risk
assessment. J Toxicol Environ Health A 68(16):1379–1392
Kubwabo C, Rasmussen PE, Fan X, Kosarac I, Wu F, Zidek A et al
(2013) Analysis of selected phthalates in Canadian indoor dust
collected using household vacuum and standardized sampling
techniques. Indoor Air 23:506–514
Liang Y, Xu Y (2014) Emission of phthalates and phthalate
alternatives from vinyl flooring and crib mattress covers: the
influence of temperature. Environ Sci Technol 48:14228–14237
Liang Y, Xu Y (2015) The influence of surface sorption and air flow
rate on phthalate emissions from vinyl flooring: measurement
and modeling. Atmos Environ 103:147–155
Lin S, Ku HY, Su PH, Chen JW, Huang PC, Angerer J et al (2011)
Phthalate exposure in pregnant women and their children in
central Taiwan. Chemosphere 82:947–955
Pei XQ, Song M, Guo M, Mo FF, Shen XY (2013) Concentration and
risk assessment of phthalates present in indoor air from newly
decorated apartments. Atmos Environ 68:17–23
Rudel RA, Perovich LJ (2009) Endocrine disrupting chemicals in
indoor and outdoor air. Atmos Environ 43:170–181
Rudel RA, Camann DE, Spengler JD, Korn LR, Brody JG (2003)
Phthalates, alkylphenols, pesticides, polybrominated diphenyl
ethers, and other endocrine-disrupting compounds in indoor air
and dust. Environ Sci Technol 37(20):4543–4553
Schecter A, Lorber M, Guo Y, Wu Q, Yun SH, Kannan K et al (2013)
Phthalate concentrations and dietary exposure from food
purchased in New York state. Environ Health Perspect
121:473–479
Arch Environ Contam Toxicol
Schossler P, Schripp T, Salthammer T, Bahadir M (2011) Beyond
phthalates: Gas phase concentration and modeled gas/particle
distribution of modern plasticizers. Sci Total Environ 409:4031–
4038
Turpin BJ, Lim HJ (2001) Species contributions to PM2.5 mass
concentrations: revisiting common assumptions for estimating
organic mass. Aerosol Sci Technol 35:602–610
United States Environmental Protection Agency (2008) Child-specific
exposure factors handbook (final report). Available at: http://
cfpub.epa.gov/ncea/cfm/recordisplay.cfm?deid=199243
United States Environmental Protection Agency (2012a) Butyl benzyl
phthalate (CASRN 85-68-7). Available at: />iris/subst/0293.htm. Accessed 26 Nov 2012
United States Environmental Protection Agency (2012b) Dibutyl
phthalate (CASRN 84-74-2). Available at: />iris/subst/0038.htm. Accessed 15 Mar 2012
United States Environmental Protection Agency (2012c) Di(2-ethylhexyl)phthalate (DEHP) (CARSN 117-81-7). Available at:
Accessed 15 Mar 2012
United States Environmental Protection Agency (2012d) Diethyl
phthalate (CASRN 84-66-2). Available at: />iris/subst/0226.htm Accessed 15 Mar 2012
Weschler CJ, Nazaroff WW (2010) SVOC partitioning between the gas
phase and settled dust indoors. Atmos Environ 44:3609–3620
Weschler CJ, Salthammer T, Fromme H (2008) Partitioning of
phthalates among the gas phase, airborne particles and settled
dust in indoor environments. Atmos Environ 42:1449–1460
123