DSpace at VNU: Persistent organic pollutants in Vietnam: Environmental contamination and human exposure
Bạn đang xem bản rút gọn của tài liệu. Xem và tải ngay bản đầy đủ của tài liệu tại đây (1.71 MB, 78 trang )
Rev Environ Contam Toxicol 193:213–285
© Springer 2008
Persistent Organic Pollutants in Vietnam:
Environmental Contamination and
Human Exposure
Tu Binh Minh, Hisato Iwata, Shin Takahashi, Pham Hung Viet,
Bui Cach Tuyen, and Shinsuke Tanabe
Contents
I. Introduction ......................................................................................................
II. Production and Use .........................................................................................
III. Contamination Status ......................................................................................
A. Air, Water, Sediments, and Soils ............................................................
B. Biological Samples ....................................................................................
C. Foodstuffs ...................................................................................................
D. Human Exposure .......................................................................................
E. Dioxin Contamination ..............................................................................
IV. Environmental Behavior and Bioaccumulation ..........................................
A. Transport Behavior in Tropical Environments .....................................
B. Bioaccumulation in Biota .........................................................................
V. Temporal Trends .............................................................................................
VI. Environmental and Human Health Implications ........................................
VII. Conclusions and Recommendations .............................................................
Summary ...........................................................................................................
Acknowledgments ...........................................................................................
References ........................................................................................................
213
215
216
216
230
242
243
244
269
269
272
273
277
282
284
284
285
I. Introduction
Global contamination and toxic effects of persistent organic pollutants
(POPs) have been an emerging environmental issue and have received
considerable attention during the past four decades. Although the extent
of contamination by POPs has been dominant in industrialized nations, an
Communicated by G.W. Ware.
T.B. Minh, H. Iwata, S. Takahashi, S. Tanabe (
)
Center for Marine Environmental Studies (CMES), Ehime University, Bunkyo-cho 2-5, Matsuyama 790-8577, Japan.
P.H. Viet
Center for Environmental Technology and Sustainable Development (CETASD), Hanoi
National University, 334 Nguyen Trai Street, Thanh Xuan, Hanoi, Vietnam.
B.C. Tuyen
Nong Lam University, Linh Trung, Thu Duc District, Hochiminh City, Vietnam.
213
214
T.B. Minh et al.
increasing number of recent investigations have highlighted the role of the
Asia-Pacifi
fic region as a potential source of emission for these chemicals,
particularly to pristine areas such as the Arctic and the Antarctic (Tanabe
et al. 1994; Tanabe 2000, 2002; Tanabe and Subramanian 2006).
In view of environmental contamination, Vietnam has been well known
as a land of extensive spraying of Agent Orange during the Vietnam War.
The high degree of dioxin contamination in some military bases and Agent
Orange-sprayed areas in South Vietnam has received particular attention
during the past 30 years. In addition to the dioxin contamination caused by
Agent Orange, the rapid agricultural and industrial growth in this country
lends credence to the widespread contamination of POPs. Vietnam is
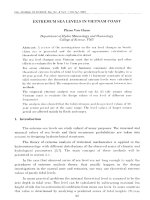
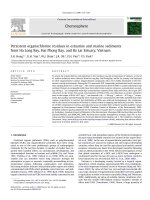
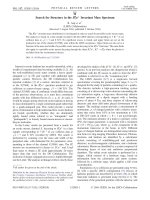
located at the center of the Southeast Asian region (Fig. 1); it has more
than 300 km of coastal area and two major agricultural production areas:
the Red River Delta in the north and the Mekong River Delta in the south.
These two deltas are inhabited by more than 30 million people and are two
of the most densely populated areas in the world. The Mekong River Delta
has recently become one of the most productive agricultural regions of
Southeast Asia. Such a strategic geographical position and the rapid
agricultural development of Vietnam made this country an important
region where extensive studies on environmental pollution have been
carried out during the last two decades.
This chapter provides a comprehensive review of the studies dealing with
POPs in Vietnam. Available data on POP contamination in Vietnam are
compiled on the basis of various investigations in the framework of the
Red River Delta
Pacific Ocean
China
India
South
China
Sea
Philippines
Malaysia
a
Indonesia
sia
a
Mekong
River Delta
Fig. 1. Map of Vietnam. Vietnam is located at the center of the Southeast Asian
region: it has two the largest deltas, Red River Delta and Mekong River Delta.
Organic Pollutants in Vietnam
215
Asia-Pacifi
fic Mussels Watch Program, the 21st Century Center of Excellence
Program, and the Core University Program supported by the Japan Society
for the Promotion of Science (JSPS), which were conducted in our
laboratory during the past decade. Results of these comprehensive studies
are reviewed, and various issues of POPs contamination in Vietnam are
discussed in a comparative point of view with the other countries in
the Asia-Pacifi
fic region. In addition, results from other laboratories are
also reviewed to help improve insights into the distribution, transport,
bioaccumulation, and possible toxic implications on environmental quality
and human health. This review focuses on the organochlorine insecticides
such as 1,1,1-trichloro-2,2-bis(p
( -chlorophenyl)ethane (DDT) and its
metabolites (DDTs), hexachlorocyclohexane isomers (HCHs), chlordane
compounds (CHLs), and hexachlorobenzene (HCB). Residue levels of
industrially derived contaminants such as polychlorinated biphenyls (PCBs),
polychlorinated dibenzo-p
- -dioxins and dibenzofurans (PCDD/Fs), and
polybrominated biphenyl ethers (PBDEs) are also reviewed.
II. Production and Use
In general, information on the production and usage of POPs, particularly
organochlorine (OC) insecticides and PCBs in Vietnam, as well as some
other developing countries in the East and South Asian region, is still
limited or obscure. Systematic inventory of toxic manmade chemicals is
lacking in these countries because of their limited capacity to conduct comprehensive monitoring surveys. Recently, the United Nations Environment
Program (UNEP) has initiated various monitoring programs for POPs at
regional and global levels, and the results have been summarized at different
workshops. According to these reports, the active ingredients for insecticides
were not produced in Vietnam. In fact, before 1985, pesticides such as DDT
and HCB were imported from the former Soviet Union and some socialistic
countries up to a quantity of 6,500–9,000 t/yr (Sinh et al. 1999). The statistical
data showed that the total quantity of DDT imported into Vietnam for
malaria control from 1957 to 1990 was 24,042 t. During 1986–1990,
approximately 800 t was used (Sinh et al. 1999). These amounts are still
lower than those in some other countries in regions such as Malaysia,
Indonesia, and India. DDT usage for malaria control ceased in Vietnam in
1995, and other insecticides such as pyrethroid compounds have been used
as substitutes for DDT (Sinh et al. 1999).
The information on PCB usage in Vietnam is still obscure. Data indicate
that about 27,000–30,000 t of oils contaminated by PCBs were imported
from the former USSR, China, and Rumania (Sinh et al. 1999). In addition,
electrical equipment containing PCBs, such as transformers, was also
imported from Australia until the mid-1980s (Kannan et al. 1995). Yet
another possible source of PCBs in Vietnam are the weapons used
extensively during the Indochina War (Thao et al. 1993a,b). The major
216
T.B. Minh et al.
source of dioxins in Vietnam in the past was Agent Orange and other
herbicides sprayed in South Vietnam during the American war. Recently,
Stellman and coworkers (Stellman et al. 2003) provided revised estimates
of the amounts of herbicides used in Vietnam. During 1961–1971, at least
about 45 million L Agent Orange was sprayed (Stellman et al. 2003). 2,4,5T, a constituent of Agent Orange, is known to be contaminated with 2,3,7,8tetrachlorodibenzo-p
- -dioxin (TCDD). However, the combustion-derived
sources of dioxins in Vietnam are unknown. Various kinds of combustion
processes may facilitate the widespread contamination of dioxins and
related compounds in Vietnam.
III. Contamination Status
A. Air, Water, Sediments, and Soils
Comprehensive monitoring surveys have been conducted to examine the
distribution of POPs such as PCBs, DDTs, HCHs, and HCB in air, water,
and sediments from estuarine environments from various countries in
the Asia-Pacifi
fic comprising Japan, India, Vietnam, Thailand, Indonesia,
Malaysia, the Philippines, and Australia (Iwata et al. 1994). These
investigations reported the presence of higher residues of DDTs and HCHs
in air and water from coastal and estuarine areas in the developing countries
of tropical and subtropical regions (India, Thailand, and Vietnam), than in
developed nations (Japan and Australia). A compilation of available data
for Vietnam is given in Tables 1 and 2. The distribution in air, water, and
sediments from north, middle, and south regions of Vietnam showed
relatively higher DDT concentrations, supporting the concept of widespread
contamination of this insecticide throughout the country. This result suggests
extensive use of DDT for agricultural purposes in the past and for malaria
control until very recently. Interestingly, in a survey conducted about 10 yr
later than the survey by Iwata et al. (1994) (in 1998/1999) covering an
extended area along Red River and Duong River, the two biggest rivers in
northern Vietnam, elevated concentrations of DDTs, HCHs, and CHLs
were reported (Hung and Thiemann 2002). The levels of DDTs, HCHs,
and CHLs in Red River and Duong River were apparently higher than
those reported in the early 1990s surveys. In addition, wastewater collected
from extensive human activity areas such as canals of Tu Liem district, a
suburb of Hanoi city (northern Vietnam), and Thi Nghe River, Hochiminh
(southern Vietnam) contained elevated concentrations of DDTs (see Table
1). It is also interesting to note that levels found in a recent survey (in
suburb Hanoi; Hung and Thiemann 2002) were higher than those reported
a decade ago (Iwata et al. 1994). Although backgrounds of analytical
methods and sampling locations are different among studies, these
observations suggest that the use of DDT for malaria control was relatively
extensive until very recently in both northern and southern Vietnam.
1998–1999
Groundwater
Mean (range).
1998/99
River water
a
1998/99
Lake water
Lakes in Hanoi: West Lake,
Thuyen Quang Lak
Bay Mau Lake and Ba Mau
Lake
Dry season
Rainy season
Irrigation canal, Tu Liem,
suburb Hanoi
Dry season
Rainy season
Wells, Gia Lam, suburb
Hanoi
Dry season
Rainy season
1
1990
25
0.6
0.55
0.68
0.29
1.1
4.7
DDTs
a
21 (0.81–110)
27 (1.6–130)
1
0.16
0.13
0.045
0.21
0.07
0.55
CHLs
7.2 (1.6–1.8)
17 (5.5–26)
6.9 (6.0–7.5)
15 (1.2–25)
0.69 (0.26–2.16) 2.9 (1.1–4.8)
32 (0.69–120)
13 (2–51)
17 (1.6–83)
29 (3.1–97)
19
9.5
5.2
3.2
18
1.9
31
HCHs
2 0.17 (0.11–0.23) 0.21 (0.19–0.22) 0.17
2 0.09
0.04
<0.5
6 59 (8.2–130)
6 50 (11–110)
4 2.1 (0.21–3.6)
4 5.1 (0.65–15)
18 44 (0.55–320)
18 56 (8.4–230)
1
1
1990
1990
1998/99
1
1
1
1
n
1990
1990
1900
1990
Year
River water
Lake water
River water
Estuarine
water
River water
Estuarine
water
Estuarine
water
River water
Sample
Red River, Hanoi
Phu Loc Lake, Hue
Huong River, Hue
Nha Be River, Hochiminh
City
Gua canal, Cu Chi
Long Tau River,
Hochiminh City
Thi Nghe canal, Hochiminh
City
Red River and Duong River,
northern Vietnam
Dry season
Rainy season
Location
Table 1. Concentrations (ng L−1) of Persistent Organochlorines in Water from Vietnam.
—
—
—
—
—
—
—
—
8
1.9
0.57
0.84
1.2
1.6
2.7
PCBs
Hung and
Thiemann 2002
Hung and
Thiemann 2002
Hung and
Thiemann 2002
Hung and
Thiemann 2002
lwata et al. 1994
lwata et al. 1994
lwata et al. 1994
lwata et al. 1994
lwata et al. 1994
lwata et al. 1994
lwata et al. 1994
Reference
DDTs: sum of p,p′-DDE, p,p′-DDD
and p,p′-DDT
HCHs: sum of α-, β-, and γ-HCH
γ
CHLs: sum of cis-chlordane, transchlordane, cis-nonachlor, transnonachlor and oxychlordane
PCBs: quantifi
fied by an equivalent
mixture of Kanechlor preparations
(KC-300, KC-400, KC-500 and
KC-600)
DDTs: sum of p,p′-DDE, p,p′-DDD,
p,p′-DDT, o,p′-DDE, o,p′-DDD,
o,p′-DDT
HCHs: sum of α-, β-, γγ , and δ-HCH
CHLs: sum of heptachlor and
heptachlorepoxide
Remarks
Organic Pollutants in Vietnam
217
218
T.B. Minh et al.
Table 2. Concentrations (ng g−1 dry wt) of Persistent Organochlorines in Sediments
and Soils From Vietnam.
Location
Sample/sampling site
characteristic
Year
n
DDTs
Phu Da, Hue
Sediment, paddy field
1990
1
0.52
A Luoi, Binh Tri Thien
Sediment, municipal
sewage
Sediment, paddy fi
field
1990
1
68
1990
1
8
Sediment, paddy fi
field
1990
1
1
Don Canal, Duyen Hai
Sediment, paddy fi
field
1990
1
3.3
La Canal, Duyen Hai
Sediment, paddy fi
field
1990
1
10
Ben Nghe Canal, Hochiminh
City
Tan Binh, Tay Ninh
Sediment, municipal
sewage
Sediment, paddy fi
field
1990
1
120
1990
1
7.8
Gua Canal, Cu Chi
Sediment, paddy fi
field
1990
1
0.37
Song Long Tau, Duyen Hai,
Sediment, paddy field
Hochiminh City
Thi Nghe Canal, Hochiminh
Sediment, municipal
City
sewage
Thinh Liet, Thanh Tri, Hanoi Soil, paddy fi
field
1990
6
17 (2.1–47)
1990
3
530 (360–790)
1990
1
330
Vinh Quynh, Thanh Tri,
Hanoi
Yen Duyen, Thanh Tri,
Hanoi
Phu Da, Binh Tri, Thien
Soil, paddy fi
field
1990
2
76 (31–120)
Soil, paddy fi
field
1990
2
47 (19–74)
Soil, paddy fi
field
1990
1
38
Hong Ha, A luoi, Binh Tri,
Thien
Ta Bat, Aluoi, Binh Tri,
Thien
Son Thuy, Aluoi, Binh Tri,
Thien
Hong Kim, Aluoi, Binh Tri,
Thien
An Hoa, Hue
Soil, paddy field
fi
1990
1
23
Soil, paddy field
fi
1990
1
11
Soil, paddy field
fi
1990
1
1300
Soil, paddy field
fi
1990
1
Soil, paddy fi
field
1990
1
69
Phu Loc, Hue
Soil, upland
1990
4
1.9 (0.73–4.4)
Binh Khanh, Duyen Hai,
Hochiminh City
Tan Thuan, Nha Be,
Hochiminh City
My Hung, Cu Chi
Soil, paddy fi
field
1990
2
27 (24–30)
Soil, paddy field
fi
1990
1
64
Soil, paddy fi
field
1990
1
Long Giang Canal, Duyen
Hai
Lo Giang River, Duyen Hai
9.7
7.9
Organic Pollutants in Vietnam
219
HCHs
CHLs
PCBs
Reference
Remarks
0.43
0.072
0.65
2.4
0.79
0.18
1.1
0.42
3.7
0.45
0.15
2.2
0.94
0.21
2.1
2.3
0.58
9.7
5.2
8.8
0.7
0.31
—
DDTs: sum of p,p′-DDE,
p,p′-DDD and
p,p′-DDT
HCHs: sum of α-, β-, and
γ
γ-HCH
CHLs: sum of cischlordane, transchlordane,
cis-nonachlor, transnonachlor and
oxychlordane
PCBs: quantified
fi by an
equivalent mixture of
Kanechlor preparations
(KC-300, KC-400, KC500 and KC-600)
0.63
0.24
0.22
Iwata et al.
1994
Iwata et al.
1994
Iwata et al.
1994
Iwata et al.
1994
Iwata et al.
1994
Iwata et al.
1994
Iwata et al.
1994
Iwata et al.
1994
Iwata et al.
1994
Iwata et al.
1994
Iwata et al.
1994
Thao et al.
1993
Thao et al.
1993
Thao et al.
1993
Thao et al.
1993
Thao et al.
1993
Thao et al.
1993
Thao et al.
1993
Thao et al.
1993
Thao et al.
1993
Thao et al.
1993
Thao et al.
1993
Thao et al.
1993
Thao et al.
1993
0.82 (0.5–1.3)
8.5 (6.0–12)
0.26 (0.14–0.46)
20 (19–20)
140
6.2 (2.3–8.9)
570 (440–630)
18
—
39
30 (4–55)
—
11 (5.5–17)
1.8 (1.3–2.3)
—
21 (13–28)
2.8
—
8.6
4.7
—
5.2
1.4
—
2.6
5.7
—
0.31
—
0.61
5.3
—
5
0.15 (0.09–0.21)
—
2.1 (1.4–4.0)
1.5 (1.4–1.5)
—
3.9 (1.6–6.1)
4
—
12
0.23
—
12
1.5
DDTs: sum of p,p′-DDE,
p,p′-DDD, p,p′-DDT,
o,p′-DDT
HCHs: sum of α-, β-, γγ
and δ-HCH
CHLs: sum of cischlordane, transchlordane,
cis-nonachlor, transnonachlor and
oxychlordane
PCBs: quantified
fi by an
equivalent mixture of
Kanechlor preparations
(KC-300, KC-400, KC500 and KC-600)
220
T.B. Minh et al.
Table 2. (cont.)
Location
Sample/sampling site
characteristic
Year
n
DDTs
Ba Diep, Hooc Mon
Soil, upland
1990
1
280
An Phu, Cu Chi
Soil, upland
1990
3
14 (1.9–37)
Tan Binh, Tan Bien, Tay
Ninh
Thanh Phu, Tan Bien, Tay
Ninh
Duong Minh Chau, Tay Ninh
Soil, paddy field
fi
1990
1
Soil, paddy field
fi
1990
1
Soil, paddy fi
field
1991
1
1.9
Duong Minh Chau, Tay Ninh
Soil, green bean fi
field
1991
1
2.4
Tan Bien, Tay Ninh
Soil, paddy fi
field
1991
1
6.6
Hoa Thanh, Tay Ninh
1991
1
5.1
1991
1
1.6
Tan Chau, Tay Ninh
Soil, sugarcane and
peanut
Soil, rubber
plantation
Soil, sugarcane
1991
1
Tan Chau, Tay Ninh
Soil, harvested crop
1991
5
Tan Bien, Tay Ninh
Soil, paddy fi
field
1991
1
Go Dau, Tay Ninh
Soil, harvested crop
1991
1
130
Trang Bang, Tay Ninh
Soil, harvested crop
1991
1
150
Duong Minh Chau, Tay Ninh
Non-cultivated soil
1991
1
Tan Bien, Tay Ninh
1991
1
1991
1
Tan Bien, Tay Ninh
Non-cultivated soil,
Former US air base
ground
Non-cultivated soil,
US bombed site
Non-cultivated soil
1991
6
11 (0.25–38)
Tan Uyen, southern Vietnam
Non-cultivated soil
1991
2
14 (2.0–26)
Saigon River, Hochiminh
City
River sediment
1996
11
80 (1.8–250)
Hanoi
Sediment, irrigation
canal, northwest
Hanoi
1995/96
1
DS/RSa
6.9/13
Tan Chau, Tay Ninh
Tan Chau, Tay Ninh
5.5
350
290
88 (1.0–270)
5.7
1.5
13
0.46
Organic Pollutants in Vietnam
HCHs
CHLs
0.79
—
2.3 (1.9–2.5)
—
PCBs
Reference
130
Thao et al.
1993
Thao et al.
1993
Thao et al.
1993
Thao et al.
1993
Thao et al.
1993
Thao et al.
1993
Thao et al.
1993
Thao et al.
1993
Thao et al.
1993
Thao et al.
1993
Thao et al.
1993
Thao et al.
1993
Thao et al.
1993
Thao et al.
1993
3.7 (3.0–4.2)
0.15
—
3.4
—
2
—
2.3
0.57
—
1.8
0.78
—
2.3
1.3
—
1.6
1.4
—
1
0.27
—
0.45
—
34 (0.95–150)
0.92 (0.09–2.3)
1.6
320
0.42
—
1
0.46
—
32
0.47
—
38
0.8
—
5
1.8
—
92
0.95
—
25
0.71 (0.09–1.9)
—
4.8 (0.23–13)
1.3 (0.44–2.1)
—
8.0 (3.1–13)
—
—
220
DS/RS
0.14/0.07
—
DS/RS
4.1/0.98
221
Remarks
Thao et al.
1993
Thao et al.
1993
Thao et al.
1993
Thao et al.
1993
Thao et al.
1993
Phuong et DDTs: sum of p,p′-DDE,
al. 1998
p,p′-DDD and
p,p′-DDT
PCBs: sum of 6 congeners
Nhan et al. DDTs: sum of p,p′-DDE,
1998
p,p′-DDD and
p,p′-DDT
222
T.B. Minh et al.
Table 2. (cont.)
Location
Hanoi
Ba Lat estuary, Red River,
northern Vietnam
Cua Lan estuary, Thai Binh
coast lines, northern
Vietnam
Tra Ly estuary, Thai Binh
coast lines, northern
Vietnam
Diem Dien estuary, Thai
Binh coast lines, northern
Vietnam
Tra Co beach, Mong Cai,
northern coast of Vietnam
Mong Duong, northern coast
of Vietnam
Ha Long, northern coast of
Vietnam
Hai Phong, northern coast of
Vietnam
Ba Lat estuary, northern
coast of Vietnam
Cau Dien, Nhue River,
suburb Hanoi
Nhue River, suburb Hanoi
Nhue River, suburb Hanoi
Hanoi downtown
ToLich River, suburb Hanoi
Thuong Tin, suburb Hanoi
Thuong Tin, suburb Hanoi
Sample/sampling site
characteristic
Year
n
DDTs
Sediment, paddy
field, southwest
fi
Hanoi
Sediment
1995/96
1
7.5/14
1995/96
1
7.1/3
Sediment, intertidal
mudflat
fl areas
1995/96
1
5.8/4.9
Sediment, intertidal
mudflat
fl areas
1995/96
1
7.3/5.1
Sediment, intertidal
mudflat
fl areas
1995/96
1
6.2/4.6
1997
1 (pooled)
10
1997
1 (pooled)
8.1
1997
1 (pooled)
7.2
1997
1 (pooled)
6.7
1997
1 (pooled)
6.3
1997
2
1997
1
1997
1
21
1997
1
13
1997
2
59 (36–81)
1997
2
37 (24–50)
1997
1
Marine sediment,
intertidal mudflat
fl
areas
Marine sediment,
intertidal mudflat
fl
areas
Marine sediment,
intertidal mudflat
fl
areas
Marine sediment,
intertidal mudflat
fl
areas
Marine sediment,
intertidal mudflat
fl
areas
Sediment, canal,
densely populated
industrial area
Sediment, canal, rural
area
Sediment, canal
Sediment, canal,
densely populated
industrial area
Sediment, canal,
densely populated
industrial area
Sediment, canal,
southern Hanoi
city
Sediment, canal, rural
area, southern
Hanoi city
43 (15–71)
8.3
7.4
Organic Pollutants in Vietnam
223
HCHs
CHLs
PCBs
Reference
0.41/0.16
—
6.0/1.3
0.5/0.05
—
1.1/0.7
0.48/0.025
—
0.87/0.41
Nhan et al. PCBs: quantified
fi by
1998
Arochlor 1260
HCHs: γγ-HCH only
Nhan et al.
1998
Nhan et al.
1998
0.62/0.13
—
0.36/0.32
Nhan et al.
1998
0.36/0.11
—
0.23/0.11
Nhan et al.
1998
34
—
22
4.1
—
0.51
1.8
—
11
1.7
—
18
1.2
—
0.34 (0.09–0.58)
—
0.78
—
0.32
—
0.44
—
2.0 (0.85–3.12)
—
1.3 (0.59–1.98)
—
0.65
—
0.33
Remarks
Nhan et al. DDTs: sum of p,p′-DDE,
1999
p,p′-DDD and
p,p′-DDT
Nhan et al. HCHs: sum of α-, β, and
1999
γ
γ-HCH
PCBs: sum of 13
congeners
Nhan et al.
1999
Nhan et al.
1999
Nhan et al.
1999
1.7 (0.97–2.51) Nhan et al. DDTs: sum of p,p′-DDE,
2001
p,p′-DDD, p,p′-DDT,
o,p′-DDE, o,p′-DDD,
0.74
Nhan et al.
o,p′-DDT and DDMU
2001
PCBs: sum 13 congeners
18
Nhan et al. HCHs: sum of α-, β, and
γ
γ-HCH
2001
5.3
Nhan et al. CHLs: sum cis-chlordane,
trans-chlordane &
2001
trans-nonacl
29 (24–34)
Nhan et al.
2001
20 (16–24)
3.1
Nhan et al.
2001
Nhan et al.
2001
224
T.B. Minh et al.
Table 2. (cont.)
Location
Gia Lam, suburb Hanoi
Dong Anh, suburb Hanoi
Ha Long Bay, northern
Vietnam
Viet Tri, northern Vietnam
Hanoi
Hanoi
Hochiminh City
Hochiminh City
Canal, Can Tho, Mekong
River, southern Vietnam
Hau River, Mekong River
delta, southern Vietnam
Canals, Hochiminh city,
Saigon River, southern
Vietnam
Saigon River, Hochiminh
City
Saigon River, downstream
and coastal areas
a
Dry season/rainy season.
b
Mean (range).
Sample/sampling site
characteristic
Year
n
DDTs
Sediment, canal, rural
area, eastern Hanoi
city
Sediment, canal, rural
area, northern
Hanoi city
estuary sediment
1997
1
17
1997
1
23
1998
—
28
Industrial areas
Soils, municipal
dumping sites
Soils, reference areas
relative to the
municipal dumping
sites
Soils, municipal
dumping sites
Soils, reference areas
relative to the
municipal dumping
sites
Sediment, canals in
Cantho city
1998
1999–01
—
7
5.2
19 (1.9–52)b
1999–01
3
3.2 (2.2–4.3)
1999–01
6
23 (1.1–83)
1999–01
3
3.8 (0.41–10)
2003–04
4
2.8 (1.8–4.3)
2003–04
7
0.96 (0.043–1.9)
Sediment, canals,
densely populated
areas
Sediment, river
2004
5
37
2004
5
6.9
Sediment,
downstream and
coastal area
2004
9
1.2
Sediment, river
Organic Pollutants in Vietnam
HCHs
CHLs
PCBs
0.46
—
1.9
Reference
225
Remarks
Nhan et al.
2001
0.07
—
1.8
Nhan et al.
2001
6.1
—
37
Viet et al.
2000
0.68
—
2.3
Viet et al.
2000
0.83 (0.29–2.2)
12 (2.2–20)
Minh et al. DDTs: sum of p,p′-DDE,
0.45 (<0.01–1.4)
2004
p,p′-DDD, and
0.14 (0.11–0.16) 0.15 (0.11–0.18) 0.73 (0.45–1.1) Minh et al.
p,p′-DDT
2004
HCHs: sum of α-, β-, and
γ
γ-HCH
0.37 (0.21–0.87)
1.3 (0.15–2.5)
22 (4.2–40)
Minh et al.
CHLs: sum of cis2006a
chlordane, trans0.36 (0.32–0.43)
0.2 (0.16–0.25)
3.6 (2.5–4.4)
Minh et al.
chlordane,
2006a
cis-nonachlor, transnonachlor and
oxychlodane
PCBs: quantifi
fied by an
equivalent mixture of
Kanechlor preparations
(KC-300, KC-400, KC500 and KC-600)
1.8 (0.12–3.7) Iwata et al. DDTs: sum of p,p′-DDE,
0.04 (<0.02–0.11) 0.2 (0.12–0.35)
2004
p,p′-DDD, and
0.06 (0.025–0.13) 0.21 (0.12–0.54) Iwata et al.
p,p′-DDT
<0.02–0.044
2004
HCHs: sum of α-, β-, and
γ
γ-HCH
—
—
81
Iwata et al. CHLs: sum of cis2005
chlordane, trans—
—
8.5
Iwata et al.
chlordane,
2005
cis-nonachlor, and
trans-nonachlor
—
—
0.92
Iwata et al.
PCBs: quantifi
fied by an
2005
equivalent mixture of
Kanechlor preparations
(KC-300, KC-400, KC500 and KC-600)
226
T.B. Minh et al.
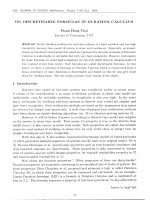
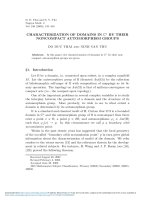
Geographical distribution of OCs in sediments from Vietnam showed
little variability compared to air and water (Fig. 2, Table 2). Consistent
results were also observed in a wide area when considering distribution in
the Asia-Pacifi
fic region (Iwata et al. 1994). Another survey also indicated
rather uniform distribution of DDTs in sediments along the coasts of
northern Vietnam, from the sites near the border of China down toward
the Red River estuary (see Table 2; Nhan et al. 1998, 1999). Shorter
residence time in the water phase and rapid volatilization of POPs from
sediments as a consequence of the high temperatures in tropical region
could be reasons for this uniform distribution (Iwata et al. 1994; Tanabe
2000). However, an interesting result was observed for HCHs, showing
relatively higher concentrations in Mong Cai, a site near the border of
China, than other locations toward the southern areas (see Fig. 2, Table 2).
China has been known as one of the top global HCH users (Li 1999), and
this may be the reason for such high concentrations in Mong Cai.
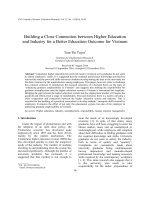
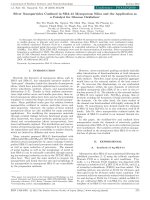
A recent study in the Sai Gon–Dong Nai River that examined residue
concentrations of POPs in sediments collected from the canals of the
metropolitan area in Hochiminh, the river, and downstream toward the
coastal areas showed an interesting geographical distribution (Fig. 3) (Minh
TB et al. 2005; Minh NH et al. 2007a). Concentrations of DDTs and PCBs
were found to be highest in sediments from the city canals and showed an
apparent decreasing trend toward the river and coastal areas. Residues in
sediments collected from downstream and coastal areas were much lower
than those in sediments from the river and city canals. This result clearly
demonstrated the role of the urban areas in Hochiminh City with extensi
g. 2. Distribution of persistent organochlorines in sediment from various locations in Vietnam (Iwata et al. 1994; Nhan et al. 1998, 1999).
Organic Pollutants in Vietnam
227
Fig. 3. Distribution of DDTs and PCBs in sediments from Sai Gon–Dong Nai River
region, southern Vietnam (Minh TB et al. 2005; Minh NH et al. 2007a).
g. 4. Composition of DDT compounds in sediments from Sai Gon–Dong Nai
River region, southern Vietnam (Minh TB et al. 2005; Minh NH et al. 2007a).
results on compositions of DDT compounds also further substantiate our
findings (Fig. 4). Proportions of p,p′-DDT to total DDTs concentrations
fi
were found to be the highest in sediments collected from canals of
metropolitan areas, followed by those in the sediments from the river and
coastal areas. It is known that a higher proportion of p,p′-DDT indicates
more recent residues of DDTs in the environment and biota (Strandberg
et al. 1998).
This accumulation pattern is in good agreement with the results on
the spatial distribution of total DDT concentrations, showing higher
228
T.B. Minh et al.
contamination in city canals and decreasing trends toward the downstream
and coastal areas. This result therefore suggests more recent input of DDTs
to the urban aquatic environment. In fact, the use of DDT has been offifi
cially prohibited in Vietnam since 1995 (Sinh et al. 1999). However, continuous input of DDT and its metabolites to the environment as well as
their elevated concentrations in humans and wildlife have been recorded
throughout the country (Nhan et al. 2001; Monirith et al. 2003; Minh TB
et al. 2002; Minh NH et al. 2004a).
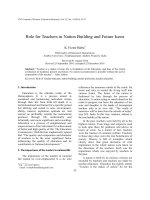
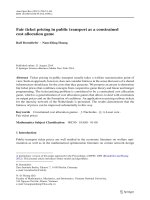
In another survey, the distribution of OCs in sediments from Hau River,
one of the two largest branches of Mekong River, was also examined (Minh
NH et al. 2004b, 2007b). Surface sediment samples were collected at various
sites along the Hau River, flowing
fl
through the two urban areas, Can Tho
and Long Xuyen. A similar trend was observed here in the Mekong River,
showing higher concentrations of DDTs and PCBs in sediments from canals
near the urban areas of Can Tho and Long Xuyen, with levels decreasing
downstream (Fig. 5). In particular, DDT residues from the site near Can
Tho and Long Xuyen were about 10–20 fold higher than those in the
respective downstream sites. This result indicates that urban areas are
Fig. 5. Distribution of DDTs and PCBs in sediments from Hau River, the largest
branch of the Mekong River, southern Vietnam (Minh NH et al. 2004b, 2007b).
Organic Pollutants in Vietnam
229
major pollution sources of POPs. Inputs of DDT residues are probably
derived from its application for hygienic purposes and malaria vector
control in urban areas rather than DDT used for agricultural purposes.
As for soil samples, an extensive survey in northern and southern
Vietnam indicated higher concentrations of DDTs from paddy field
fi
sites
than from upland areas (see Table 2; Thao et al. 1993a,b). This result clearly
reflects
fl
the status of DDT use as an insecticide in the past in Vietnam. In
some specific
fi sites in Tay Ninh, southern Vietnam, where a U.S. Army base
was located, elevated PCB levels were recorded (Thao et al. 1993a,b). A
recent survey in the open dumping sites for municipal wastes in Hanoi
and Hochiminh City, the two largest cities in Vietnam, revealed that
concentrations of DDTs and PCBs in soils collected from dumping sites
were much higher than those in paddy fields far from the dumping sites
(Fig. 6; Minh NH et al. 2006a). PCBs and OC insecticides likely originated
from continuous loadings of municipal waste containing residues of these
compounds. The open dumping sites therefore, may act as reservoir sources
of PCBs and OC insecticides.
To understand the magnitude of contamination of POPs in Vietnam,
concentrations in water and sediments were compared with those in other
countries in Asia-Pacifi
fic (Fig. 7). Higher contamination of DDTs in the
Vietnamese coastal environment was noticed, again indicating its extensive
use of in Vietnam. Interestingly, elevated PCBs residues were also observed
in water and sediments from the Mekong River estuary, southern Vietnam,
and the levels were comparable to those reported in some locations in India,
Japan, and Australia (Fig. 7). High PCB contamination in Vietnam observed
Fig. 6. Residue concentrations of persistent organochlorines in soils from open
dumping sites and rural areas (control sites) in Hanoi and Hochiminh City, the two
largest cities in Vietnam (Minh NH et al. 2006a).
230
T.B. Minh et al.
g. 7. Comparison of persistent organochlorine residues in surface water and sediment from different countries in Asia-Pacific
fi (Iwata et al. 1994).
during our survey in the early 1990s could be derived from electrical
equipment imported from industrialized nations, e.g., the former Soviet
Union and Australia, and from leakage from army weapons extensively
used in the Vietnam War during 1961–1971 (Thao et al. 1993a,b).
Available data on the worldwide comparison of PCBs and OC insecticide
levels in open dumpsites are rather scarce. A comparison of PCBs and
DDTs levels in dumping sites from Vietnam with those in soils from other
countries is given in Fig. 8. In general, the levels of PCBs in dumping sites
were higher than those in background soils from various countries, including industrialized nations, e.g., the U.S., Russia, and Italy, where heavy
contamination of PCBs has been common (Meijer et al. 2003). Our survey
indicated that DDT levels in dumping site soils were comparable to those
found in agricultural soils collected in the early 1990s from various countries such as Russia (Iwata et al. 1995), Ireland (McGrath 1995), and
Slovakia (Marta et al. 1997), and higher than in most of the urban soils
collected in many countries such as Egypt (Ahmed et al. 1998), Korea (Kim
and Smith 2001), and the rural areas of Vietnam (Minh NH et al. 2006a)
(see Fig. 8). This observation highlights the role of open dumping sites in
developing Asian countries as significant
fi
pollution sources of PCBs and
DDTs.
B. Biological Samples
The suitability of using a wide range of biological samples as bioindicators
for monitoring POPs contamination was extensively discussed by Tanabe
and Subramanian (2006). Surveys examined POP residue levels in various
Organic Pollutants in Vietnam
231
g. 8. Comparison of organochlorine residue levels in soils from different
countries.
biological samples such as fish,
fi
bivalves, and birds from the Asia-Pacifi
fic
region, including Vietnam, have made clear the status of contamination,
distribution, and source allocation. An extensive study on OC contamination
in fish
fi from Asia and Oceania including Vietnam was carried out by Kannan
et al. (1995). Similar to sediment samples, a relatively uniform distribution
of OCs was observed in fish
fi in various countries in the Asia-Pacifi
fic region.
In Vietnam, residues of DDTs were relatively high in the surveys conducted
in 1990 and 1997 (Table 3). Mussels collected from coastal areas in north
and middle Vietnam contained elevated DDT concentrations (Table 3;
Monirith et al. 2003). Subsequent surveys conducted by Nhan et al. (1998,
1999) examined OC distribution in clams from different sites along the
northern coast, showing a very similar distribution in sediment samples. In
particular, residue concentrations of DDTs, HCHs, and PCBs were relatively high in the sites near the border of China, and a decreasing trend was
noticed toward the southern coastlines (Table 4). At the two estuary areas,
Hai Phong harbor with extensive human and industrial activities, and Thai
Binh province, one of the high rice production areas in Vietnam, higher
concentrations were again observed. In general, the distribution and
magnitude of contamination in sediment and biota (fish
fi and bivalves) was
very similar at both the local and regional scale, which can be attributed to
the enhanced volatilization of semivolatile organic compounds because of
the high temperatures prevailing in tropical ecosystems.
Polybrominated diphenyl ethers (PBDEs) are emerging contaminants
that have received considerable attention in recent years. We conducted a
232
T.B. Minh et al.
Table 3. Concentrations (ng g−1 lipid wt) of Persistent Organochlorines in Biological
Samples from Vietnam.
Location
Sample/sampling site
description
Year
n
Lipid
content (%)
Hanoi
Fish
1990
7
1.9
Phu Da, Hue
Fish
1990
6
1.9
Hochiminh City
Fish
1990
6
1.9
Con Lu island, Red
River estuary,
northern
Vietnam
Con Lu island, Red
River estuary
Cat Ba island, Cai
Hai province
Cat Hai province
Fish (mugil sp. and
chlorophthalmus
sp.)
1997
10
3.2
Shrimp
1997 20 (pooled as
1 sample)
1997 38 (pooled as
1 sample)
1997 34 (pooled as
1 sample)
2.8
160
1.1
530
0.9
300
1997 8 (pooled as 1
sample)
0.7
2,500
1997 12 (pooled as
1 sample)
2
420
1997 33 (pooled as
1 sample)
1997 50 (pooled as
1 sample)
1.2
610
0.6
470
1997 143 (pooled as
1 sample)
1997 54 (pooled as
1 sample)
0.9
34,000
1.1
220
1997 30 (pooled as
1 sample)
1.1
240
Cat Hai province
Cat Hai province
Lach Truong,
Thanh Hoa
Ron River estuary,
Ky Anh
Lang Co, Hue
Thi Nai, Binh Dinh
Phan Ri estuary,
Phan Ri
Green Mussel,
floating habitat
Green Mussel,
floating
habitat
Green Mussel,
floating
habitat
Green Mussel,
floating
habitat
Green Mussel,
aquaculture
Green Mussel,
fishing
village
Green Mussel
Green Mussel,
urban, shipping
traffi
fic,
aquaculture
Green Mussel,
urban, fishing
fi
village
DDTs
1,900 (680–
4,000)a
1,100 (210–
2,700)
1,100 (89–
4,100)
4,200 (330–
8,500)
Organic Pollutants in Vietnam
HCHs
CHLs
120 (47–210)
7.9 (<0.5–17)
48 (32–74)
8.9 (>0.5–12)
110 (33–200)
3.2 (<0.5–18)
350 (27–210)
110 (29–210)
150
3.6
3.9
PCBs
Reference
580 (270–950)
Kannan et
al. 1995
630 (160–1,300) Kannan et
al. 1995
950 (190–3,100) Kannan et
al. 1995
110 (81–140)
100
Minh et al.
2002
Minh et al.
2002
Monirith et
al. 2003
Monirith et
al. 2003
14
86
12
20
24
450
Monirith et
al. 2003
5
110
Monirith et
al. 2003
3.3
13
65
5.5
20
190
Monirith et
al. 2003
Monirith et
al. 2003
12
5.7
3
10
—
380
6.3
36
26
2.9
11
80
Monirith et
al. 2003
Monirith et
al. 2003
Monirith et
al. 2003
233
Remarks
DDTs: sum of p,p′-DDE,
p,p′-DDD and
p,p′-DDT
HCHs: sum of α-, β-, and
γ
γ-HCH
CHLs: sum of cischlordane, transchlordane,
cis-nonachlor, transnonachlor and
oxychlordane
PCBs: quantifi
fied by an
equivalent mixture of
Kanechlor perparations
(KC-300, KC-400, KC500 and KC-600)
DDTs: sum of p,p′-DDE,
p,p′-DDD and
p,p′-DDT
HCHs: sum of α-, β-, and
γ
γ-HCH
CHLs: sum of cischlordane, transchlordane,
cis-nonachlor, transnonachlor and
oxychlordane
PCBs: quantifi
fied by an
equivalent mixture of
Kanechlor perparations
(KC-300, KC-400, KC500 and KC-600)
234
T.B. Minh et al.
Table 3. (cont.)
Location
Hanoi
Hanoi
Balat estuary, Thai
Binh
Balat estuary, Thai
Binh
Diem Dien estuary,
Thaibinh
Tra Co, Mong Cai,
northern coast of
Vietnam
Mong Duong,
northern coast of
Vietnam
Ha Long, Quang
Ninh, northern
coast of Vietnam
Hai Phong,
northern coast of
Vietnam
Ba Lat estuary,
Thai Binh,
northern coast of
Vietnam
Cau Dien, Nhue
River, Hanoi
Cau Dien, Nhue
River, Hanoi
Nhue River, suburb
Hanoi
Sample/sampling site
description
Year
Clam (hyriopsis),
irrigation canal
Carp (cyprinus
carpio), rice field
fi
Shrimp
(metapenaeus)
Clam (Meretrix
meretrix)
Clam (Mactra
quadrangularis),
intertidal mudfl
flat
coastal area
Clam (Meretrix
meretrix),
intertidal mudfl
flat
areas
Clam (Meretrix
meretrix),
intertidal mudfl
flat
areas
Clam (Meretrix
meretrix),
intertidal mudfl
flat
areas
Clam (Meretrix
meretrix).
intertidal mudfl
flat
areas
Clam (Meretrix
meretrix),
intertidal mudfl
flat
areas
Freshwater snails
(Angulyagra sp.),
densely populated
industrial
Freshwater snails
(Angulyagra sp.),
densely populated
industrial
transformer
production
Freshwater snails
(Angulyagra sp.),
rural area
n
Lipid
content (%)
DDTs
1996 15 (pooled as
1 sample)
1996 3 (pooled as 1
sample)
1996 35 (pooled as
1 sample)
1996 43 (pooled as
1 sample)
1996 13 (pooled as
1 sample)
—
7,400
—
22,000
—
1,000
—
830
—
1,000
1997 1 pooled
sample
—
1,200
1997 1 pooled
sample
—
590
1997 1 pooled
sample
—
660
1997 1 pooled
sample
—
850
1997 1 pooled
sample
—
920
1997 1 pooled
sample
—
23,000
1997 1 pooled
sample
—
45,000
1997 1 pooled
sample
—
320
Organic Pollutants in Vietnam
235
HCHs
CHLs
PCBs
Reference
Remarks
97
—
480
370
—
2,600
390
—
490
DDTs: sum of p,p′-DDE,
p,p′-DDD and
p,p′-DDT
HCHs: sum of α-, β-, and
γ
γ-HCH
PCBs: sum 13 congeners
57
—
220
30
—
200
Nhan et al.
1998
Nhan et al.
1998
Nhan et al.
1998
Nhan et al.
1998
Nhan et al.
1998
2,400
—
900
Nhan et al.
1999
400
—
480
Nhan et al.
1999
DDTs: sum of p,p′-DDE
and p,p′-DDD and
p,p′-DDT
HCHs: sum of α-, β-, and
γ
γ-HCH
PCBs: sum 13 congeners
93
—
470
Nhan et al.
1999
77
—
580
Nhan et al.
1999
71
—
250
Nhan et al.
1999
29
14
720
Nhan et al.
2001
21
27
2,200
Nhan et al.
2001
330
Nhan et al.
2001
9.8
—
DDTs sum of p,p′-DDE,
p,p′-DDD, p,p′-DDT,
o,p′-DDE, p,p′-DDD,
p,p′-DDT and DDMU
PCBs: sum 13 congeners
HCHs: sum of α-, β-, and
γ
γ-HCH
CHLs: sum of cischlordane, transchlordane,
trans-nanachlor and
heptachlor
236
T.B. Minh et al.
Table 3. (cont.)
Location
Hanoi downtown
Sample/sampling site
description
Year
Freshwater snails
(Angulyagra sp.),
densely populated
industrial area
To Lich River,
Freshwater snails
suburb Hanoi
(Angulyagra sp.),
densely populated
industrial area
Red River, suburb
Freshwater snails
Hanoi
(Angulyagra sp.),
rural area
Gia Lam, suburb
Freshwater snails
Hanoi
(Angulyagra sp.),
rural area
Dong Anh, suburb Freshwater snails
Hanoi
(Angulyagra sp.),
rural area
Mekong River, Can Catfi
fish
Tho
(Pangasianodon
hypophthalmus),
common
aquaculture
Can Tho
Catfi
fish (Clarias sp.),
from a pond near
municipal
dumping site
Con Lu island, Red Resident birds
River estuary,
(including 7
northern Vietnam
species), wetland
wintering grounds
Con Lu island, Red Migratory birds
River estuary,
(including 17
northern Vietnam
species), wetland
wintering grounds
a
n
DDTs
1997 1 pooled
sample
—
2,700
1997 1 pooled
sample
—
5,300
1997 1 pooled
sample
—
910
1997 1 pooled
sample
—
1,000
1997 1 pooled
sample
—
640
2004
20
3.8 (0.6–7.2)
59 (7.9–
150)
2004
5
3.6 (3.2–4.1)
390 (330–
700)
1997
16
1.9–16
6,200(1,100–
13,000)b
1997
84
4.1–33
2,900 (750–
6,800)
Mean (range).
Average concentrations of 7 resident and 17 migratory species.
b
Lipid
content (%)
Organic Pollutants in Vietnam
HCHs
CHLs
PCBs
Reference
13
1.8
1,000
Nhan et al.
2001
19
—
3,000
Nhan et al.
2001
2.2
480
Nhan et al.
2001
15
—
340
Nhan et al.
2001
11
1
280
Nhan et al.
2001
8.2
0.47 (<0.03–1.5) 0.62 (<0.01–2.6)
2.2 (0.86–5.1)
5.7 (4.2–8.2)
150 (23–310)
100 (5–550)
330 (20–1,700)
22 (5.3–130)
7.2 (0.91–27)
Minh et al.
2005,
2006
50 (37–77)
Minh et al.
2005,
2006
780 (250–2,400) Minh et al.
2002
530 (82–1,600)
Minh et al.
2002
237
Remarks
DDTs: sum of p,p′-DDE,
p,p′-DDD and
p,p′-DDT
HCHs: sum of α-, β-, and
γ
γ-HCH
CHLs: sum of cischlordane, transchlordane,
cis-nonachlor, transnonachlor and
oxychlordane
PCBs: quantifi
fied by an
equivalent mixture of
Kanechlor preparations
(KC-300, KC-400, KC500 and KC-600)