DSpace at VNU: Synthesis and optical properties of core shell ternary ternary CdZnSe ZnSeS quantum dots
Bạn đang xem bản rút gọn của tài liệu. Xem và tải ngay bản đầy đủ của tài liệu tại đây (1.6 MB, 8 trang )
Optical Materials xxx (2014) xxx–xxx
Contents lists available at ScienceDirect
Optical Materials
journal homepage: www.elsevier.com/locate/optmat
Synthesis and optical properties of core/shell ternary/ternary
CdZnSe/ZnSeS quantum dots
Nguyen Hai Yen a, Willy Daney de Marcillac b,c, Clotilde Lethiec b,c, Phan Ngoc Hong a,b,c,
Catherine Schwob b,c, Agnès Maître b,c, Nguyen Quang Liem a, Le Van Vu d, Paul Bénalloul b,c,
Laurent Coolen b,c, Pham Thu Nga a,e,⇑
a
Institute of Materials Science (IMS), Vietnam Academy of Science and Technology (VAST), 18 Hoang Quoc Viet, Cau Giay, Hanoi, Viet Nam
Sorbonne Universités, UPMC Univ Paris 06, UMR 7588, Institut de NanoSciences de Paris (INSP), Paris F-75005, France
CNRS, UMR 7588, Institut de NanoSciences de Paris (INSP), Paris F-75005, France
d
Center for Materials Science, University of Natural Science, VNUH, 334 Nguyen Trai, Hanoi, Viet Nam
e
Duy Tân University, Danang, Viet Nam
b
c
a r t i c l e
i n f o
Article history:
Received 25 December 2013
Received in revised form 5 March 2014
Accepted 16 April 2014
Available online xxxx
Keywords:
Ternary QDs
Alloyed QDs
CdZnSe/ZnSeS core/shell QDs
Single-photon emitter
a b s t r a c t
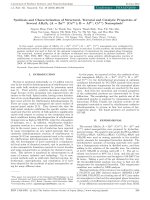
In this paper we report on the synthesis of ternary/ternary alloyed CdZnSe/ZnSeS core/shell quantum dots
(QDs) by embryonic nuclei-induced alloying process. We synthesized CdZnSe core QDs emitting in the
spectral range of 530–607 nm with various Cd/Zn ratios, depending on the core synthesis temperature.
By shelling ZnSeS on the CdZnSe core QDs, the average luminescence quantum yield is increased by a typical factor of 2 up to 17, which we attribute to the reduction of number of non-emitting QDs. The singlephoton emitter micro-photoluminescence study showed that the CdZnSe/ZnSeS core/shell QDs are good
single-photon emitters and their blinking properties were improved compared to the CdZnSe core QDs.
Quantum yields up to 25% were measured for the core/shell samples, demonstrating the potential for
high-quality ternary/ternary QDs fabrication.
Ó 2014 Elsevier B.V. All rights reserved.
1. Introduction
Semiconductor QDs have demonstrated their nice photoluminescence (PL) properties, such as tuning of the emission through
the QD diameter, with applications for multiplexed biolabeling
[1,2], solid-state lighting and display [3], sensors for agriculture
[1,4–6] and single-photon emission [7–9]. Among various QDs,
CdSe QDs have been studied most extensively [10–12]. By shelling
CdSe core QDs with ZnS [13,14] or CdS [2,15], non-radiative decay
channels related to surface states could be passivated, consequently increasing the core/shell QDs luminescence quantum yield
(LQY), which reaches almost 100% in some cases [16]. However,
though CdSe/ZnS QDs emit strong luminescence, it also exhibit
random ‘‘blinking’’ between emitting ‘‘on’’ states and non-emitting
‘‘off’’ states [17]. To eliminate the blinking in a core QDs, a thick
suitable shell could be applied. For CdSe QDs, the thick CdS shell
was used to give a quasi-suppression of the blinking [2,18–20].
⇑ Corresponding author at: Institute of Materials Science (IMS), Vietnam
Academy of Science and Technology (VAST), 18 Hoang Quoc Viet, Cau Giay, Hanoi,
Viet Nam. Tel.: +84 90 41 20 471; fax: +84 43 73 45 895.
E-mail addresses: , (P. Thu Nga).
Many applications of QDs such as solid-state lighting or biological labeling require tuning the emission over the whole visible
spectrum. This is theoretically possible with the well-controlled
CdSe QDs size; however for emission in the blue–green spectral
region it requires very small CdSe QDs, which are difficult to be
synthesized with well-passivated surface and homogeneous size,
resulting in low LQY and broad emission [21,22]. Alternatively,
considering alloyed QDs, e.g., various ternary CdZnSe [21,25–31],
CdSeTe [24] and CdZnS [23,32] which have been synthesized, the
violet–green region is accessible because the emission wavelength
depends on their compositions. The tunable emissions from
the mentioned QDs were reported in the spectral ranges of
360–500 nm [27], 390–580 nm [26], 415–460 nm [32], 535–
620 nm [21], respectively. Controlling the synthesis of ternary
QDs is however a delicate question. Different methods have been
presented for the synthesis of alloyed CdZnSe QDs, and in particular Zhong et al. distinguished two procedures [25,26]: for the first
one called ‘‘embryonic nuclei-induced alloying process’’ [25], binary seeds are formed by injection of the first cationic precursor
(either Cd or Zn), then the ternary QDs are grown by increase of
the temperature and injection of the second cationic precursor.
For the second procedure called ‘‘cationic exchange process’’ [26],
/>0925-3467/Ó 2014 Elsevier B.V. All rights reserved.
Please cite this article in press as: H.Y. Nguyen et al., Opt. Mater. (2014), />
2
H.Y. Nguyen et al. / Optical Materials xxx (2014) xxx–xxx
binary QDs, for instance ZnSe, are first synthesized, then the second cationic precursor Cd2+ is injected and mixed with ZnSe so that
CdZnSe QDs are obtained. The obtained crystalline structures were
found to be hexagonal for the former synthesis [25] and zincblende for the latter [26].
The growth of the ZnS or ZnSe shell on the alloyed QDs was
reported, resulting in the core/shell ternary/binary structures
[29,32]. For CdZnSe/ZnSe QDs, a suppression of blinking of the
emission at 600–650 nm was demonstrated that is attributed to
a gradient of the composition of alloy [31]. CdZnSe QDs have also
been used for the fabrication of light-emitting diode (LED) with
the spectral properties better than those of CdSe/ZnS QDs [33].
To improve the spectral characteristics and optical properties, binary/ternary core/shell structure like CdSe/CdZnS QDs or core/multishell one like CdSe/(CdS/ZnCdS/ZnS) QDs have also been
performed [34,35]. However, to our knowledge, there has been
no report on the synthesis of ternary/ternary core/shell QDs. This
is possibly due to the particular difficulty in controlling the synthesis conditions of ternary/ternary QDs. One can expect the improvement of the optical properties from ternary/ternary core/shell QDs
because of reduction of the lattice mismatch between the core and
the shell that are resulted from the smooth change in the composition at the interface.
In this paper, we report on the synthesis of ternary/ternary
CdZnSe/ZnSeS core/shell QDs. The size and alloy composition, as
well as the photophysical properties of the QDs obtained at different synthesis temperatures are discussed. As the synthesis temperature increased from 285 °C to 310 °C, CdZnSe QDs obtained could
emit strong photoluminescence (PL) ranging from 530 nm to
607 nm. We then have studied the ZnSeS shell growth with different Se/S precursor ratios. After shelling CdZnSe core QDs with
ZnSeS, increases of the LQY by 2–16 times and values of LQY up
to 25% have been determined for the CdZnSe/ZnSeS core/shell
QDs. The PL spectra and PL decay-times from the core/shell QDs
were measured and analyzed. Finally, single-photon emitter
microscopy was performed showing much suppression of the PL
blinking in the CdZnSe/ZnSeS core/shell QDs.
2. Experimental
2.1. Chemicals
We used the following reagents (from Aldrich): cadmium acetate (Cd(Ac)2, 99.9%), zinc acetate (Zn(Ac)2, 99.9%), selenium powder
(Se,
99.99%),
hexamethyl
disilthiane
(TMS)2S,
trioctylphosphine oxide (TOPO, 99%), trioctylphosphine (TOP,
90%) and hexadecylamine (HDA, 99%). All chemicals were used
without further purification.
2.2. Synthesis of the ternary alloyed CdZnSe core QDs
For the synthesis of the ternary core QDs we used the embryonic nuclei-induced alloying procedure described in [25], with initial growth of ZnSe seeds and subsequent growth of the CdZnSe
QDs. Our choice of the precursors was modified with respect to
Ref. [25], so that the reaction conditions were adjusted accordingly.
All synthetic routes were carried out using standard airless procedures by filling the reaction flask by ultra-pure nitrogen gas flow.
In order to fabricate the cadmium stock solution, we dissolved
0.025 g of cadmium acetate in 0.54 ml TOP at 80 °C in nitrogen
gas. Similarly, we obtained the zinc stock solution by dissolving
0.0875 g of zinc acetate in 1 ml TOP at 140 °C in nitrogen gas atmosphere, and we obtained the TOP–Se precursor by dissolving
0.135 g of Se in 1.665 ml of TOP at 120 °C in nitrogen gas. The
molar ratios of precursors were thus the same for all samples
and equal to 0.2/0.8 for the Cd/Zn ratio and 1/3.3 for the
(Cd + Zn)/Se ratio.
Briefly, 3.325 g of TOPO and 1.6625 g of HDA were poured into a
three-neck reaction flask. Nitrogen gas was used to remove water
vapor and oxygen out of the reaction flask at room temperature
for 30 min, then at 120 °C for one hour. We first injected the
TOP–Se precursor into the flask under vigorous stirring and heating
at temperatures up to 100 °C in nitrogen gas atmosphere. Kept stirring and heating the reactor up to 190 °C, and at that moment zinc
stock precursor solution was injected into the reaction flask in
order to form the ZnSe nanocrystallite seeds. Then temperature
was increased up to 280 °C, at that time we injected the cadmium
stock solution into the reactor. As the temperature of the liquid in
the reaction flask dropped to $260 °C, the nucleation of the alloyed
CdZnSe QDs started shaping quickly. The alloyed CdZnSe QDs were
grown for typically 20 min. at different temperatures of 285, 300
and 310 °C for samples A–C, respectively.
2.3. Growth of the ternary alloyed ZnSeS shell on the CdZnSe core QDs
The shells were grown following a modified version of the successive ion layer adsorption and reaction (SILAR) procedure from
Refs. [34,36], originally described by Li, Peng and colleagues [15].
The Zn precursor stock solution was prepared by mixing 0.165 g
of zinc acetate and 1.88 ml of TOP, then heating to $140 °C in
nitrogen gas atmosphere until a clear solution was formed. For
the TOP–Se, we dissolved 0.026 g Se in 0.33 ml TOP, at a temperature of $120 °C in nitrogen gas (it is important that the solution
should be clear after it is cooled down to room temperature) and
mixed it with (TMS)2S. Different values of the Se/S molar ratio
(noted x/1Àx) were considered: x = 0.2, 0.4, 0.6 and 0.8. The molar
ratio of the precursors for growing the ZnSeS shell was always to
be Zn/(Se + S) = 1.37/1.
For shelling, 0.25 mM of the as-prepared CdZnSe ternary QDs in
TOPO and HDA was filled into the reaction flask with nitrogen gas
protection. For one hour at 50 °C the evacuation of the air and the
re-fill of nitrogen gas were done several times to clean the atmosphere from the air. Then, temperature was raised to 240 °C for
shelling with the precursor injection in five steps, each step consisting in consecutive addition of metal then chalcogenide addition: for each step the zinc-stock solution was injected dropwise
with a rate of 1–2 drops per second (a drop is of 50 ll), under vigorous stirring. Then, the mixture of (TMS)2S and TOP–Se was added
and the shelling temperature was kept at 240 °C for 15 min under
vigorous stirring. The shell growth temperature was chosen sufficiently high for a good mixture of the ZnSeS alloy but 45–70 °C
below the core growth temperature in order to avoid any further
growth of the core QDs or diffusion between the core and shell.
The volume of precursor solution injected at each step was calculated in order to match the reaction stoichiometry to the area of QD
surface to be covered, as described in [37]. After the last step, the
heater was removed and the mixture was cooled down to stop
the reaction. When the temperature reached 70 °C, the core/shell
QDs were dispersed in organic solvent (toluene or choloroform).
2.4. Characterization of ternary CdZnSe/ZnSeS core/shell QDs
The size of the core QDs and the shell thickness were determined by the transmission electron microscopy (TEM) with a JEOL
Jem 1010 microscope operating at 100 kV. The powder X-ray diffraction (XRD, Siemens D5005) was used to confirm the wurtzite
(w) or zinc-blende (zb) crystalline structure. The XRD patterns
were compared with the tabulated values of bulk CdSe (JCPDS card
No. 19-191 (zb) and 8-459 (w)), ZnSe (JCPDS 37-1463 (zb) and 15105 (w)) and ZnS (JCPDS 5-566 (zb) and 39-1363 (w)). The energy-
Please cite this article in press as: H.Y. Nguyen et al., Opt. Mater. (2014), />
3
H.Y. Nguyen et al. / Optical Materials xxx (2014) xxx–xxx
dispersive X-ray spectroscopy (EDS) was used to check the presence of the Cd, Zn, Se and S elements in our ternary QD samples.
For optical characterizations, all the QD samples were diluted in
toluene. In the PL measurements a pulsed nitrogen laser (337 nm,
pulse width 0.6 ns, repetition rate of 10 Hz) was use as the excitation source. The PL from the samples was collected by an optical
fiber on the same side as the excitation light, then was analyzed
by a Jobin–Yvon Spectrometer HR460 and detected by a multichannel CCD detector (2000 pixel). The PL decays were analyzed
with a PM Hamamatsu R5600U and a Tektronix TDS 784A scope
with the time resolution of 1 ns. Finally, in order to measure the
LQY, we measured for each sample the ratio of the integrated emission (under Cd–He laser 442-nm excitation) to the 442-nm absorption, and compared it with the ratio measured under the same
conditions for a rhodamine 6G sample. The concentration was
adjusted in order to keep the absorption at 442 nm in the range
3–8% which was found adequate in our previous work [38].
For individual QD measurements, the QDs were spin-coated on
a glass coverslip and then covered them by a 50-nm layer of PMMA
to protect them from the oxidation. The sample was imaged with a
microscope and a x100 oil-immersion objective with 1.45 numerical aperture. On the one hand, for blinking studies (imaging tens of
QDs at the same time), a portion of the sample was illuminated at
436 nm by a mercury-vapor lamp. The sample was imaged by a
CCD camera, with a pixel size of 6.3 lm corresponding to a resolution of 63 nm. The CCD rate was of 10 frames per second. On the
other hand, for time-resolved studies, a single QD was excited by
a 405-nm pulsed diode laser. Its emission was selected by a pinhole located in the objective image plane, and detected by two avalanche photodiodes in Hanbury-Brown and Twiss configuration,
connected to a Picoharp acquisition card. The overall setup provided a 400-ps resolution.
3. Results for the ternary CdZnSe core QDs
3.1. Structural characterization
We first characterize the CdZnSe core QDs, as obtained before
the shell growth. Various core growth conditions (temperature
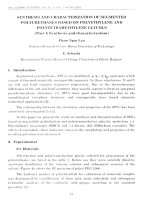
and reaction time) were used as summarized in Table 1. We also
report in Table 1 the core diameter, ranging from 4.2 nm to 5 nm
as estimated from TEM images as shown in Fig. 1. For each sample,
the measured core diameters typically displayed a ±0.5–1 nm
inhomogeneity. Let us point out that a significant portion of this
measured inhomogeneity is introduced by the uncertainty of measuring the QD size on the TEM image, so that the actual QD size distribution is probably of 5–10%.
We also performed energy dispersive X-ray spectrometry (EDS).
The results, reported in Table 1, show a decrease of the Zn/Cd ratio
from A to C. It also shows however some non-stoichiometric
(Cd + Zn)/Se values. Similar results were reported in [35], showing
that the ligand cleaning procedure preliminary to EDS measurement can alter significantly the composition of the surface of the
QDs: for CdSe QDs, Cd/Se ratios between 3 and 3.8 were measured
and attributed to a lack of Se atoms on the QD surface due to
Fig. 1. TEM images of 5 nm (sample A), 4.2 nm (B) and 4.8 nm (C) CdZnSe core QDs.
sample cleaning (typically two thirds of the QD atoms are on the
surface) [35]. Although the quantitative compositions obtained
from EDS may be affected by the cleaning procedure, EDS demonstrates the presence of the three elements Cd, Zn and Se in the QDs.
The crystalline structure of QDs alloy can be different from the
bulk alloy and is difficult to be predicted. Bulk ZnSe can have a
zinc-blende (zb) phase or a metastable wurtzite (w) phase; on
the other hand bulk CdSe can have a wurtzite phase or a metastable zinc-blende phase [34,39]. In the literature, both wurtzite [24]
and zinc-blende [27] structures have been reported for CdZnSe
QDs. For QDs grown on ZnSe seeds, a wurtzite structure was
reported in [26], although a zinc-blende structure has also been
found for ZnSe QDs [25]. Experimentally, the analysis of the XRD
data is complicated because of the broadening of the diffraction
peaks due to the absence of long-range order.
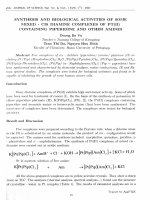
Fig. 2 shows the XRD patterns of the three QD samples (synthesized with the conditions indicated in Table 1, namely A and B and
C) and the tabulated diffraction lines of bulk CdSe and ZnSe. Similar
XRD patterns are obtained for the three samples synthesized at
temperatures from 285 °C to 310 °C. We find experimental XRD
peaks between the tabulated peaks corresponding to the wurtzite
phases of CdSe and ZnSe, which would be in agreement with a
wurtzite CdZnSe alloy (although, given the width of the experimental spectra, we cannot exclude a polytype of zinc-blende and
wurtzite phases). The wurtzite structure would be consistent with
the structure reported in [26] with a ZnSe-seeded growth process.
Table 1
Growth conditions (temperature and reaction time after TOP–Cd injection) and QD diameter (from TEM images) and Cd/Zn and (Cd + Zn)/Se ratios from EDS data of three samples
of ternary CdZnSeQDs.
Sample name
Reaction temperature (°C)
Reaction time (min)
QD diameter (nm)
Cd/Zn amount
(Cd + Zn)/Se amount
A
B
C
285
300
310
20
20
17
5.0
4.2
4.8
0.3/0.7
0.4/0.6
0.5/0.5
3.3
2
1.6
Please cite this article in press as: H.Y. Nguyen et al., Opt. Mater. (2014), />
4
H.Y. Nguyen et al. / Optical Materials xxx (2014) xxx–xxx
line widths are presented in Table 2, showing a large dependence
on the QDs synthesis protocol. The QD emission wavelength ranging from 530 nm for sample A to 607 nm for sample C could
depend on both the alloy bandgap and on the QD diameter (d).
However, given the similar sizes of these samples, we expect that
most contribution to the optical transition energy comes from
the change in the QDs compositions (Zn/Cd ratio). One can see also
the larger Stokes shifts in samples B and C as compared to that of
sample A that may originate from the localization of charge carriers in the alloy, as similarly observed in In(Zn)P QDs [40].
The QD emission energy EQD has been described by ECdSe,QD =
ECdSe,bulk + 1.83/d1.06 in Ref. [41] for a CdSe QD and EZnSe,QD =
EZnSe,bulk + 2.08/d1.19 in Ref. [42] for a ZnSe QD. For bulk Cd1ÀxZnxSe
alloys, a quadratic relation can be used to describe the bulk alloy
bandgap ECdZnSe,bulk as a function of the Zn fraction x. These elements suggest that the QD emission energy ECdZnSe,QD (in eV) can
be described by the following empirical relation:
Fig. 2. Powder XRD patterns of CdZnSe ternary QD cores with different growth
temperature, from 285 °C (A) to 310 °C (C). Bulk diffraction peaks for zinc blende
(zb) and wurtzite (w) ZnSe (top) and zb and w CdSe (bottom) are indexed for
identification purpose (for bulk CdSe [(JCPDS card 19-191 (zb) and 8–459 (w)] and
bulk ZnSe [JCPDS card 37-1463 (zb) and 15–105 (w)]).
3.2. Optical properties
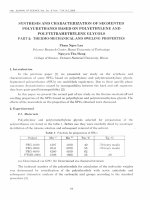
Fig. 3(a) plots the absorption and PL spectra of the three samples A–C of CdZnSe core QDs. The absorption spectra display a clear
excitonic peak showing high quality of the QDs and their corresponding energies are much higher than the bandgap energy of
bulk CdSe. The absorption and emission wavelengths and emission
1:06
ECdZnSe;QD ¼ ECdZnSe;bulk þ ð1 À xÞ1:83=d
1:19
þ x2:08=d
ð1Þ
Kim et al. have used this relation with ECdZnSe,bulk = 1.74Á
(1Àx) + 2.6ÁxÀ0.35x(1Àx) to estimate x by using the emission
wavelength and the TEM value of d [21]. By using the same
method, we find x of the order of 0.4, 0.1 and 0 for samples A–C,
respectively. The latter value is surely false as we know from the
EDS data that the QDs are CdZnSe alloys. There is thus probably
a bias on the x value obtained from the empirical Eq. (1), and possibly due to errors on the measured d or on the bulk bandgap value,
as different values are reported in the literature (1.74–1.8 eV for
CdSe [43]). However, we can make the qualitative estimation, from
Eq. (1), that the amount of Zn is decreased in QDs synthesized at
higher temperature, which would be in agreement with the composition values obtained by EDS (Table 1), while addition of the
Cd precursor to ZnSe seeds induces more Cd as the temperature
is increased.
Fig. 3(b) shows the plots in ln scale of the PL decay curves from
the three samples. The PL decays are non-exponential with a large
contribution of the fast decay component of sample A, which suggests an important contribution from non-radiative channels. The
decay curves of samples B and C are closer to an exponential decay
process. A reasonable fit is obtained with the stretched exponential
function: exp(-(t/t0)b), with, for the core samples A–C, the respective characteristic times t0 = 6.3, 13 and 12.6 ns and exponents
b = 0.48, 0.64 and 0.64 (plotted as dotted lines on fig. 2(b)): similar
parameters are found for the samples B and C, with shorter characteristic time for sample A and a lower b factor, indicating a stronger
deviation from exponential shape.
Finally, the measured LQY are reported in Table 3. The LQY is
low for sample B (11%) and very low for sample A (2%), which confirms the presence of stronger non-radiative decay channels for
sample A. Both samples should benefit from addition of a capping
shell in order to improve their LQY.
As a short conclusion for CdZnSe core QDs, we have found that
(i) a lower reaction temperature leads to a higher Zn concentration
indicated by a shorter emission wavelength and (ii) for the lowest
temperature (sample A) larger non-radiative decay channels
appear. The improvements of the synthesis parameters in order
Table 2
Absorption peak, PL peak wavelength and PL line width in nm of the CdZnSe QDs.
Fig. 3. (a) Absorption (dotted lines) and photoluminescence (full lines) spectra of
the three CdZnSe core samples: A–C (norm. units). (b) Photoluminescence decay
curves (in ln scale) of the samples A–C (full lines) and stretched-exponential fits
(dotted lines).
Sample (nm)
A
B
C
Absorption wavelength
Emission wavelength
Emission line width
526
530
34
554
570
35
588
607
43
Please cite this article in press as: H.Y. Nguyen et al., Opt. Mater. (2014), />
5
H.Y. Nguyen et al. / Optical Materials xxx (2014) xxx–xxx
Table 3
Properties of the CdZnSe/ZnSeS QDs, obtained from TEM images and ensemble optical measurements, as a function of the CdZnSe core sample (A and B) and the Se/S shell nominal
ratio (1–4 corresponding respectively to a Se/S ratio of 0.2/0.8, 0.4/0.6, 0.6/0.4 and 0.8/0.2). The decay characteristics t0 (in ns) and b are obtained by fitting the decay curves with a
stretched exponential: exp(À(t/t0)b). The LQY (in%) was obtained by comparison with a rhodamine 6G Ref. [38].
Sample Se/S precursor ratio Diameter (nm) Absorption wavelength (nm) Emission wavelength (nm) Emission line width (nm) t0(ns)/b decay factors LQY (%)
A
A1
A2
A3
A4
B
B1
B2
B3
B4
–
0.2/0.8
0.4/0.6
0.6/0.4
0.8/0.2
–
0.2/0.8
0.4/0.6
0.6/0.4
0.8/0.2
5.0
6.0
5.5
5.9
6.3
4.2
5.1
5.1
5.3
4.4
526
536
–
536
–
554
556
553
554
555
530
560
589
562
578
570
572
567
569
571
to achieve both emission in the blue region and low non-radiative
channels are under progress.
In the following we describe the synthesis of the core/shell QDs,
focusing on core samples A and B which showed the shortest emission wavelengths and shelling with ZnSeS by different Se/S ratios.
4. Results for the ternary/ternary CdZnSe/ZnSeS core/shell QDs
4.1. Structural characterization
Samples A and B were covered by a ZnSeS shell with, for each
sample, different concentrations of the Se and S precursors. The
obtained core/shell samples are labeled 1–4 corresponding to the
Se/S ratio of 0.2/0.8, 0.4/0.6, 0.6/0.4 and 0.8/0.2 from the precursors, respectively.
The diameters of QDs including core and shell are extracted
from the TEM images and shown in Table 3. The mean QD diameter
is the same for all core/shell samples of the same series (the differences between samples of a same series are not significant given
the 0.5–1 nm distribution of measured size in a given sample):
about 6.0 nm for the samples series A and 5.2 nm for the samples
series B, corresponding to a 1-nm shell for both series. Sample B4
is an exception as the shell thickness measured was only 0.2 nm
(the shell thickness is then lower than the measurement uncertainty, but EDS and XRD pattern have confirmed the presence of
the ZnSeS shell).
We have checked the structure of all samples prepared by using
XRD method. However, in Fig. 4 we represent only the XRD pat-
Fig. 4. Powder XRD patterns of CdZnSe ternary QD cores (sample B) and CdZnSe/
ZnSeS core/shell (samples B1–B4). Bulk diffraction peaks for wurtzite ZnS (top),
ZnSe (middle) and CdSe (bottom) are shown.
34
46
63
44
61
35
37
38
37
36
6.3/0.48
3.3/0.50
4.4/0.55
3.9/0.64
5.4/0.6
13/0.64
11/0.6
14/0.62
10/0.59
8/0.62
2
14
26
4
4
11
18
21
25
3
terns of sample B (the CdZnSe core QDs) and their core/shell structures named as B1–B4. For a 4.2-nm core QDs with a 1-nm shell,
we estimate by geometric considerations that about half of the
atoms are located in the QD core and half in the QD shell. The three
peaks at 43°, 47° and 51° are characteristic to the wurtzite structure (the zinc-blende structure creates only two peaks). For the
core, as discussed previously we find a polytype zinc-blende/
wurtzite structure (two peaks and a smaller one). For the core/shell
samples, the structure is clearly wurtzite, indicating that the shell
grows in wurtzite phase. The peak positions for the core/shell QDs
are shifted to higher angles as compared to the core sample
because of the ZnSeS shell contribution with smaller lattice constant. In this cases, some compression might happen in the core
QDs. Although the samples B1 – B4 are synthesized with very different Se/S precursor ratios, the XRD patterns indicate to be similar, suggesting that Se and S concentrations in the shell did not
clearly influence to the structure of the shell.
4.2. Optical properties of QDs ensemble
The absorption and PL spectra, and the PL decay curves of all A,
B core QDs and their core/shell structures are plotted in Fig. 5. The
main spectral characteristics (peak positions and width, decay factors t0 and b obtained by a stretched-exponential fit) are reported
in Table 3. For the series A, the PL spectra of the core/shell QDs are
broad and differently red-shifted as compared to the core QDs,
namely sample A. This is possibly due to the less stable structure
of the core QDs synthesized at 285 °C. We have observed similar
effect with our CdZnSe/ZnS QDs (data not shown here), with a
16-nm red-shift by addition of the 0.5-nm ZnS shell and a 20-nm
red-shift by addition of the 0.8-nm or 1.4-nm ZnS shell, because
of the tunnel penetration of the charges into the shell which
decreases the confinement energy. The charges penetration inside
the shell is expected to be larger for the ZnSeS shell than for the
ZnS shell as ZnSeS has a smaller bandgap that explains the larger
red-shift. Indeed the redshift for samples A1–A4 (ZnSeS shell)
ranges from 30 to 59 nm, larger than the 20-nm red-shift for the
ZnS shell. Optimizing the shell composition is necessary to compromise between the red-shift and the lattice mismatch. For the
samples with core B, the emission band from all samples is at
the same wavelength (within 2–3 nm) and the emission line width
is always 37 nm, indicating the stability of the core and good
reproducibility of the shell. The emission wavelength is exactly
the same as for the CdZnSe core, which is in contrast with sample
series A. The presence of a significant ZnSeS shell in samples B1–B4
has been demonstrated with EDS, TEM and XRD. One may suggest
that the alloy composition is not uniform inside the core B, with a
Zn-richer surface so that the electron–hole pair is better confined
and the shell has less influence. Alloy gradient effects have been
reported previously for CdZnSe QDs [24]. Another possibility
Please cite this article in press as: H.Y. Nguyen et al., Opt. Mater. (2014), />
6
H.Y. Nguyen et al. / Optical Materials xxx (2014) xxx–xxx
a maximum value of 26%. This could be explained by an increase of
the radiative rate; however an x1.5 increase of the total decay rate
and a x17 quantum yield increase would correspond to a x25
increase in radiative decay rate, which would be quite unrealistic.
We will discuss this further in the next section and propose an
explanation by the decrease of the non-radiative rate.
4.3. Blinking properties from individual QDs
To further characterize the photophysical properties, the QDs
from various CdZnSe core and CdZnSe/ZnSeS core/shell samples
of series A were spin-coated onto a glass substrate and imaged
by a microscope onto a CCD camera. With a proper dilution, the
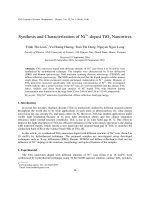
QD were separated by a few microns and could be observed individually. Typical intensity fluctuations for 4 QDs of sample A1
are plotted in Fig. 6, with a 100-ms time resolution. On these
curves, the PL dynamics exhibit switching between a stable fluorescent ‘‘on’’ state and a non-fluorescent ‘‘off’’ state or the so-called
blinking. This blinking of the PL is well-known for CdSe/ZnS QDs
[17] and has been attributed to the charge exchanges between
Fig. 5. (a) Absorption (dotted lines) and PL (full lines) spectra of two CdZnSe
samples and eight CdZnSe/ZnSeS samples (norm. units). (b) PL decay curves of these
samples (in ln scale; full lines) and fit by a stretched exponential (dotted lines).
would be that the red-shift due to electron–hole penetration into
the shell is balanced by a blue-shift caused by a diffusion of S into
the CdZnSe core. Such a blue-shift upon shell addition has been
observed for CdZnS/ZnS QDs [32]. Further characterization would
be necessary to discriminate between these interpretations.
The decay curves of samples B1–B3 are similar to the decay
curve of the core sample B (with B3 slightly slower). The decay is
slightly faster for B4, suggesting an increase in defect contributions
to the non-radiative decay, which may be explained by its thinner
shell (0.2 nm instead of 1 nm for the other samples, as measured
by TEM). Values of the LQY are given in Table 3. For series B, the
quantum yield is improved by a factor of 2 as compared to the core
(with the exception of sample B4, which confirms that the quality
of the shell is poorer for this sample). Quantum yields up to 25% are
obtained. On the other hand, the decay curves are not modified for
B1–B3 as compared to the core, indicating that the total (radiative + non-radiative) decay rate is not modified, and suggesting
that both the radiative and non-radiative rates are not modified.
The LQY being the ratio of the radiative to total decay rates, should
then not be modified either. However, it should be kept in mind
that the QDs ‘‘blink’’. The decay curves originate only from the
emitting ‘‘on’’ QDs, so they show that the decay rates are not modified for the emitting QDs. The quantum yield measurement, on the
other hand, is an average over all (‘‘on’’ emitting and ‘‘off’’ nonemitting) QDs, as it is the ratio of emission to absorption and all
(‘‘on’’ and ‘‘off’’) QDs absorb. The increase of the quantum yield
upon shell addition may thus be attributed to a reduced blinking
(less ‘‘off’’ QDs), without significant modification of the radiative
and non-radiative decay rates of the ‘‘on’’ QDs.
For the samples with core A, all decays are about 1.5 times faster than for the core sample. The LQY of the core/shell QDs is
increased by a factor 2.6–17 with respect to the core sample, with
Fig. 6. (a) PL dynamics of four typical A1 QDs; (b) distribution of the fraction of ‘‘on’’
times for sample A1; (c) distribution of the durations of each ‘‘on’’ (blue) and ‘‘off’’
(green) state duration. (For interpretation of the references to color in this figure
legend, the reader is referred to the web version of this article.)
Please cite this article in press as: H.Y. Nguyen et al., Opt. Mater. (2014), />
H.Y. Nguyen et al. / Optical Materials xxx (2014) xxx–xxx
the QD core and trap states in its shell of environment. The clear
switching between two well-defined ‘‘on’’ and ‘‘off’’ states constitutes a reasonable photostability, as is usually observed for the
high quality CdSe/ZnS QDs.
For each nanocrystal, we can define a threshold between ‘‘on’’
and ‘‘off’’ states so that the duration of the successive ‘‘on’’ and
‘‘off’’ states can be estimated. For a collection of about 50 QDs for
each sample, we determined the portion of the total acquisition
time that was spent by each QD in the ‘‘on’’ state. Average portions
of time spent in the ‘‘on’’ emitting state for the three samples A, A1
and A4 have been determined to be 25%, 35% and 40%, respectively,
showing that the shell has reduced the QD blinking by increasing
the duration time in the ‘‘on’’ state. This increase alone cannot
account for the x2–x10 increase in LQY obtained by ensemble
luminescence measurements (Table 3), but it has been shown that,
in a typical QD sample, a large portion of the QDs are ‘‘dead’’ [39]:
they never emit light because their non-radiative channels are
always too high. We can thus assume that shell addition results
in a reduction of the portion of ‘‘dead’’ QDs. If, for samples A, A1
and A4 the LQY in solution is respectively 2%, 14% and 4% while
the QDs spent resp. 25%, 35% and 40% of their time in the ‘‘on’’
state, we deduce that roughly resp. 8%, 40% and 10% of QDs are
not ‘‘dead’’, showing that shell addition can increase the number
of QDs which are not ‘‘dead’’ up to 5 times.
For sample A1, we also plot in Fig. 6(c) the distribution of the
‘‘on’’ and ‘‘off’’ states duration (collected over 50 QDs). These 2
plots, in log–log scale, agree reasonably with a power-law distribution, and they can be fit by a tÀ1.5 function for the ‘‘on’’ times and a
tÀ1.4 function for the ‘‘off’’ times. These power-law distributions
(Levy laws) with the 1.5 coefficient are in very good agreement
with previous results on the blinking statistics of CdSe/ZnS QDs
[44]. The blinking properties of the CdZnSe/ZnSeS QDs are thus
qualitatively of same nature as for the CdSe/ZnS nanocrystals. Various mechanisms have been proposed to explain this power-law
distribution, involving either a distribution of trapping states with
different trapping/detrapping rates [45] or the random-walk fluctuations of the emission wavelength [46].
4.4. Single-photon emitter time-resolved properties
The PL properties of sample A1 were characterized with better
(400 ps) time resolution by exciting a single nanocrystal with a
pulsed 400-nm laser and detecting with a photon-counting avalanche photodiode. Fig. 7 plots the detected intensity for a typical
QD (in photon counts/s), with a 45-ms resolution. We find an ‘‘off’’
state intensity of about 1000 counts/s, which corresponds to the
electronic and optical background. The ‘‘on’’ states typically range
between 4 and 14 kcps, with a large distribution of intensity
values.
Fig. 7(b) shows the different intensity levels corresponding to
different decay rates. We select the photons detected when the
emission intensity was between 0.6 and 1.5 kcps (blue), 2.5 and
4.5 kcps (green), and above 6.5 kcps (red) and we plot the three
corresponding decay curves in Fig. 7(b). The decay curve is almost
a single exponential (with 18 ns decay time) for the highest emission intensities, and faster and non-exponential (1/e decay in
1.5 ns) for the lowest intensities. This indicates that the intensity
fluctuations are caused by fluctuating non-radiative decay channels, as was observed previously for CdSe/ZnS [47] and CdSe/CdS
[48] QDs: the faster decay and lower intensities are correlated
because they correspond to higher non-radiative rates.
Finally we plot in Fig. 7(c) the histogram of the values of the
delay s between one photon detected on photodiode 1 and one
photon detected on photodiode 2. This curve constitutes the intensity autocorrelation function g(2)(s) and characterizes the light
emission quantum properties. We used here a pulsed laser with
7
Fig. 7. (a) PL dynamics of a single QD (sample A1). (b) Decay curves (in ln scale)
measured when the QD intensity was between 0.6 and 1.5 kcps (blue), 2.5 and
4.5 kcps (green) and above 6.5 kcps (red). (c) Intensity autocorrelation function
g(2)(s), plotted as the histogram of the time delays between one photon on
photodiode 1 and one photon on photodiode 2. (For interpretation of the references
to color in this figure legend, the reader is referred to the web version of this
article.)
a 400-ns period between the pulses, so that when a photon is
detected it is more likely that another photon is detected after a
delay which is a multiple of 400 ns. This appears on the g(2)(s)
curve as peaks for values of s multiples of 400 ns. However, at
s = 0, there is no peak (or very weak peak due to background fluorescence from the substrate). This corresponds to the single-photon emission property (antibunching): only one photon can be
emitted after one laser pulse and never are two photons detected
at the same time. This property has been demonstrated for CdSe/
ZnS QDs [7,49] and recently for CdZnSe/ZnSe QDs emitting at
600 nm [31].
5. Conclusion
In summary, we have successfully synthesized high-quality
CdZnSe ternary core and ternary/ternary CdZnSe/ZnSeS core/shell
QDs using embryonic nuclei-induced alloying process. Depending
on the Cd/Zn ratios and the synthesis temperature, CdZnSe core
QDs could strongly luminescence in the spectral range of 530–
607 nm. This corresponds to a decrease of the Zn concentration
in the core QDs as the reaction temperature increased. By shelling
Please cite this article in press as: H.Y. Nguyen et al., Opt. Mater. (2014), />
8
H.Y. Nguyen et al. / Optical Materials xxx (2014) xxx–xxx
ZnSeS on the CdZnSe core QDs, the average LQY is increased by a
typical factor of 2 up to 17 and up to LQY values of 25%, showing
the potential for high-quality ternary/ternary QD synthesis. We
attribute this increase in LQY to the reductions of both the average
‘‘off’’ time and the percentage of ‘‘dead’’ non-emitting QDs. By
using single-photon emitter spectroscopy, we have demonstrated
for the CdZnSe/ZnSeS core/shell QDs a complete photon antibunching. We confirmed the reduction of the average ‘‘off’’ time by
shelling the core QDs and showed that blinking property was
improved comparing to that of the CdZnSe core QDs. We are currently optimizing the synthesis parameters in order to take advantage of the core and shell concentrations to tune the emission
further to the blue region and to reduce blinking and non-radiative
channels.
Acknowledgments
This work was funded by Vietnam National Foundation for Science and Technology Development (NAFOSTED, Project 103.062011.03), the PICS cooperation project between CNRS and VAST
(Project Number 5724) and by the Centre de Compétences C’Nano
– Ile de France (NanoCrisPho and NanoPlasmAA projects) and the
Agence Nationale de la Recherche (Delight project). The authors
thank the National Key Laboratory for Electronic Materials and
Devices – IMS for the use of its facilities and Pr Le Van Vu for his
advice on XRD analysis.
Appendix A. Supplementary data
Supplementary data associated with this article can be found, in
the online version, at />04.020.
References
[1] Igor L. Medintz, H. Tetsuo Uyeda, Ellen R. Goldman, Hedi Mattoussi, Nat. Mater.
4 (2005) 435–446.
[2] Ou Chen, Jing Zhao, Vikash P. Chauhan, Jian Cui, Cliff Wong, Daniel K. Harris, He
Wei, Hee-Sun Han, Dai Fukumura, Rakesh K. Jain, Moungi G. Bawendi, Nat.
Mater. 12 (2013) 445–451.
[3] J. Lim, S. Jun, E. Jang, H. Baik, H. Kim, J. Cho, Materials 19 (2007) 1927–1932.
[4] Yu Tao, Jiang-Shan Shen, Hai-Hong Bai, Lei Guo, Ji-Jun Tang, Yun-Bao Jiang,
Jian-Wei Xie, Analyst 134 (2009) 2153–2157.
[5] K. Zhang, Q. Mei, G. Guan, B. Liu, S. Wang, Z. Zhang, Anal. Chem. 82 (2010)
9579–9586.
[6] Thi Kim Chi Tran, Duc Chinh Vu, Thi Dieu Thuy Ung, Hai Yen Nguyen, Ngoc Hai
Nguyen, Tran Cao Dao, Thu Nga Pham, Quang Liem Nguyen, Adv. Nat. Sci.:
Nanosci. Nanotechnol. 3 (2012) 035008.
[7] P. Michler, A. Kiraz, C. Becher, W.V. Schoenfeld, P.M. Petroff, Lidong Zhang, E.
Hu, A. Imamoglu, Science 290 (2000) 2282–2285.
[8] G. Messin, J.P. Hermier, E. Giacobino, P. Desbiolles, M. Dahan, Opt. Lett. 26
(2001) 1891–1893.
[9] B. Lounis, H.A. Bechtel, D. Gerion, P. Alivisatos, W.E. Moerner, Chem. Phys. Lett.
329 (2000) 399–404.
[10] I. Mekis, D.V. Talapin, A. Kornowski, M. Haase, H. Weller, J. Phys. Chem. B 107
(2003) 7454–7462.
[11] Nguyen Quang Liem, Le Quang Phuong, Ung Thi Dieu Thuy, Tran Thi Kim Chi,
Do Xuan Thanh, J. Korean Phys. Soc. 53 (2008) 1570–1574.
[12] Ung Thi Dieu Thuy, Nguyen Quang Liem, Do Xuan Nguyen, M. Protière, P. Reiss,
Appl. Phys. Lett. 91 (2007) 241908.
[13] M.A. Hines, P. Guyot-Sionnest, J. Phys. Chem. 100 (1996) 468–471.
[14] B.O. Dabbousi, J. Rodriguez-Viejo, F.V. Mikulec, J.R. Heine, H. Mattoussi, R.
Ober, K.F. Jensen, M.G. Bawendi, J. Phys. Chem. B 101 (1997) 9463–9475.
[15] J.J. Li, Y.A. Wang, W. Guo, J.C. Keay, T.D. Mishima, M.B. Johnson, X. Peng, J. Am.
Chem. Soc. 125 (2003) 12567–12575.
[16] X. Brokmann, L. Coolen, M. Dahan, J.P. Hermier, Phys. Rev. Lett. 93 (2004)
107403.
[17] M. Nirmal, B.O. Dabbousi, M.G. Bawendi, J.J. Macklin, J.K. Trautman, T.D. Harris,
L.E. Brus, Nature 383 (1996) 802–804.
[18] Todd D. Krauss, Jeffrey J. Peterson, Nat. Mater. 11 (2012) 14–16.
[19] B. Mahler, P. Spinicelli, S. Buil, X. Quelin, J.-P. Hermier, B. Dubertret, Nat. Mater.
7 (2008) 659–664.
[20] Y. Chen, J. Vela, H. Htoon, J.L. Casson, D.J. Werder, D.A. Bussian, V.I. Klimov, J.A.
Hollingsworth, J. Am. Chem. Soc. 130 (2008) 5026.
[21] Jong-Uk Kim, Jong-Jin Lee, Ho Seong Jang, Duk Young Jeon, Heesun Yang, J.
Nanosci. Nanotechnol. 1 (2011) 725–729.
[22] Michelle D. Regulacio, Ming Yonghan, Acc. Chem. Res. 43 (5) (2010) 621–630.
[23] X.H. Zhong, Y.Y. Feng, W. Knoll, M.Y. Han, J. Am. Chem. Soc. 125 (2003) 13559–
13563.
[24] R.E. Bailey, S.M. Nie, J. Am. Chem. Soc. 125 (2003) 7100.
[25] X.H. Zhong, Z.H. Zhang, S.H. Liu, M.Y. Han, W. Knoll, J. Phys. Chem. B 108 (2004)
15552–15559.
[26] X.H. Zhong, Y.Y. Feng, Y.L. Zhang, Z.Y. Gu, L. Zou, Nanotechnology 18 (2007)
385606–385611.
[27] Y.G. Zheng, Z.C. Yang, J.Y. Ying, Adv. Mater. 19 (2007) 1475–1479.
[28] J.Y. Ouyang, C.I. Ratcliffe, D. Kingston, B. Wilkinson, J. Kuijper, X.H. Wu, J.A.
Ripmeester, K. Yu, Gradiently J. Phys. Chem. C 112 (2008) 4908–4919.
[29] M. Protiere, P. Reiss, Small 3 (2007) 399–403.
[30] F.C. Liu, T.L. Cheng, C.C. Shen, W.L. Tseng, M.Y. Chiang, Langmuir 24 (2008)
2162–2167.
[31] X. Wang, X. Ren, K. Kahen, M.A. Hahn, M. Rajeswaran, S.M. Zacher, J. Silcox, G.E.
Cragg, A.L. Efros, T.D. Krauss, Nature 459 (2009) 686–689.
[32] W.K. Bae, M.K. Nam, K. Char, S. Lee, Chem. Mater. 20 (2008) 5307.
[33] J.M. Caruge, J.E. Halpert, V. Wood, V. Bulovic, M.G. Bawendi, Nat. Photonics 2
(2008) 247–250.
[34] Huiguang Zhu, Arjun Prakash, Denise N. Benoit, Christopher J. Jones, Vicki L.
Colvin, Nanotechnology 21 (2010) 255604.
[35] Adam J. Morris-Cohen, Martin D. Donakowski, Kathryn E. Knowles, Emily A.
Weiss, J. Phys. Chem. C 114 (2010) 897–906.
[36] P.T. Nga, V.D. Chinh, V.T.H. Hanh, N.X. Nghia, P.T. Dzung, C. Barthou, P.
Benalloul, J. Laverdant, A. Maître, Int. J. Nanotechnol. 8 (2011) 347–359.
[37] Tran Thi Quynh Hoa, Le Thi Thanh Binh, Le Van Vu, Nguyen Ngoc Long, Vu Thi
Hong Hanh, Vu Duc Chinh, Pham Thu Nga, Opt. Mater. 35 (2012) 136–140.
[38] J. Laverdant, W. Daney de Marcillac, C. Barthou, C. Schwob, L. Coolen, P.
Benalloul, P.T. Nga, A. Maître, Materials 4 (2011) 1182.
[39] P. Kukura, M. Celebrano, A. Renn, V. Sandoghdar, Nano Lett. 9 (2009) 926–929.
[40] Ung Thi Dieu Thuy, Peter Reiss, Nguyen Quang Liem, Appl. Phys. Lett. 97 (2010)
193104.
[41] Steven A. Santangelo, Eric A. Hinds, Vladimir A. Vlaskin, Paul I. Archer, Daniel
R. Gamelin, J. Am. Chem. Soc. 129 (2007) 3973–3978.
[42] C.A. Smith, H.W.H. Lee, V.J. Leppert, S.H. Risbud, Appl. Phys. Lett. 75 (1999)
1688.
[43] R.C. Weast, M.J. Astle, CRC Handbook of Chemistry and Physics, CRC Press, Boca
Raton, Florida, 1982.
[44] M. Kuno, D.P. Fromm, H.F. Hamann, A. Gallagher, D.J. Nesbitt, J. Chem. Phys.
112 (2000) 3117.
[45] M. Kuno, D.P. Fromm, S.T. Johnson, A. Gallagher, D.J. Nesbitt, Phys. Rev. B 67
(2003) 125304.
[46] P.A. Frantsuzov, R.A. Marcus, Phys. Rev. B 72 (2005) 155321.
[47] B.R. Fisher, PhD thesis at the Massachusetts Institute of Technology,
Massachusetts, 2005.
[48] C. Galland, Y. Ghosh, A. Steinbrück, M. Sykora, J.A. Hollingsworth, V.I. Klimov,
H. Htoon, Nature 479 (2011) 203.
[49] P.T. Nga, V.D. Chinh, P.T. Linh, K.C. Cuong, V.T.H. Hanh, N.X. Nghia, C. Barthou,
A. Maître, Adv. Nat. Sci. 10 (2009) 167–174.
Please cite this article in press as: H.Y. Nguyen et al., Opt. Mater. (2014), />