DSpace at VNU: An exploratory study about spatial analysis techniques in three dimensional maps for SGIS-3D system
Bạn đang xem bản rút gọn của tài liệu. Xem và tải ngay bản đầy đủ của tài liệu tại đây (1.02 MB, 5 trang )
2010 International Conference on Electronics and Information Engineering (ICEIE 2010)
An Exploratory Study about Spatial Analysis Techniques in Three Dimensional
Maps for SGIS-3D System
Le Hoang Son
Center for High Performance Computing
Hanoi University of Science, VNU
334 Nguyen Trai, Thanh Xuan, Ha Noi, Viet Nam
Abstract—Nowadays, Spatial Analysis is one of the most
interesting trends in GIS. In fact, there are some intensive
researches about its use in various branches such as geology,
environment, society,.. This paper performs an exploratory
study about some spatial analysis techniques in three
dimensional maps for the SGIS-3D system which was proposed
by [4]. This system was designed for spatial analysis operations
in 3D maps and it showed the effeciency in some measurement,
calculation tasks of geography, geology and many other
branches.
Keywords-WebGIS-3D, SGIS-3D, Spatial Analysis
I.
INTRODUCTION
The three dimensional WebGIS system is a higher
development than previous GIS-2Ds and it has immense
potential in infrastructure management (life-line and network
infrastructure), disaster management and geological
modeling, etc. Indeed, it is considered to be the main focus
of GIS scientists nowadays [1]. Recently, these have been
some trends to develop three dimensional WebGIS systems
with the purpose to adapt a variety of complex requests in
natural and social science. In the literature [3], the authours
argued that three striking trends: Semantic Sensitive- based,
Spatial Analysis- oriented and Real time- Historical
WebGIS-3D have a great potential to occupy an important
position in WebGIS-3D researches in the future. Among
them, the authors also provided one spatial analysis
operation as the exemplification of spatial analysis- oriented
WebGIS-3D systems’ functions as they are getting important
in science as well as actual needs nowadays.
Spatial Analysis (SA) is a set of techniques devised to
support a spatial perspective on data. To distinguish it from
other forms of analysis, it might be defined as a set of
techniques whose results are dependent on the location of the
objects or events being analyzed, requiring access to both the
locations and attributes of objects. Its techniques range from
simple descriptive measures of pattern of events to complex
statistical tests of whether a set of events could have been
generated by specific, well-defined, processes. Note that SA
as defined here does not include techniques that use only
attributes of objects.
There are many applications that use spatial analysis
techniques for their own specific tasks. For example, Black
men who have sex with men (MSM) are a priority
population for HIV prevention. Authours [6] applied spatial
analysis techniques to map the availability of HIV prevention
978-1-4244-7681-7/$26.00
C
2010 IEEE
services to young black MSM in Chicago to guide
prevention planning. GIS was used to map characteristics of
ZIP codes in Chicago. Choropleth maps and descriptive
statistics were used to visualize and analyze the data. The
results showed amazing effects: Areas where young black
MSM reside typically have low HIV service densities. HIV
service density also corresponds poorly to some ZIP codes in
which young black MSM who report high rates of
unprotected sexual behavior reside. Therefore, Spatial
analysis can show whether services are located near specific
populations of interest or not. Data from multiple sources can
be integrated to explore relationships among characteristics
of geographic zones. Another example was from [2] who
used Spatial Analysis for Air Pollution and Mortality in Los
Angeles. The assessment of air pollution exposure using only
community average concentrations might lead to
measurement error that lowers estimates of the health burden
attributable to poor air quality. After testing this hypothesis,
they suggested the chronic health effects associated with
within-city gradients in exposure to PM2.5 might be even
larger than previously reported across metropolitan areas.
They also found specificity in cause of death, with PM2.5
associated more strongly with ischemic heart disease than
with cardiopulmonary or all-cause mortality.
The most fashionable trend in SA, perhaps, is studying its
techniques in three dimensional WebGIS systems. Paper [5]
proposed some interactive functions for geometric and
metric analysis in 3D terrain of Tahoe Lake, USA using
javascript nodes in standard VRML such as vertical
exaggeration, moving secant plane, measuring the distance
between two points, showing 3D buffer,.. These operations
were implemented in 3D maps having ‘real’ coordinates
system and useful for measurement tasks. Although it was
quite simple, people considered it the first and clear evidence
of SA techniques in three dimensional GIS in WWW. These
techniques are widely applied in many branches and the first
step toward a spatial analysis- oriented WebGIS-3D system.
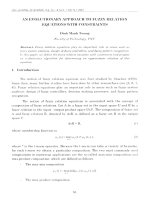
Turning back to the literature [3], the authors also
presented a spatial analysis operation to calculate the area
and perimeter of lakes or ponds cutting through moutains in
a 3D terrain. This operation which was implemented with
geographic modelling language GeoVRML and scripting
language Javascript is useful to illustrate the lesson in class
or some measurement tasks without going out field trips.
V1-199
Volume 1
2010 International Conference on Electronics and Information Engineering (ICEIE 2010)
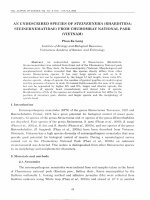
in WebGIS-3D platform. The achitectural model for SGIS3D system is described in the figure below. Main activities
of this model are:
- Web Clients send request to connect to SGIS-3D Server
with purpose to display 3D terrains and query GIS-3D data.
Then, Server automatically install 3D plugins for Web
Clients in case of first time visitor.
- According to clients’ requests, Server locates and loads
terrains in Map3D- a set of basic terrains having structures
defined as GeoVRML terrains plus an attribute database
name in conjunction with RDBMS.
Figure 1. Calculation of Area and Perimeter of lakes
From above spatial analysis operations, it seems that we
need a three dimensional WebGIS system which support
these operations. Authors [4] proposed a spatial analysisoriented WebGIS-3D system so called SGIS-3D which
satisfies this requirement. In addition to traditional functions
of a WebGIS system such as Zoom in, Zoom out, Pan,
Select/ Move and Map Displaying, it also had the capabilities
of visualization and spatial analysis sharing. Three spatial
analysis operations such as Terrain calculation, Three
dimensional GIS convex hull and Temperature
Approximation was attached to SGIS-3D to exemplify its
capability to support spatial analysis operations.
Our contribution is the introduction of SGIS-3D system,
its infrastructure and mechanism to know how it can support
spatial analysis operations. Moreover, we also present
another operation attached to this system as well as some
initiatives which help advancing the performance of
operations in SGIS-3D.
This paper is organized as folows. Section 2 introduces
the SGIS-3D system. An additional spatial analysis operation
to this system will be presented in section 3. Section 4
presents the evaluation and some initiatives to this system.
Finally, we make conclusion and future works in the last
section.
II.
THE SGIS-3D SYSTEM
The SGIS-3D system which was proposed in [4] aimed to
support: (1) Some basic GIS functions such as: Zoom in,
Zoom out, Spatial and Attribute Queries, (2) 3D functions:
Display terrains, explore and rotate objects, show Level of
Details, (3) Some advance functions such as: automatically
installed plugins to view GIS-3D and Spatial analysis tools.
Additionally, this system also has a tool to generate terrains
and new spatial analysis operations. One of the most
interesting functions of this system is the capability to share
spatial analysis operations through network environment.
This means wherever you are in the world, if you have some
ideas about Spatial analysis operations and you want to
check them, you only have to access to the homepage of
SGIS-3D and provide some lines of processing scripts in
Javascript format and GeoVRML node definitions. SGIS-3D
automatically interpret these codes and link them to given
terrains. The final result is a user-defined spatial analysis
operation and we can test it by interacting with 3D maps.
This function is very useful for users in all over the world to
share ideas about Spatial analysis operations among people
Figure 2. SGIS-3D Architecture model
- After loading terrains, Server executes a query to
RDBMS based on database name in Map3D and clicked
point in 3D maps (Id).
- If Clients want to use Spatial analysis operations then
Server will call some functions in SA (Spatial Analysis). It
contains a set of pre-defined Spatial analysis operations
having structures: scripts and GeoVRML nodes. The
extension of these files is .sa.
- Eventually, Server puts all terrains, node definitions and
scripts into a GeoVRML file. The return result to Web
Clients is a 3D map as well as Spatial Queries information in
computers‘ screens. The connection to Server is terminated.
Specifically, we consider 2 special cases: When the 3D
map and choosen spatial analysis operations are displayed in
client’s side and when we need to add more spatial analysis
operations (for sharing). These cases are exemplified by the
figures:
Figure 3. Display 3D maps and Spatial Analysis operations
The above data flow begins with sending the attribute
name and the spatial part stored in WRL file to Map3D
engine. At this place, this information is again sent to
visualization and attribute compartment simultaneously. A
list of spatial analysis operation definitions from SA
V1-200
Volume 1
2010 International Conference on Electronics and Information Engineering (ICEIE 2010)
warehouse are thence transferred to SAlist for users to select.
The state of IsOrigin decides view ‘s type. If it is true, it
means that users are viewing original maps without spatial
analysis operations; otherwise a selected operation along
with origin 3D map will be displayed. Due to ‘dynamicdisplayed’ map, an image which is a copy of a 3D map
stored in background is chosen to display along with
temporary spatial GeoVRML file. This capability is very
useful if we want to supplement more 3D terrains in this
system.
agrument γ . Thus, we have a set of {M i }∈ AB with Mi = A
+ i * γ . Project these points Mi into correlative elevation grid,
we obtain a set of M’i. To ensure that A can observe B, we
check: if exist Mi that it’s elevation h(Mi) < h(M'i) then Mi is
under the 3D map and A can not observe B. Otherwise, if
h( M i) ≥ h( M i' ) with all {M i }∈ AB then A can observe B.
For specific, suppose that the coordinates of A is (xt, yt, zt)
(1) and B is (x, y, z) (2). The number of divided points is n.
Therefore, we have the coordinates of {M i }∈ AB with Mi =
A + i * γ and Mi ≠ B for all i ∈ I :
z − zt ⎞
y − yt
x − xt
⎛
(i )
(i )
(i )
, yt +i *
, z t +i *
M i= ⎜ xt +i *
⎟ = xt , yt , zt (3)
n ⎠
n
n
⎝
(
Figure 4. Display 3D maps and Spatial Analysis operations
The data flow in Figure 4 acts through 2 levels: Display a
temporary user-defined spatial analysis operation in given
3D map- the Preview process and save it to SA warehouse.
After users type a script, it is sent temporarily to SA
warehouse and the process to display 3D maps with specific
spatial analysis operations is similar to the left data flow.
One important note is that we must change the background
image related to the specific chosen terrain. Otherwise, we
will get a pair of unmatched terrain and operations. Finally,
when users satify with their operations, they can save them
to SA warehouse through AddSA procedure. Then, we will
have a new spatial analysis operation attached to SGIS-3D
system.
Until now, we have already had a brief outlook on how
SGIS-3D system could support making, displaying and
sharing spatial analysis operations. Certainly, authors [4]
attached three default spatial analysis operations such as
Terrain calculation, Three dimensional GIS convex hull and
Temperature Approximation to SGIS-3D to exemplify its
capability mentioned above. In the next section, we also try
to supplement another operation for this system as the
enrichment of spatial analysis operation world in SGIS-3D.
III.
AN ADDITIONAL SPATIAL ANALYSIS
OPERATION FOR SGIS-3D
)
Because every point in surface will be assigned a specific
elevation index, we will have a lot of grid cells covering the
sky. Indeed, a 3D map or terrain is generated from that grid
and a point is on the map if and only if it is located at a
specific grid cell in the terrain. Therefore, if exists any point
in the set {Mi} which is under the map then A can not
observe B.
For any Mi, we need to find the coordinates (x,z) of
elevation grid cell Mi’ related to Mi. Assume that x_sp
(xSpacing) and z_sp (zSpacing) are the unit lengths of
elevation grid in X and Z axises and dx, dz are the surplus of
(xt, zt) divided with x_sp and z_sp. Hence, these coordinates
(x,z) are calculated as folows:
x − dx
⎧
nx = t
⎪
x _ sp (4)
⎧ x t = nx * x _ sp + dx
⎪
⇒ ⎨
⎨
*
_
z
nz
z
sp
dz
z
=
+
⎩ t
⎪ nz = t − dz
z _ sp
⎩⎪
Figure 5. Finding the coordinates of Mi’ related to Mi
Supposed that we have a 3D map and 2 points, for
example A and B, in different locations of this terrain. Can a
person who stays at A can observe another staying at B?
Many other problems in GIS such as finding areas that are
observed by one point in 3D map, calculating minimal
altitude of lighthouses,.. can be reduced to this operation. To
check if 2 points can observe each other, we originate from
the idea: Suppose that we connect A and B by a line. Split
this line into many parts by some divided points with
From these upon coordinates and related elevations, we
totally know the coordinates of 4 top points of rectangular
cell in the elevation grid that relate to Mi
E (nx*xSpacing, h(nx,nz), nz* zSpacing),
F ((nx+1)*xSpacing, h(nx+1,nz ), nz* zSpacing) (5)
G (nx * xSpacing, h(nx, nz+1),(nz+1)* zSpacing)
H((nx+1)*xSpacing,h(nx+1,nz+1), (nz+1)*zSpacing)
With the elevation at a grid point (i,j) is specified in the
definition of elevation grid:
V1-201
Volume 1
2010 International Conference on Electronics and Information Engineering (ICEIE 2010)
h(i, j ) = H (i + j * xDimension)
(6)
xDimension and zDimension are the number of grid
points in X and Z axises.
Consequently, we can totally calculate the elevation of
M’i by finding the projection of Mi on the plane (EFG) and
(FGH) and average these figures:
1
M i(c) = (M i' + M"i )
2
(7)
Finally, we compare: if h(Mi) < h(Mi(c)) then Mi is under
the map. The algorithm stops.
IV.
EVALUATION AND INITIATIVES
The spatial analysis operation in section 3 is implemented
with GeoVRML modelling language and Javascript scripting
language.
original points, this, certainly, takes a lot of time to process.
Imagine that the number of divided points increases to
thousands or even milions, although the accuracy of the
operation is better, however, the running time can increase
very high. Especially, in WWW environment, this situation
can not be accepted. Instead, we can assign this checking to
some processors with some continous divided points then
gather results when all processors finish. In case of any
processor that finds a point Mi that it’s elevation h(Mi) is
smaller than h(M'i), the checking stops immediately and
certainly Mi is under the 3D map and 2 original points can
not observe each other. Due to the independent verifying
between these divided points, it definitely reduces the
processing time. Figure 8 shows the running time of
sequential and parallel solutions in different number of
divided points. This result proves our consideration.
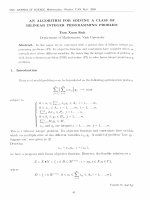
Figure 6. 2 points can observe each other (blue line)
In the above figure, if two points can observe each other,
they will be connected by a blue line. Othewise, it is replaced
by a red line. We use the terrain of Ha Noi city whose
generation method is clearly described in [4] as the basis to
deploy our operation.
In the experiment below, we tested this operation with
3D terrains in various Elevation Grid ‘s sizes (Figure 7). The
results show that: If we increase the size of Elevation Grid
then accuracy level is higher but the running time is slower.
We can not avoid errors due to the divided point-checking
between 2 original points. Sometimes, we have to choose the
optimized solution in both accuracy and time. The
intersectional point between 2 lines, perhaps, is the most
suitable solution in this context.
Figure 7. Accuracy and Running time of the operation by EG’s size
From the algorithm in Section 3, we arise some initiatives
to enhance the performance of this operation. Because we
have to check all divided points of the line between 2
Figure 8. The running time of sequential and parallel solutions
In the parallel solution, after receiving 2 orginal points
and the number of divided points, we immediately split the
line connecting 2 orginal points and assign these divided
points to processors through the sharing mechanism between
Javascript/GeoVRML and C. Thank to the supercomputer of
Center for High Performance of Computing, VNU, we
totally perform this task. We think that if other spatial
analysis operations in the SGIS-3D system can be innovated
to run in parallel and utilize the sharing mechanism, then the
performance of operations will be enhanced significantly.
V.
CONCLUSION
This paper aims to emphasize the importance of spatial
analysis techniques in three dimensional WebGIS systems by
giving its development flow as well as introducing the SGIS3D- a specific system designed for spatial analysis only.
Throughout a brief summary about SGIS-3D ‘s infrastructure
and mechanism, we strongly believe that this system is
suitable for spatial analysis researches and mining
information in 3D maps. Besides, we also attach a spatial
analysis operation for checking the visibility between 2
points in 3D terrains to this system. This operation is the
basis of many other GIS problems and useful to illustrate the
lesson in class without going out field trips. Finally, after
strictly evaluation, some initiatives to enhance the
performance of spatial analysis operations in SGIS-3D are
elicited. We think that if these initiatives are systematically
deployed in total SGIS-3D, the capability of SGIS-3D to
V1-202
Volume 1
2010 International Conference on Electronics and Information Engineering (ICEIE 2010)
perform visual analysis through WWW environment is
higher and higher.
In the future, we will concentrate on the amelioration of
the SGIS-3D system by making an examination of these
initiatives in this paper.
[2]
[3]
ACKNOWLEDGMENT
The authors express deep gratitude to Professor Nguyen
Dinh Hoa, Information Technology Institute, VNU for
eliciting an interesting topic and Mr Nguyen Khac Chinh,
Fsoft company, Viet Nam for some technical procedures.
[5]
REFERENCES
[1]
[4]
A.A. Rahman, Zlatanova, S. and M.Pilouk, “Trends in 3D GIS
development”, Journal of Geospatial Engineering, Vol.4, No.2, 2002,
pp. 1-10.
[6]
V1-203
Jerret and Pope, et al, “Spatial Analysis of Air Pollution and Mortality
in Los Angeles”, Journal of Epidemiology, Vol 16, No 6, 2005, pp.
727-736.
Le Hoang Son, “On the Development of Three Dimensional WebGIS
Systems: Some New Trends and Prospects”, Proceedings of the 2010
3rd IEEE International Conference on Computer Science and
Information Technology (IEEE ICCSIT 2010), 9-11 July 2010,
Chengdu, China, in press.
Le Hoang Son, “An Approach to Construct SGIS-3D: a Three
Dimensional WebGIS System Based on DEM, GeoVRML and
Spatial Analysis operations”, Proceedings of the IADIS International
Conference Web Virtual Reality and Three-Dimensional Worlds 2010
(IADIS Web3DW 2010), 27-29 July 2010, Freiburg, Germany, in
press.
Nguyen Dinh Hoa, “Using Javascript for some interactive operations
in virtual geographic model with geovrml”, International Symposium
on Geoinformatics for Spatial Infrastructure Development in Earth
and Allied Sciences, 9-11 November 2006, HCM city, Viet Nam, pp.
101-107.
Pierce, et al, “Identifying HIV Prevention Service Needs of African
American Men Who Have Sex With Men: An Application of Spatial
Analysis Techniques to Service Planning”, Journal of Public Health
Management and Practice, Vol 13, Issue 1, 2007, pp. 72-79.
Volume 1