DSpace at VNU: A study on urban development through land surface temperature by using remote sensing: in case of Ho Chi Minh city
Bạn đang xem bản rút gọn của tài liệu. Xem và tải ngay bản đầy đủ của tài liệu tại đây (1.32 MB, 8 trang )
VNƯ Jo u m al of Science, E arth Sciences 24 (2008) 160-167
A study on urban development through land
surface temperature by using remote sensing:
in case o f Ho Chi Minh City
Tran Thi V an1’*, Ha Duong Xuan Bao2
11nstitutefor Environment and Resources, Vietnam National University, Ho Chi Minh City
2 Saigon Technology University
Reccived 20 November 2008; received in revised form 5 December 2008.
Abstract. In this research, remote sensing technology was used to evaluate urban development and
its thermal characteristics through mapping impervious suríaces and evaluating thermal inírared
images. The study is carried out in the northem part of Ho Chi Minh City, which is experienced an
accelcrated urban development since the end of 1980s. Landsat and Aster images were used to
calculate the variation in urban impervious surfaces from 1989 to 2006. Thermal bands were
processed to obtain land suríầce temperatures for investigating the urban heat island eíĩect
associated with increasing impervious suríaces both spatially and temporally.
Keywordsi Emissivity; Impervious surface; Land suríace temperature; Suríace urban heat island;
Urban development.
1. Introductỉon
Urban development, as the major type of
human activities leading to land cover change,
has a great impact on the environment. In the
process o f urbanization, natural vegetation
cover is largely replaced by impervious suríaces
such as buildings, roads, parking lots, sidewalks
and other built suríaces. Therefore, the
impervious surfaces are important as a key for
monitoring the urban development [1, 3, 9]. In
urban environment, where vegetation is fairly
sparse, build up or impervious suríaces are
stronger absorbers. The absorbed radiation is
gradually re-emitted as long-wave radiation that
is responsible for warming up the boundary
layer o f the atmosphere within the urban
canopy layer [8]. The temperature response and
reílective properties o f impervious surĩaces are
linked to the “ urban heat island” (UHI) effect,
which often makes cities several degrees
warmer than the countryside. The hot climate o f
cities affects human comfort and health because
o f changes in sensible heat Auxes and the
concentration o f atmospheric pollutants [2].
Thereíore, urban development has a great impact
on the urban suríace temperature. Urban areas
developed in spatial and industrial activity
context are consiđered as a factor contributed in
the global climate change.
* Corresponding author. TeL: 84-8-38651132.
E-mail:
Measuring the urban development and the
land suríace temperature (LST) become
essential for several envừonmental applications
160
T.T. Van, H .D .X. Bao / V N U Ịoum al o f Science, Earth Sáences 24 (2008) 160-167
and the planning, as well as management of
sustainable development in urban areas. There
are many efforts to map the impervious surfaces
and LST in urban environment, such as íield
measurement, visual interpretation o f aerial
photography. But they cost labor intensive, time
consuming and expensive task to manually
survey and map them. As a more cost-effective
altemative, the remote sensing technology has
been widely used in numerous applications in
order to obtain much o f the earth surface spatial
information.
This paper has used remote sensing
technology to study in Ho Chi Minh City for
such objectives: ( 1 ) detecting the spatial urban
development through impervious suríace (IS);
(2) deriving LST and analyzing its spatial and
temporal distribution in the relationship with
the urban IS and land cover; (3) examining the
suríace urban heat island (SUHI) measured by
the urban-suburban LST differences. The time
period happens íìom 1989 to 2006.
2. Study area and d ata sets
2.1.
Study area
Ho Chi Minh City is located in the South of
Vietnam and has a diversiíĩed landscape from
the northem to the Southern part by the natural
elevatìon. The
urban areas are mainly
concentrated in the Central o f the city. The
northem part is the agricultural land; the
southem one is low land w ith dense mangrove
forests. According to statistical data, the
population dcnsity has increased from 552
pers/km 2 in 1985 to 3,067 pers/km 2 in 2006 (in
urban areas about 10,905 pers/km2, in rural
areas about 648 pers/km2). The population
growth causes the spatial expansion being
through encroachment into adjacent agricultural
and rural regions, especially in the northem part
o f the city due to the advantages o f landscape
and relative high topography. Therefore, the
study area is limited to this part. Here is the
161
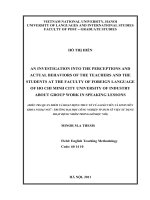
place where the urbanization process is happenừig
fairly strong in the recent years (Fig. 1).
Fig. 1. The study area.
2.2. Data sets
Landsat TM and Aster images were used as
the main data source in this research. Two
Landsat TM images have seven bands, included
six reílective bands in visible, near- and midinfrared spectral region with 30-m pixel size
and one thermal inửared band wiứi 120-m pixel
size, acquired on Jan 16, 1989 and Jan 25,
1998. One Aster image acquired on 25 Dec,
2006 has 14 bands with diíĩerent spatial
resolutions, i.e., three visible-near-infrared
(VNIR) bands with 15-m pixel size, six
shortwave inírared (SW IR) bands with 30-m
pixel size and five theưnal inírared (TIR) bands
with 90-m pixel size. In the image Processing
stage, aỉl Aster and Landsat images were
converted from DN to radiance for íurther
suitable calculation. The 2006 Aster image was
then georeferenced in Universal Transverse
M ercator projection based on the topographical
map with RMS error less than 0.5 pixels. All
Aster bands were resampled in 15m. An imageto-image registration was conducted between
the Aster image and the TM images in order to
keep registration errors to less than a pixel. The
15-m resampled interval was carried out for all
bands o f the two TM images.
162
T.T. Van, H .D .X. Bao / V N U Ịoum aỉ o f Science, Earth Sciences 24 (2008) 160-167
3. Methodology
3.1. Measurement o f the urban IS
The satellite sensors record the earth surface
from the radiance value which depends on the
land cover spectral characteristics. Urban areas
are heterogeneous and complex with different
kinds o f the impervious construction materials,
which have different reílective and absorptive
capacity. So the IS will be One land cover
categoiy for indicatứig the urban area in this
study. In digital interpretation, the confusion of
the bare land, moisture land and urban IS in the
satellite images usually happen. Thereíore,
detecting and interpreting IS from satellite
images requừe the integrated techniques plus
the expert knovvledge for the high accuracy. In
this study, the IS type will be retain as the main
category distinguished wiửi other non-IS types
in the whole process o f digital image. At first,
the supervised classifícation was used for
extracting 4 main types o f land cover, including
IS, bare land, vegetation and water. There is no
unique classification method due to the data
acquired from multi sensors in a long time from
1989 to 2006. Through investigation in this
study, the M ahalanobis distance and Maximum
Likelihood Classiíìcations were carried out in
dependence o f the image characteristics and
statistics. Supervised classifícation method
shown that IS was excellently separated from
water and moisture land, but some bare land
was mixed into that one. The NDVI
(Normalized D iíĩerence Vegetation Index:
NDVI=(Red-NIR)/(Red+NIR)) image was then
used for making a threshold, where the NDVI
value less than “ 0” usually represents for urban
IS and water types. Classiíĩed IS and threshold
NDVI images were multiplied to remove the
mix pixels. The fmal IS results was accepted for
setting up the map o f urban spatial distribution.
For change evaluation o f IS, the study carried
out the post-classification comparison.
3.2. Measurement ofLST in the síudy area
Satellite thermal infrared sensors measure
radiances at the top o f the atmosphere, from
which brightness temperatures TB (also known
as blackbody temperatures) can be derived by
using Plank's law [7]:
Tb = ( ũ ] [ ln ( ( 2/ic2A-5)/ Bx + 1)) ’
^ ^
where h is Planck's constant (6.62* 10'34 J-sec),
c - velocity o f Iight (2.998x1 o 8 m/sec), X vvavelength o f emitted radiance (m), Bị blackbody radiance (V/m^Ịim'1).
In order to determine the actual suríace
temperature it is necessary to do atmospheric
correction and know the emissivity o f the
surỉace land cover. Due to lack o f atmospheric
measures during image acquisition, the
atmospheric correction was ignored. However,
these images were acquired in dry season in the
study area, so they appeared very clear. In this
context, the atmospheric effects on these
images were not significant. The emissivity (e)
was calculated by using the íormula o f Valos
and Caselles [10]:
E = ev P y + e , ( l - P v) ,
(2)
where Cy, e, are the emissivities o f the fưll
vegetation and bare soil, Py is the vegetation
cover fraction. They can be calculated by
NDVI. If land suríace emissivity is known, the
LST (Ts) can be calculated by using the Steían
Boltzmann law [6]:
B = eơTs* =ơTg ,
(3)
thereíore:
TS= \ T B,
(4)
where ơ is the Stefan Boltzmann constant
(5.67x 10⁴Wffl V ) .
The Landsat TM images wiứi one thermal
band 6 in the atmosphere window of 10.412.5|im were used for deriving the LST. The
Aster images ha ve 5 thermal bands from 10 to
14 in the window 8.125-11.25fun, but 2 bands
T.T. Van, H .D .X. Bao / V N U Ịoum al ofSãence, Earth Sciences 24 (2008) 16Ơ-167
13 and 14 with the same window as o f Landsat
images will be used for calculating LST. The
choice is based on that approximately 80% o f
the energy thermal sensors received in this
wavelength range are emitted by the land
suríace [4] and the maximum value o f LST is
usually obtained in this range [5]. The results
gave the spatial distribution o f LST in the
whole study area. Then the SƯHI was evaluated
based on this LST distribution between urban
and rural areas.
Besides that, historical climate iníormation
such as the data o f annual mean air temperature
from 1989 to 2006 are collected ÍTom the
Southern Region Hydrometeorological Center.
These in-situ data were recorded Ũ1 only one
observation meteorological station named Tan
Son Hoa. They w ere used for evaluating the
trend o f the temperature in urban area.
163
than 96%. By history, the urbanization in the
northem part o f Ho Chi Minh City vvas rapidly
developed after formation o f the five new
districts (districts 7, 9, 2, 12, and Thu Duc) in
1997. The IS map (Fig. 2) and results (Table 1)
in 1998 year indicated that the đevelopment o f
IS area is approximately 2.5 times bigger than
that in 1989. The IS area from 1989 to 2006
was extended in about 6.5 times. Investigation
o f the IS in 3 years (1989,1998 and 2006) shows
that the IS was concentrated and expanded from
the Central part of the city with a growing
tendency to the North, West and East o f the city
and along the main roads. Fig. 3 shows the
trend o f urban IS development with a strong
slope between 1998 and 2006, indicating that
Ho Chi Minh City is becoming a mega city in
the late years. It requires a reasonable urban
management for sustainable development in the
íuture.
Table 1. Total area of impervious surfaces in 1989,
1998, and 2006
4. Results and discussion
4.1. Urban development through IS
The results o f image derived IS were
obtained with a fairly high accuracy through
coníusion matrix. The overall accuracy and
Kappa coeffícient o f all 3 years were greater
Year
2006
1998
1989
IS area (ha)
46,488.38
18,693.32
7,147.42
Fig. 2. IS distribution of Ho Chi Minh City in 3 years.
% total area
31.98
12.86
4.92
164
T.T. Van, H.D .X. Bao / VN U Ịoum al of Science, Earth Sríences 24 (2008) 160-167
Y«r
Fig. 3. The ứend of urban IS development in Ho Chi
Minh City.
4.2. L S T distribution and impact o f the urban
development on surface temperature
The
LST
measurements
from
the
meteorological stations are recorded only in
very sparse sites. Thereíore, they can not tell us
the temperature in somewhere we neeđ.
However, the remote sensing method can do it.
The retrieved LST maps show the picture of
LST distribution in an area. In this study, the
accuracy o f the satellite LST retrieval is
determined by comparing the estimated LST
from Aster image 2006 to the in-situ
measurements in 10 observed points. It showed
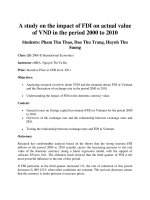
that the bias was less than 2°c. The maps in
Fig. 4 were produced to show the spatial
distribution o f emissivity-coưected LST in
1989, 1998 and 2006. The statistics o f LST in
Table 2 indicates that the highest temperature
was increased from 39.8°c in 1989 to 49.4°c in
2006. It was only the instantaneous results in
the time o f image acquisition. But if it is
considered that the 2006 imagc was recorded in
the late o f cool period o f December, it could be
think that the temperature was increased by time.
The remote sensing method provides not
only a measure o f the magnitude o f surface
temperatures o f the entire city area, but also the
spatial extent o f SUHI effects. From Fig. 2 and
4 it is obvious that the IS distribution is
proportional to the high LST One. The LST
maps in 1989 and 2006 show the extension o f
the high LST areas with the expansion o f
developed urban areas. The heat islands were
found in some hot spots over the study area. In
the 1989 map, the high LST is shown in the
bare land in the north o f the city. There was not
to be an extensive hot spot in the old urban
areas. In this time the urban IS was not much in
comparing to vegetation cover, so it was less
effective to increase the LST.
The rapid process o f urbanization after
íormation o f the five new districts in 1997
caused the increase o f the SUHI from 1998 to
2006. In the 2006 LST map, an extensive SUHI
is concentrated in the Central part city. One
SUHI was developed in the north o f the city in
Cu Chi District. The third one was found in Thu
Duc District o f the eastem part. The highest
LSTs (>45°C) were found in the industrial
zones, where the temperature was created from
the production activities plus the received solar
radiance. The urban areas have suffered the
temperature within 36-40°C. In addition, the
wind cừculation in urban areas is limited by the
building elevation and structure. So with this
temperature level human body always senses
uncomíortable and requires air cooling. The
more air conditions are used, the more heat is
released, and the temperature is increased then.
In spite o f that, in the suburban and rural areas
where the agricultural land still remains with
the full vegetation cover the LST usually is
lower.
Table 2. Statistics of LST at the time of satellite
image acquisition
Year
1989-01-16
1998-01-25
2006-12-25
Min
12.1
22.3
17.5
Max
39.8
43.5
49.4
T.T. Van, H .D .X. Bao / V N U Ịoum al o f Science, Earth Sciences 24 (2008) 160-167
1989
1998
165
2006
F ig. 4. D istrib u tio n o f lan d surface tem peraU ưe in 1989, 1998 and 2006.
4.3. The relationship between L S T and land
cover types
The relationship between LST and land
cover types was investigated for íurther
understanding the eíĩect o f urban development.
Table 3 and Fig. 5 show the average
temperature o f land cover. It is apparent that
where the human is present, the heat is released
and increased. The highest temperatures are
always in industrial zones and urban areas. This
implies that urban growth brings up surface
temperature by replacing natural vegetation
with
non-evaporating,
non-transpirating
suríaces such as impermeable stone, metal and
concrete. The agricultural land with grown
crops in suburban areas has the lower
temperature. Forest shows a considerable low
surface temperature in 3 years, because dense
vegetatĩon can reduce the amount o f heaí stored
in soỉl and suríace structures through
transpừation. By time with the same type o f
land cover their LST show a positive slope (Fig,
6). It tells us that the temperature tendency is
increased, particularly when the process of
ứidustrialization and urbanization are developed
by human demands. The graph in Fig. 7
exhibits the trend o f in-situ aừ temperature
measurement in meteorological station located
in urban area o f Ho Chi Minh City. The air
temperature is the result o f the process of
atmosphere heat from the sun radiation and
from the earth suríace. So the high LST will
contribute in high increase o f the air
temperature. This graph reílects the same
picture from the remote sensing results.
T ab le 3. A v erag e lan d su ríace tem perature (°C ) b y land co v e r type
Land cover type
Industrial zone
Built-up land
Barc land (construction site)
Land after crop
Land unđer crop
Forest
Water
1/16/1989
Min
Max
Mean
-
-
-
33.7
32.6
36.3
36.7
33.1
35.0
34.6
32.2
29.9
25.1
31.6
27.7
23.1
20.3
27.1
24.9
32.3
22.6
1/25/1998
Max
Min
40.0
43.5
34.5
39.3
33.7
38.8
33.4
37.7
25.6
30.8
24.7
28.4
23.9
29.8
Mean
41.7
36.9
36.2
35.6
28.2
26.5
26.9
12/25/2006
Min
Max
49.4
45.0
35.0
43.9
41.4
31.9
33.9 41.9
28.3
34.2
28.4
29.7
26.8
33.5
Mean
47.2
39.4
36.6
<37.9
31.2
29,1
30.1
166
T.T. Van, H .D .X. Bao / VN U Ịoum al ofSâence, Earth Sciences 24 (2008) Ĩ60-Í67
4.4. Urban environment management with
reasonable control o f imperviousness and heat
island ẹffects
0«
crop
-
1/2V1Í9Í
crop
,
,
Land c o v tr
—
12/25/2008
Fig. 5. Average LST by land cover in 1989, 1998,
and 2006.
— ♦ — m duttrtal ỉo n o
-
'UTbttn
— ầ — barB land
— M— land iílercrop
— m— Imd Uìốer OOP
toTMl
—4 w«ỉ«f
19®
1988
2006
V i« r
Fig. 6. The trend of average LST by land cover in
1989, 1998, and 2006.
Y««r
Fig. 7. Annual mean aứ temperature in the urban
area of Ho Chi Minh City, 1985-2006.
Urban areas are already remarkable
concentrations o f climate vulnerability and
prọịected rates o f urban development mean that
vulnerability will increase at the same time as
the impacts o f climate change become
increasingly maniíest. Actions by planners,
designers and
inírastructure owners in
sustainable management of urban envứonment
are required in the short term if cities are to
avoid becoming ever more vulnerable in the
long term. These are already urgent problems.
Heat islands can am pliíy extreme hot
vveather events, which can cause heat stroke and
lead to physiological disruption, organ damage,
and even death - especially in vulnerable
populations such as the elderly. Sunưner-time
heat islands increase energy demand for air
conditioning, raising power plant emissions o f
harmíul pollutants. Higher temperatures also
accelerate the chemical reaction that produces
ground-level ozone, or smog. This threatens
public health and the environment.
The above investigation shows that urban
development relates to the impervious surface
presence and aíĩects on SƯHI extension which
can be detected from the satellite images.
Therefore, in the urban management strategies
it is necessary to control the urban development
according to the plan. Moreover, vegetation
plays an important role in making the urban
climate equable. Accorđing to the information
from the website o f Ministry o f Natural
Resources and Environment ữí 2008, the green
space in Ho Chi Minh City achieves on an
average only 0.6m 2/person, vvhich is 10 times
lower than the standards. Hence, there are some
steps that the community can take to lessen the
impacts o f heat islands, such as ( 1) installing
cool roofs or vegetated green roofs, ( 2)
installing green roofs, (3) switching to cool
paving materials and (4) planting trees and
vegetation.
T.T. Van, H .D .X. Bao / VN U Ịoum al o f Science, Earth Sciences 24 (2008) 160-167
However, some íactors, such as land-use
patteros, materials used in road and building
construction, and the coverage of urban ừees
and vegetation,... can be directly affected by the
decision makers. This is where policies and
programs for reducing the impacts of heat
islands (and achieving related environmental
and energy-savings goals) can be most
effective.
5. Conclusions
Urban đevelopment intensity and spatial
extent can be characterized by using satellite
remote sensing data through mapping the
impervious surface distribution. This study has
shown that different urban development
intensities, deíìned by IS, have significant
effects on LST. The urban and built-up area in
the northem part of Ho Chi Minh City has
expanded by 6.5 times from 1989 to 2006 year,
and the urban development has altered the
magnitude and pattem of SUHI. Application of
satellite thermal inírared data to the study of
LST suggests that different land cover types
have distinctive responses. The convcrsion of
natural and vegetated surfaces into urban
development purposes will rise the temperature
and increase the spatial variability of LST.
Temperature is an important meteorological
factor in the process of forming the climate.
The urban development and expansion lead to
increase of LST and íormation of extensive
SUHI over the urban areas. This has impact not
only on the local level but also on the global
level if the temperature is increased more and
more. If LST can be used as a surrogate for air
temperature, then urban planners and managers
can utilize satellite-derived measurements to
indicate the need for new or revised urban
design and landscaping policies for mitigating
the UHI and SUHI effects on the climate
condition.
167
Acknovvledgements
This paper was completed within the
framework of Fundamental Research Project
719706 funded by Vietnam Ministry of Science
and Technology.
Reíerences
[1] C.L. A m old, C.J. Gibbons, Im pervious surface:
The em ergence o f a key urban environmenta]
indicator, Am erican Planning Association
Journal 62, 2 (1996) 243.
[2] K.B. B am es, J.M . Morgan III, M .c . Roberge,
Im pervious surfaces and the quality o f natural
and built environm ents, Proịecl lo map
im pervious cover f o r the entire Chesapeake Bay
a n d M aryland Coastal Bays waíersheds,
son.edu/landscape/im pervi
ous/indicator.asp, 2001.
[3] G. Bovvles, Impervious surface - an environmental
indicator, The Land Use Tracker 2, 1 (2002).
A vailablc
at
http://w w w .uw sp.edu/C N R /
landcenter/tracker/sum m er2002/en virindic.html
[4] K.P. Czạjkowski ct ai., Estimating environmcntal
variables using thennal rem ote sensing, in
Therm al R em ote Sensing in L and Surface
Processes, CRC Press, New York, 2004.
[5] A.N. French, T.J. Schm ugge, J .c . Ritchie, A.
Hsu, F. Jacob, K. Ogawa, D etecting land COVCT
change at the Jom ada Experim ental Rangc, New
M exico w ith A STER em issivities, Rem ote
Sensing o f Environm ent 112 (2008) 1730.
[6] R .p. Gupta, Rem ote sensing geologỵ, SpringerV erlag Berlin Heidelberg, G erm any, 1991.
[7] B.L. Markham, J.L. Barkevvr, Landsat MSS and TM
post calibration dynanúc ranges, exoatm ospheric
reflcctance and at-satellite tem pcratures, E O S A T
Landsat Technical Noíes 1 (1986) 3.
[8] T. O ke, Boundary layer clim ates, Routledge,
N ew York, 1987.
[9] T.R. Schueler, The importance o f imperviousncss.
Watershed Protection Techniques 1,3 (1994) 100.
[10] E. Valor, V. Caselles, M apping land suríace
em issivity from NDVI: application to European,
A frican, and South Am erican areas, Rem ote
Sensing o f Environm ent 57 (1996) 167.