DSpace at VNU: Evaluating the efficiency and productivity of Vietnamese commercial banks: A data envelopment analysis and Malmquist index
Bạn đang xem bản rút gọn của tài liệu. Xem và tải ngay bản đầy đủ của tài liệu tại đây (322.97 KB, 12 trang )
VNU Journal of Science, Economics and Business 28, No. 2 (2012) 103‐114
Evaluating the efficiency and productivity of Vietnamese
commercial banks: A data envelopment analysis
and Malmquist index
MA. Nguyen Thi Hong Vinh*
Faculty of International Finance and Banking, Banking University of Ho Chi Minh City,
No 39 Ham Nghi, Ward Ben Nghe, District 1, Ho Chi Minh City, Vietnam
Received 14 November 2011
Abstract. This paper provides a new evidence on the performance of twenty Vietnamese
commercial banks over the period 2007-2010. The study used Data Envelopment Analysis to
analyze the efficiency and productivity change of Vietnamese commercial banks. The results show
that the efficiency of Vietnam commercial banks increased from 0.7 in 2007 to 0.818 in 2010.
However, the results suggest that Vietnamese banks suffer slight inefficiencies during the global
financial crisis in 2008. In addition, the results show the average annual growth of the Malmquist
index 8.8 percent over the study period despite having dropped by 24.9 percent in 2009. These
findings can help bank managers and government to understand banks’ efficiency performance
and the underlying reasons of inefficiency.
Keywords: Bank efficiency, data envelopment analysis (DEA), Malmquist index, Vietnam.
1. Introduction*
difficult for the interpretation of the results.
Non-parametric frontier method - Data
Envelopment Analysis (DEA) has become
increasingly popular in measuring bank
efficiency in the countries with developed
banking systems.
This study used Data Envelopment Analysis
(DEA) approach to measure the efficiency of
the Vietnamese commercial banks from 2007 to
2010. The study investigates how efficient is
the Vietnamese banking system and what need
to be changed to improve the performance of
the banking sector. Panel data of twenty
Vietnamese commercial banks was used for the
empirical research.
The research findings present a number of
challenges, which will provide useful
Over the years the intensive and
continuously increasing competition in the
Vietnamese banking sector has created a need
to evaluate the efficiency of the commercial
banks. Such evaluations are essential to both
bank managers and customers who expect highlevel financial profit performances. To estimate
the efficiency of the banks, we can apply
different methods. Analysis of financial
indicators is the most popular efficiency
analysis method used to assess banks’
efficiency, but this method applies so many
financial indicators that it has probably caused
______
*
Tel.: 84-4-38214660
E-mail:
103
104
N.T.H. Vinh / VNU Journal of Science, Economics and Business 28, No. 2 (2012) 103‐114
opportunities for further research in the future.
They are also useful for bank management in
identifying sources of inefficiency, particularly
for banks failing to achieve satisfactory levels
of output given the resources they have been
utilizing.
The rest of the paper is structured as
follows. Section 2 reviews the recent
developments of the Vietnamese banking sector
Section 3 discusses previous approaches to
the measurement banks’ efficiency. Section 4
discusses the method and data use in the
study. Empirical results are presented in section
5. Section 6 offers concluding remarks of the
study.
Gj
2. Recent development of the banking sector in
Vietnam
The Vietnamese banking system is
experiencing significant changes since Vietnam
became a member of WTO in 2007. Over the
last twenty years, the Vietnamese financial
system and particularly the banking system
have transferred from a monopoly system into a
diversified system which allows all participants
to compete fairly and effectively.
Over the years, the banking system in
Vietnam has gradually developed with the
number of banking institutions, the size of the
banking sector, the amount of credits and
banking services increased.
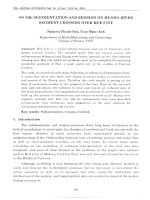
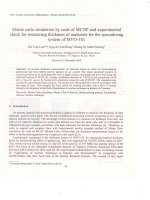
Figure 1: Number of Commercial banks in Vietnam, 2007-2010.
Source: State Bank of Vietnam, 2007-2010.
Figure 1 shows the number of banks in
Vietnam over the period 2007-2010. By the end
of 2010, the financial and banking system
developed rapidly: the number of banking
institutions in Vietnam reached 101; the credit
institutions comprised of five state owned
commercial banks (SOCBs); one social policy
bank; 37 joint stock commercial banks (JSCBs);
five joint venture banks; 48 foreign bank
branches; and five 100% foreign owned banks.
yi
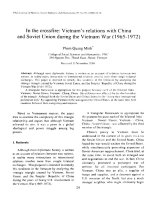
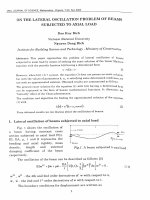
Figure 2: Credit growth, deposit growth and GDP rate, 2007-2009.
Source: State Bank of Vietnam, 2007-2010.
N.T.H. Vinh / VNU Journal of Science, Economics and Business 28, No. 2 (2012) 103‐114
Figure 2 shows the credit growth in
Vietnam is much higher than the growth rate of
GDP and this leads to increase in liquidity
risk. Credit growth averaged 36% over the
period 2007-2010, while GDP growth averaged
only 7.15% during the same period. If the GDP
growth rate is around 7%, credit growth may
reach 14-20% which may not cause the credit
bubble. However, when this ratio exceeds 20%
it will negatively affect the health of the
economy.
The scale of Vietnamese banking sector has
expanded significantly
in
recent
years.
According to the IMF (2010), the total assets
of bank
branches
have double in
the
period 2007-2010, from 1,097 trillion dong
(52.4 billion dollars) to 2,690 trillion dong
(128.7 billion dollars). This was forecasted
to rise to 3,667 trillion dongs (175.4 billion
dollars) by the end of 2012.
Despite of its development in the recent
years, the Vietnam banking sector is not
immune from the global financial crisis which
started in 2008. This posed a challenge to the
banking sector in Vietnam in terms of effective
performance. One of the main problems the
Vietnamese banking sector especially the
commercial banks is facing now is how to
effectively improve their operation efficiency.
3. Literature review on measuring efficiency
of commercial banks
A financial institution or a bank can be said
to be efficient if it has the ability to produce a
result with minimum effort or resources. It
measures how close a production unit gets to its
production possibility frontier, which is
composed of sets of points that optimally
combine inputs in order to produce one unit of
output. (Kablan, 2010).
There are several methods to measure
banks’ efficiency. These methods can be
classified into (1) traditional method of
financial indices based on balance sheet
105
analysis, (2) parametric methods based on the
knowledge of production function, and (3) nonparametric methods that do not require such
knowledge.
Popular approaches to measurement of
efficiency are inclined to focus on simple
financial ratios, but they have a number of
deficiencies. Berger et al. (1997) noted that
financial ratios may be misleading because they
do not control for product mix or input prices.
The second approach focuses on production
function or cost function of banks, in which the
estimated function can be viewed as an optimal
function of the banking system (Banker &
Maindiratta, 1988). This parametric estimate is
based on a regression model with certain
confidence intervals and deviations, therefore,
the parametric is statistically recognized. In
their survey from 1992-1997, Berger and
Humphrey (1997) reported that more than 52
percent of researchers preferred using
parametric approach in measuring the
efficiency of the financial institutions.
However, the assumption of this estimation is
often not tenable, especially when the scale of
measurement (sample size) is small. In this
situation, the nonparametric approach was
preferred.
This study uses Data Envelopment Analysis
(DEA), a non-parametric technique originally
developed by Charnes Cooper & Rhodes (1978)
to measure banks’ efficiency. The method
developed on the basis of constant returns to
scale, but subsequently extended by Banker
Charnes & Cooper (1984) into a model
providing for variable returns to scale. It does
not specify any functional form for the data,
allowing it (reflected in the weights for the
inputs and outputs) to be determined by the
data.
This modern efficiency measurement begins
with Farrell (1957) who defined a simple
measure of firm efficiency which could account
for multiple inputs. Farrell proposed that the
efficiency of a firm consists of two
components: Technical Efficiency (TE), which
106
N.T.H. Vinh / VNU Journal of Science, Economics and Business 28, No. 2 (2012) 103‐114
reflects the ability of a firm to obtain maximal
output from a given set of inputs, and Allocative
Efficiency (AE), which reflects the ability of a
firm to use the inputs in optimal proportions,
given their respective prices. These two
measures are then combined to provide a
measure of total economic efficiency. Two other
terms used to measure efficiency of a firm are
Scale efficiency and Cost efficiency. Scale
Efficiency (SE) is the scale of operation
maximizing the ratio of the linear sum of
outputs to the linear sum of inputs. Cost
Efficiency (CE) measures the possible
reductions in cost that can be achieved if a bank
is technically and allocatively efficient
(Elyasiani and Mehdian, 1990).
In the past few years, DEA has frequently
been applied to banking industry studies. The
first application analyzed efficiencies of
different branches of a single bank. Sherman
and Gold (1985) studied the overall efficiency
of 14 branches of a U.S. savings bank. The
DEA results showed that six branches were
operating inefficiently compared to the others.
A similar study by Parkan (1987) suggested that
eleven branches out of thirty-five were
relatively inefficient.
In addition to the heavy concentration on
the U.S, DEA has fast become a popular
method to assess the efficiency of financial
institutions in other nations. Fukuyama (1993,
1995) was among the early researchers among
Asian countries to employ DEA to investigate
banking
efficiency.
Fukuyama
(1993)
considered the efficiency of 143 Japanese banks
in 1990. He found that the pure technical
efficiency averaged around 0.86 and scale
efficiency around 0.98 implying that the major
source of overall technical inefficiency is purely
technical inefficiency. Xiaogang Chen (2005)
examines the cost, technical and allocative
efficiency of 43 Chinese banks over the period
1993 to 2000. Results show that the large stateowned banks and smaller banks are more
efficient than medium sized Chinese banks. In
addition, technical efficiency consistently
dominates the allocative efficiency of Chinese
banks.
In Vietnam, there are some researchers who
have studied the liberalization process of the
Vietnamese financial system as well as the
banking sector (Le, 2006; Ngo, 2004, 2009a)
such as measuring the efficiency of the
Vietnamese commercial banks (Ngo, 2010b;
Nguyen, 2007), using bootstrapping technique
to improve the Malmquist productivity index
for these banks (Nguyen & DeBorger, 2008).
Nguyen (2007) conducted a research on 13
commercial banks in Vietnam for the period
2001-2003. The study focused on the efficiency
performance of 13 Vietnamese commercial
banks in terms of efficiency change,
productivity growth, and technological change.
The author found that these banks were
inefficient in both allocative (regulatory) and
technical (managerial capacity), of which the
technical inefficiency was more imminent
(Nguyen, 2007).
Recently, Ngo (2010) evaluates the
efficiency of 22 Vietnamese commercial banks
in 2008. This research comes to a conclusion
that the average of the efficiency scores of these
banks is close to optimal score, which means
they are producing close to the frontier. X. Q.
Nguyen & DeBorger (2008) studies the
efficiency and productivity change of a sample
of Vietnamese commercial banks for the period
2003-2006, using a Malmquist index approach.
It is found that the productivity of Vietnamese
banks tended to decrease over the small sample
period, except for the year 2005.
4. Method, data and definitions of variables
4.1. Data envelopment analysis (DEA) and the
malmquist index
DEA is a linear programming technique for
examining how a particular decision making
unit (DMU, or bank in this study) operates
relative to the other banks in the sample. The
technique creates a frontier set by efficient
N.T.H. Vinh / VNU Journal of Science, Economics and Business 28, No. 2 (2012) 103‐114
banks and compares it with inefficient banks to
produce efficiency scores. Furthermore, banks
bordered between zero and one scores with
completely efficient bank have an efficiency
score of one.
The basic or multiplier form of the DEA in
the constant returns to scale version, can be
expressed as a requirement to maximize
efficiency, for output weights u and input
weights v, for i inputs x and j outputs y (with u
and v indicate vectors). If we set the weighted
sum of inputs as 1, a bank can maximize its
efficiency by solving the following equation:
max (uy )
(1)
uv
j
vx =1
st
i
uy - vx < 0
j
i
u, v > 0
Because DEA assesses the efficiency by
comparing a financial institution’s efficiency
with those of others, each inefficient financial
institution will have a group of efficient
institutions against which its performance is
identified as inefficient. This group of efficient
institutions is then described as being the
reference set for that inefficient institution. This
is the basis for arguing that DEA provides an
operational approach to measurement of
107
efficiency, in that it more directly identifies
ways in which inefficiency can be reduced.
DEA can be used to derive measures of
scale efficiency by using the variable returns to
scale. Coelli et al (1998) note that variable
returns to scale models have been most
commonly used since the beginning of the
1990s. As Dyson et al (2001) note, if a variable
returns to scale model is used, small and large
units will tend to be over-rated in the efficiency
assessment. This means that scale inefficiencies
identified for such institutions may be spurious,
with the actual cause of inefficiency. If a
constant return to scale model shows a DMU as
inefficient, it may be difficult to ascertain
whether the source of that inefficiency is scale
or technical inefficiency.
The Malmquist productivity index can be
used to identify productivity differences
between two firms or one firm over two-time
periods. To estimate technical efficiency
changes and technological changes over the
period in question, we used a decomposed
Malmquist productivity index based on ratios of
output distance functions.
Fare et al (1994) specifies an output-based
Malmquist productivity change index as:
D t ( x t 1 , y t 1 D t 1 ( xt 1 , y t 1
m0 ( x t 1 , y t 1 , xt , y t ) 0 t t t 0 t 1 t t
D (x , y )
D0 ( x , y )
0
(2)
Therefore, we have equation of technological efficiency (TE):
D0t 1 ( x t 1 , y t 1 )
TE
D0t ( xt , y t )
(3)
And technical change (TC) is calculated as:
D0t ( x t 1 , y t 1 D0t ( x t , y t
TC t 1 t 1 t 1 t 1 t t
D0 ( x , y ) D0 ( x , y )
In each of the equation above, a value
greater than one indicates an improvement and
a value smaller than one presents deteriorations
in performance over time. If productivity
increases, it implies that the Malmquist index is
greater than 1. Productivity decreases in
association with the Malmquist index lower
than 1. In addition, the increase in each division
108
N.T.H. Vinh / VNU Journal of Science, Economics and Business 28, No. 2 (2012) 103‐114
of the Malmquist index will lead to the value of
the parts if it is greater than 1. By definition, the
product of efficiency and technical change will
equal to the Malmquist index, and these
components can change in opposite directions.
4.2. Descriptions of data and variables
The panel data set is extracted from nonconsolidated income statements and balance
sheets of twenty Vietnamese commercial banks
during the period of 2007-2010. The twenty
Vietnamese commercial banks sampled include
three State-owned banks (SOCB), and
seventeen joint-stock commercial banks
(JSCB). Most of the banks that the author can
not get data for are joint-venture banks and
small banks. Indeed, the time period 2007-2010
was specifically chosen to study the impacts of
the recent financial crisis on the efficiency of
Vietnamese banks.
In measuring the technical efficiency and
productivity of banks, the most difficult
problem is how outputs and inputs of banking
activities should be defined. In the banking
literature, such as Berger and Humphrey
(1997), there are two main approaches to
measure the flow of services provided by
financial institutions: the production and
intermediation approaches.
The input and output definition used in this
study is a variation of the intermediation
approach, which was originally developed by
Sealey and Lindley (1977). The intermediation
approach assumes that financial firms act as an
intermediary between savers and investors. It
may be more appropriate for evaluation of the
entire financial institution because this
approach is inclusive of interest expenses,
which often accounts for one-haft to two-thirds
of the bank’s total costs. Further, the
intermediation approach may be superior for
evaluating the importance of frontier efficiency
of the financial institution, since minimization
of total costs, not just production costs, is
needed to maximize profits.
Following Drake (2003), Sathye (2001),
and Fukuyama (1993, 1995) among others, the
intermediation approach or asset approach to
define bank inputs and outputs would be
adopted.
Based
on available
data sources and previous studies (Denizer and
Dinc (2000), Matthews and Tripe (2002), and
Nguyen (2007) as well as the actual
operation of commercial banks, this study
chooses two outputs and three inputs (Table 1)
Specifically, outputs in this study are defined to
include interest and similar income and noninterest income which relates to income from
fees and commission, income from dealing with
foreign currencies and gold, and income from
investments or securities. These items represent
important earning assets of the commercial
banks. To produce these outputs, this study
assumes banks use three kinds of inputs: labor,
fixed assets, and deposit from customers. The
labor input is simply measured as the number of
employees. Fixed assets serves as a proxy for a
more refined capital input: they are defined as
the book value of fixed assets on balance
sheets. Finally, deposits from customers are an
important input of commercial banks.
Table 1: Outputs and Inputs of commercial banks in the study.
Output
y1: Interest income
y2: Non-interest income
Input
x1: Labor expenses (Labor)
x2: Fixed assets (Capital)
x3: Savings deposits (Deposits)
fdh
5. Empirical results
Table 2 reports the summary statistics for
the variables used in the models to estimate the
efficiency measure. The statistics are calculated
from yearly data in which all variables are
expressed in VND million. From the data in
Table 2, it is evident that commercial banks in
N.T.H. Vinh / VNU Journal of Science, Economics and Business 28, No. 2 (2012) 103‐114
Vietnam are very much diversified in size and
activity. Three inputs tend to increase over
time, particularly the Savings deposits rises
strongly between 2009 and 2010. This may be
due to improvements in technology and the
growth of commercial bank system. Table
2 also shows the trend of the two outputs. We
can
see the
bank's income is
109
primarily from interest
income
and noninterest income has increased over
this
period but only a small proportion. Thus, it is
clear
that
the income from credit
operations remains as a high proportion of the
income structure of banks. This shows the
income structure of banks has not been
diversified.
Table 2: Vietnamese banks summary statistics 1997-2000
Mean
Med
Sd
Max
Min
Interest Income
Non-Interest Income
Labor Expenses
Physical Capital
Saving Deposits
3349976
752096
304413.6
304345.3
32531343
1667396
213495.5
103518
192824.5
10345051
4401884
1714662
464593.9
305492.4
44715053
15431166
7652195
1619189
996671
141589093
395574
56438
31595
47250
2804869
2008
Interest Income
Non-Interest Income
Labor Expenses
Physical Capital
Saving Deposits
5557246
708091.3
490073.6
429871.9
38684132
3268587
298271
165234.5
290685
13070056
6210778
778253.1
749475
369479.3
50367715
22124352
2549575
2947019
1279280
166290689
1031749
38627
68380
64178
4336883
2009
Interest Income
Non-Interest Income
Labor Expenses
Physical Capital
Saving Deposits
5188448
884600.7
603824.7
525489.7
48968719
3548057
392978
223769.5
291331
22527565
5313382
1038285
863402.2
490899.7
56217863
21183619
3599177
3480790
1775244
188828078
1015237
75545
91848
97167
8051896
2010
Interest Income
Non-Interest Income
Labor Expenses
Physical Capital
Saving Deposits
9022319
1239629
812736
648540.9
64783220
5550310
720138.5
378933.5
447485.5
36787327
8958951
1255971
1078130
587000.4
72421676
31919188
4146303
3928879
2206346
244700635
1595968
113228
137121
126554
339560
2007
hk
5.1. Bank efficiency measures
Table 3 presents the average technical
efficiency (TE) scores for each of the
commercial banks over four year period from
2007-2010. The results suggest that the TE over
the sample increases substantially in the last
two sample years, and the highest value
obtained for 2009 is 0.865. On average TE
scores, private banks (JSCB) have greater
efficiency than state-owned commercial banks
SOCB (78.3% compared with 63%). This
suggests that during the study period, JSCB
110
N.T.H. Vinh / VNU Journal of Science, Economics and Business 28, No. 2 (2012) 103‐114
used their resources slightly more effectively.
This may be the consequence of a number of
advantages that joint-stock commercial banks had
during this period. They managed risk better, and
their pressure of finance crisis were less than
state-owned, customers have trust in these banks;
moreover, they are more competitive in raising
funds, opening new branches, etc.
The average technical efficiency of the
entire sample of twenty commercial banks for
the study period reached 0.767 suggesting that
the commercial banks in Vietnam produce the
same output level each other, used 76.7% of the
inputs, which implies the bank’s resources were
wasted at a rate of 23.3%.
Table
4 shows the
average
interest cost of SOCBs is about 3.5 times higher
than JSCBs, and the average labor cost of SOCBs is
about 9 times higher than JSCBs. Due to higher costs,
SOCBs has a lower TE than JSCBs.
Table 3: Technical efficiency of commercial banks, 2007-2010
Bank's Name
TE
2007
2008
2009
2011
Mean (2007-2010)
ABB
0.606
0.644
0.753
0.702
0.676
ACB
0.434
0.622
0.924
0.820
0.700
BIDV
1.000
0.650
0.966
0.591
0.802
EIB
0.463
0.535
0.847
0.699
0.636
HBB
1.000
0.659
1.000
1.000
0.915
HDB
0.788
1.000
0.630
0.804
0.806
MB
0.677
0.565
1.000
0.775
0.754
MHB
0.811
0.848
1.000
0.644
0.826
MSB
0.987
0.664
1.000
1.000
0.913
OCB
0.627
0.574
0.724
0.767
0.673
SEAB
1.000
1.000
0.772
1.000
0.943
SGB
0.595
0.560
0.744
1.000
0.725
SHB
0.850
0.802
0.878
0.730
0.815
PNB
0.561
0.653
1.000
1.000
0.804
STB
0.334
0.611
1.000
0.717
0.666
TCB
0.504
0.796
1.000
0.748
0.762
VAB
1.000
1.000
0.787
1.000
0.947
VIB
0.466
0.545
1.000
1.000
0.753
VCB
0.707
0.492
0.874
0.822
0.724
ICB
0.591
0.498
0.394
0.541
0.506
Mean TE SOCBs
0.577
0.547
0.745
0.651
0.630
Mean TE JSCBs
0.688
0.710
0.886
0.847
0.783
Mean TE all banks
0.700
0.686
0.865
0.818
0.767
Source: Author’s estimates based on DEA result.
N.T.H. Vinh / VNU Journal of Science, Economics and Business 28, No. 2 (2012) 103‐114
111
Table 4: Average interest cost and labor cost of Vietnam commercial banks, 2007-2010
Average interest cost
(million VND)
Average labor cost
(million VND)
SOCBs
JSCBs
SOCBs
JSCBs
2007
916,420
196,332
1,269,856
134,041
2008
1,108,250
310,158
2,042,702
216,080
2009
1,385,169
240,014
2,419,417
283,426
2010
1,623,859
476,426
3,191,562
392,943
Source: Author’s estimates based on banks’ Annual Reports.
Table 5: Summary of estimated efficiency measures, 2007-2010
Year
ALL OBS
TE
PE
2007
SE
AE
CE
TE
PE
2008
SE
AE
CE
TE
PE
2009
SE
AE
CE
TE
PE
2010
SE
AE
CE
TE
PE
MEAN 2007-2010 SE
AE
CE
Mean
0.700
0.806
0.867
0.784
0.548
0.686
0.871
0.794
0.81
0.565
0.865
0.963
0.894
0.81
0.701
0.818
0.943
0.873
0.825
0.683
0.767
0.900
0.857
0.807
0.624
Std. Dev
0.217
0.201
0.139
0.163005
0.21852
0.166
0.138
0.161
0.18289
0.218655
0.162
0.101
0.126
0.164
0.203
0.153
0.115
0.149
0.159
0.220
0.112
0.0441
0.015
0.011
0.008
Max
1.000
1.000
1.000
1.000
1.000
1.000
1.000
1.000
1.000
1.000
1.000
1.000
1.000
1.000
1.000
1.000
1.000
1.000
1.000
1.000
0.947
1.000
1.000
1.000
1.000
Min
0.334
0.468
0.592
0.373
0.254
0.492
0.665
0.492
0.383
0.191
0.394
0.586
0.63
0.384
0.307
0.541
0.644
0.541
0.471
0.361
0.506
0.468
0.492
0.373
0.191
Obs
20
20
20
20
20
20
20
20
20
20
20
20
20
20
20
20
20
20
20
20
20
20
20
20
20
Note: CE = cost efficiency; AE = allocative efficiency; TE = technical efficiency; PE = pure technical
efficiency; and SE = scale efficiency.
Source: Author’s estimates based on DEA result.
Table 5 presents the mean score of TE, PE,
SE, AE and CE of the twenty Vietnamese
banks. In general, these efficiency scores were
on an upward trend during the study period.
The CE for the banks was 54.8 percent in 2007,
56.5 percent in 2008, 70.1 percent in 2009, and
68.3 percent in 2010. However, it is interesting
to note that Vietnam banking industry
experienced slight inefficiencies in 2007 and
2008 (0.548 and 0.565, respectively) compared
to 2009 and 2010 (70.1 and 68.3 respectively).
This is because of the global financial crisis
which broke out in 2008.
In addition, the mean TE (at 0.767) was
lower than the mean AE (at 0.807) which
implies the main source of cost inefficiencies in
112
N.T.H. Vinh / VNU Journal of Science, Economics and Business 28, No. 2 (2012) 103‐114
the Vietnamese banks was most likely
attributable to managerial capacity and much
less to regulatory problems of the studied
banks. The mean score of the SE for
Vietnamese banks (at 0.857) was slightly lower
than the PE (at 0.900) over the study period.
This result suggests that technical efficiency
might be attributable to pure technical
efficiency rather than scale efficiency.
Table 6 summarizes the results of the
commercial banks in Vietnam operating with
decreasing returns to scale, increasing returns to
scale, and constant return to scale. In 2010, four
out of 20 banks exhibited increasing returns to
scale, eight produced on the efficient frontier,
and other eight banks exhibited decreased
returns to scale. The result indicates a number
of banks that had constant returns to scale rise
over the years. Thus, if these banks continued
to increase their performance scale up, this
would lead to an increase of overall efficiency.
Table 6: Number of banks with DRS, IRS, and Cons, 2007-2010
DRS
IRS
CONS
Total
2007
2008
2009
2010
6
10
4
20
10
7
3
20
4
8
8
20
8
4
8
20
Source: Author’s estimates based on DEA result.
5.2. Malmquist index result
Table 7 and 8 summarizes the geometric
average productivity indices, listing the
Malmquist index or productivity change results
(tfpch) and its components, corresponding to
efficiency change (effch) and technological
change (techch), for twenty Vietnamese
commercial banks in each year analyzed. The
Malmquist multifactor productivity index
improved by 8.8 percent for the four-year
period. This positive change was due to both
efficiency change, increased by 6.4 percent, and
technological change, increased by 2.2 percent.
All indices indicate growth during the period
2007-2010 except the Malmquist TFP index
from 2008-2009. Multifactor productivity also
significantly dropped to 75.1 percent in the
period 2008-2009. The main cause of this
decrease was that the technological change
index was only 59.7 percent. In fact, the
efficiency change increased 26.6 percent in the
same period.
In addition, the technological change
increased from 0.593 in 2009 to 1.499 in 2010.
The growth of Malmquist Index in 2010 was
1.424, meaning that there was an increase in
TFP by 42.4 percent. This total factor
productivity improvement was attributable to
technological change than to efficiency change.
Indeed, in 2010, the innovation in Vietnam
banking technology improved and the
technological progress was satisfactory.
Table 7: Malmquist index summary of annual means
Year
2008
2009
2010
Mean
effch
1.002
1.266
0.95
techch
1.200
0.593
1.499
pech
1.058
1.125
0.98
sech
0.948
1.125
0.97
tfpch
1.203
0.751
1.424
1.064
1.022
1.053
1.011
1.088
Note: effch = efficiency change; techch = technical or technological change; pech = pure technical efficiency
change; sech = scale efficiency change; and tfpch = total factor productivity change
113
N.T.H. Vinh / VNU Journal of Science, Economics and Business 28, No. 2 (2012) 103‐114
Table 8: Summary of malmquist index components of individual banks
Bank
ID
1
2
3
4
5
6
7
8
9
10
11
12
13
14
15
16
17
18
19
20
Mean
Malmquist TFP Index
Technological change
Efficiency change
2008
2009
2010
2008
2009 2010
2008
2009
1.334
0.678
1.111 1.256
0.579 1.191
1.063
1.17
1.758
0.857
1.14
1.229
0.576 1.285
1.431
1.487
0.563
1.075
0.868 0.867
0.724 1.418
0.65
1.485
1.382
0.944
1.073 1.196
0.596 1.301
1.156
1.584
0.917
0.797
1.288 1.392
0.525 1.288
0.659
1.518
1.623
0.314
1.435 1.279
0.499 1.124
1.268
0.63
0.879
1.207
0.96
1.053
0.682 1.239
0.835
1.77
1.456
0.759
0.857 1.393
0.644 1.331
1.045
1.18
1.349
1.066
1.427 2.004
0.709 1.427
0.673
1.505
1.275
0.724
1.288 1.393
0.574 1.216
0.916
1.261
1.505
0.368
1.169 1.505
0.476 0.924
1
0.772
1.25
0.752
2.309 1.329
0.566 1.717
0.94
1.329
0.766
0.702
1.168 0.812
0.642 1.403
0.943
1.094
1.291
0.884
1.264 1.109
0.577 1.264
1.164
1.532
2.434
0.844
1.229 1.328
0.516 1.716
1.832
1.636
1.704
0.761
1.031 1.08
0.606 1.378
1.577
1.257
0.673
0.439
2.302 0.673
0.557 1.812
1
0.787
1.666
1.1
1.296 1.423
0.6
1.296
1.171
1.833
0.718
1.363
1.188 1.033
0.766 1.264
0.696
1.778
1.089
0.429
1.995 1.294
0.541 1.456
0.842
0.793
1.203
0.751
1.424 1.2
0.593 1.499
1.002
1.266
Source: Author’s estimates based on DEA result.
6. Concluding remarks
In this paper, the efficiency measures and
productivity change are calculated by utilizing the
non-parametric technique, Data Envelopment
Analysis. Several conclusions have emerged.
Firstly, the results indicated that the banks’
efficiency average was around 0.7 in 2007, 0.686
in 2008, 0.865 in 2009 and 0.818 in 2010. In
addition, joint-stock commercial banks have an
efficiency greater than the state-owned
commercial banks (78.3% compared with 63%)
over the sample period. The overall efficiency
(0.767) results suggest that inefficiency across
twenty Vietnamese commercial banks is over 30
percent. Secondly, the study suggests that
technical efficiency might be attributable to pure
technical efficiency rather than scale efficiency
because the mean PE (at 0.9) is higher than SE (at
0.857). Similarly, Vietnamese banks in the sample
suffered from the global financial crisis in 20072008 but performed very well thereafter.
Finally, the study analyzed the changes in
total factor productivity (TFP) among the sampled
2010
0.933
0.888
0.612
0.825
1
1.277
0.775
0.644
1
1.059
1.296
1.344
0.832
1
0.717
0.748
1.27
1
0.94
1.37
0.95
banks. The findings indicate that the average
annual growth of the Malmquist index was
positive (8.8%) over the study period. The
findings can help the Vietnam government to
establish suitable policies to improve banks’
efficiency in the right direction. As for bank
managers, this study can help them to understand
the underlying reasons for their banks’ efficiency
and how to improve it efficiently.
References
[1] Banker, R.D, and Maindiratta, A. (1988),
“Nonparametric Analysis of Technical and
Allocative
Efficiencies
in
Production”,
Econometrica, p. 56.
[2] Banker, R. D., A. Charmens, and W. W. Cooper
(1984), “Some Models for Estimating Technical and
Scale Inefficiencies in Data Envelopment Analysis”,
Management Science. 30, pp. 1078-1092.
[3] Berger, A. N. and D. B. Humphrey (1997), “Efficiency
of Financial Institutions: International Survey and
Directions for Future Research”, European Journal of
Operational Research, 98, pp. 175-212.
[4] Cevdet A. Denizer and Mustafa Dinc (2000),
Measuring banking efficiency in the Pre- and Post-
114
[5]
[6]
[7]
[8]
[9]
[10]
[11]
N.T.H. Vinh / VNU Journal of Science, Economics and Business 28, No. 2 (2012) 103‐114
liberalization environment: Evidence from the Turkish
banking system, George Washington University.
Charnes, A., W. W. Cooper, and E. Rhodes (1978),
“Measuring the Efficiency, of Decision Making
Units”, European Journal of Operational Research,
2, pp. 429-444.
Coelli, T. (1996), “A guide to DEAP version 2.1: A
data envelopment analysis (computer) program”,
CEPA Working paper, University of New England,
/>E. Elysiani and S. Mehdian. (1990), “A non-parametric
approach to measurement of efficiency and
technological change: The case of large U.S banks“,
Journal of Financial Services Research, 157-68.
Farrell, M. (1957), “The measurement of productive
efficiency”, Journal of the Royal Statistical Society.
Series A (General) 120(3), 253-290.
Fare, R., Grosskopf, S., Norris, M. and Zhang, Z.
(1994), “Productivity growth, technical progress,
and efficiency change in industrialized countries”,
The American Economic Review 84(1), 66-83.
Internaltional Monetar Fund (2010), IMF country report.
Kablan (2010), “Banking Efficiency and Financial
Development in Sub-Saharan Africa”, IMF
Working paper, WP/10/136.
[12] Matthews, C. and Tripe, D. (2002), Banking
efficiency in Papua New Guinea, Centre for banking
studies, Massey University.
[13] Ngo, D. T. (2010), Evaluating Vietnamese
Commercial Banks Using Data Envelopment
Analysis Approach (Vietnamese). SSRN eLibrary.
[14] Nguyen, V. H. (2007), Measuring Efficiency Of
Vietnamese Commercial Banks: An Application Of
Data Envelopment Analysis (DEA). In K. M.
Nguyen and T. L. Giang (Eds.), Technical
Efficiency and Productivity Growth in Vietnam (pp.
11). Hanoi: Publishing House of Social Labour.
[15] Nguyen, X. Q. and Bruno De Borger (2008),
“Bootstrapping
efficiency
and
Malmquist
productivity indices: An application to Vietnamese
commercial banks”, Asia-Pacific Productivity
Conference 2008.
[16] Sealey, C. and Lindley, J. (1977), “Inputs, outputs and
a theory of production and cost at depository financial
institutions”, Journal of Finance 32, 1251-1266.
[17] Xiaogang Chen, Michael Skully, Kym Brown
(2005), “Banking efficiency in China: Application
of DEA to pre- and post-deregulation eras: 19932000”, China Economic Review 16 (2005) 229-245.
Đánh giá hiệu quả của các Ngân hàng Thương mại Việt Nam
bằng phương pháp phân tích bao dữ liệu và chỉ số Malmquist
ThS. Nguyễn Thị Hồng Vinh
Khoa Ngân hàng Quốc tế, Trường Đại học Ngân hàng Thành phố Hồ Chí Minh,
39 Hàm Nghi, Phường Bến Nghé, Quận 1, Thành phố Hồ Chí Minh, Việt Nam
Tóm tắt. Bài viết tập trung đánh giá hiệu quả sử dụng nguồn lực của 20 ngân hàng thương mại
giai đoạn 2007-2010. Tác giả dựa trên phương pháp phân tích bao dữ liệu để đo lường hiệu quả kỹ
thuật và chỉ số Malmquist của các ngân hàng thương mại. Kết quả cho thấy hiệu quả kỹ thuật của các
ngân hàng thương mại tăng từ 0,7 năm 2007 đến 0,818 năm 2010. Tuy nhiên, các ngân hàng thương
mại hoạt động vẫn chưa hiệu quả trong giai đoạn khủng hoảng tài chính toàn cầu năm 2008. Nghiên
cứu cũng cho thấy chỉ số Malmquist tăng 8,8% trung bình mỗi năm, mặc dù có sự sụt giảm trong năm
2009. Kết quả này giúp cho nhà hoạch định chính sách cũng như nhà quản lý ngân hàng biết được tình
hình hoạt động của ngân hàng và những lý do ngân hàng hoạt động chưa hiệu quả, từ đó nỗ lực cải
thiện hiệu quả sử dụng nguồn lực của các ngân hàng thương mại.