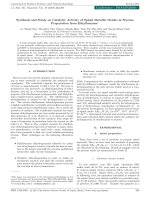
DSpace at VNU: Synthesis, Structural and Optical Characterization of CdTeSe ZnSe and CdTeSe ZnTe Core Shell Ternary Quantum Dots for Potential Application in Solar Cells
Bạn đang xem bản rút gọn của tài liệu. Xem và tải ngay bản đầy đủ của tài liệu tại đây (1.6 MB, 7 trang )
Journal of ELECTRONIC MATERIALS
DOI: 10.1007/s11664-016-4578-2
Ó 2016 The Minerals, Metals & Materials Society
Synthesis, Structural and Optical Characterization of CdTeSe/
ZnSe and CdTeSe/ZnTe Core/Shell Ternary Quantum Dots
for Potential Application in Solar Cells
LE XUAN HUNG,1 PHAM NAM THANG,2 HOANG VAN NONG,2
NGUYEN HAI YEN,2 VU ÐUC CHINH,2 LE VAN VU,3
NGUYEN THI THUC HIEN,1 WILLY DANEY DE MARCILLAC,4
PHAN NGOC HONG,2 NGUYEN THU LOAN,2,4 CATHERINE SCHWOB,4
` S MAIˆTRE,4 NGUYEN QUANG LIEM,2 PAUL BE
´ NALLOUL,4
AGNE
4
1,2,5
LAURENT COOLEN, and PHAM THU NGA
1.—Institute of Research and Development, Duy Tan University, Da Nang, Vietnam. 2.—Institute
of Materials Science, Vietnam Academy of Science and Technology, 18 Hoang Quoc Viet Road, Cau
giay Dist., Hanoi, Vietnam. 3.—Center for Materials Science, University of Natural Science, VNU,
Hanoi, Vietnam. 4.—Sorbonne Universite´s, UPMC Univ Paris 06, UMR 7588, Institut de
NanoSciences de Paris (INSP), 75005 Paris, France. 5.—e-mail:
This work presents the results on the fabrication, structural and optical
properties of CdTeSe/ZnTe and CdTeSe/ZnSe n monolayers (ML) (with
n = 0,1,2,4 and 6 being the nominal shell monolayer thickness) ternary alloyed
core/shell quantum dots (QDs). Transmission electron microscopy has been
used to observe the shape and size of the QDs. These QDs crystallize at the
zinc-blende phase. Raman scattering has been used to characterize the
CdTeSe QDs’ alloy composition in the fabrication and coating processes. The
Raman spectrum of CdTeSe QDs, in the frequency range from 100 cmÀ1 to
300 cmÀ1, is a composite band with two peaks at 160 cmÀ1 and 192 cmÀ1.
When the thickness of the ZnTe shell is 4 ML, the peak of the Raman spectrum only appears at 160 cmÀ1. For the ZnSe 4 ML shell, the peak only appears at $200 cmÀ1. This shows that the nature of the CdTeSe QDs is either
CdTe-rich or CdSe-rich depending on the shell of each sample. The shell
thickness of 2 ML does not change the ternary core QDs’ crystalline phase.
The absorption and photoluminescence spectra show that the absorption and
emission bands can be shifted to 900 nm, depending on each ternary alloyed
QD core/shell sample. This near-infrared spectrum region is suitable for
applications in solar cells.
Key words: Alloyed quantum dots, CdTeSe core/shell ternary QDs, Raman
spectra, PL spectra
INTRODUCTION
Quantum dots (QDs) with photoluminescence
(PL) emission in the near-infrared (NIR) range
(700–900 nm) have been the subject of many studies
in the context of in vivo imaging or semiconductor
QD-sensitized solar cells. While CdSe (bulk band
(Received October 8, 2015; accepted April 25, 2016)
gap 1.74 eV) has been used to cover large parts of
the visible spectrum, CdTe (bulk band gap 1.43 eV)
provides access to NIR wavelengths. Moreover, the
synthesis of CdTeSe QDs allows more degrees of
freedom by combining the confinement effects of the
QDs with the alloying effects of CdTeSe. Ternary
CdTeSe QDs were first reported by Bailey et al.1
Since then, emission up to 800 or even 900 nm has
been reported, with a non-linear relationship
between the alloy composition and the absorption/
Hung, Thang, van Nong, Yen, Chinh, van Vu, Hien, de Marcillac, Hong, Loan,
Schwob, Maıˆtre, Liem, Be´nalloul, Coolen, and Nga
emission energies. The growth of a higher-band gap
shell in order to improve QD stability and quantum
yield has been the subject of few reports for
CdTeSeQDs. Pons et al. reported about NIR-emitting CdTeSe/CdZnS core/shell QDs,2 CdTeSe/
CdZnS3 and CdTeSe/ZnS.4–7 Recently H. Zhou
et al. reported the synthesis of multishell CdTeSe/
ZnSe/ZnS QDs.8 However, the number of publications concerning the coating of CdTeSe QD with
ZnTe and ZnSe is still limited.
To address a novel method for fabricating QDs
with NIR PL, more efforts to use other preparation
methods of synthesizing QDs have been undertaken
in our group. Here, we discuss the synthesis of
CdTeSe QDs and their coating with ZnSe or ZnTe
shells, with PL emission up to 900 nm. Detailed
studies on the vibration and optical characteristics
of ternary alloyed QDs are also discussed in this
paper.
EXPERIMENTAL
Materials
We used the following reagents (from Aldrich) for
the shell preparation: cadmium acetate dihydrate
(Cd(Ac)2Æ2H2O, 99.9%) as a source of Cd, elemental
selenium powder (Se, 99.99%) as a source of Se,
elemental tellurium powder (Te, 99.99%) as a source
of Te, zinc acetate (Zn(Ac)2, 99.9%) as a source of
Zn, oleic acid (OA, 90%) and oleylamine (OLA,90%)
as surface ligands, and 1-octadecene (ODE, 90%)
and trioctylphosphine (TOP, 90%) as the reaction
medium. All chemicals were used without further
purification.
Synthesis Method
CdTeSe cores were prepared following a modified
method described in.9–14 Core–shell alloy QDs were
prepared according to a modified successive ion
layer absorption and reaction (SILAR) protocol that
has been previously published.13 To carry out the
fabrication of CdTeSe QDs with core/shell structure
CdTeSe/ZnSe and CdTeSe/ZnTe, we followed three
steps. The first was to prepare precursors, then the
CdTeSe cores, and finally to coat the QD cores with
ZnSe and ZnTe shells of different thicknesses
counted by monolayer (ML), n, from n = 1, 2, 4 to
6 ML (n is the nominal thickness; we calculated the
amounts of shell precursors to introduce into the
solution in order to have stoichiometric proportions
to the concentration of core QDs, depending on the
core size estimated from TEM).
In this study, we fabricated 1 mmol of CdTeSe
QDs in an OLA-ODE medium with two different
molar ratios Cd:Te:Se = 1:1.8:1.8, close to the ratio
used in our recent publication13 and 10:1:1, as used
in.11,14 Different results were obtained depending
on the molar ratio. For these two molar ratios, just
by changing the initial masses of Cd, Te and Se,
respectively, we can fabricate 1 mmol CdTeSe. The
processes of fabricating the precursors and creating
QDs were carried out in a nitrogen gas atmosphere.
The fabrication method was revised from recent
publications,9–12 but after many experiments, we
have established a new method that requires a
reduced amount of TOP as compared to,2 while in9
only ODE is used, but the volume used to dissolve
cadmium acetate is large, thus it is disadvantageous
for the fabrication of QDs later on.
To fabricate the Cd precursor, we dissolved an
appropriate amount of cadmium acetate dihydrate
(corresponding to Cd:Te:Se = 10:1:1), in a mixture of
1.6 mL OA and 75 mL ODE. The mixture was
vigorously stirred in an N2 gas atmosphere at
120°C. Then, we reduced the heat to 80°C and
added 5 mL OLA and 2.5 mL ODE to the mixture.
We continued stirring for 30 min; finally, we
obtained a solution of Cd precursor in OLA-ODE.
To fabricate the TOP-Se precursor, we used 0.04 g
of Se powder corresponding to 0.5 mmol, and dissolved it in 0.5 mL of TOP at 80°C–100°C for about
10 min, until the Se dissolved completely. To fabricate the TOP-Te precursor, we used 0.064 g of Te
powder, corresponding to 0.5 mmol, dissolved it in
0.85 mL TOP at 80°C–90°C in an ultrasonic vibrator for about 15 min until the Te dissolved completely. However, since Te is a metal powder that is
hard to dissolve in TOP, we had to pump carefully to
remove all the air in the flask for approximately 2 h,
before running N2 gas through it. Afterwards, we
injected the TOP-Se solution into a flask with the
TOP-Te solution and mixed it by using an ultrasonic
vibrator for 15 min to allow these two precursors to
be completely mixed. Then, we obtained the TOP-Se
and TOP-Te to be used for the alloy QD fabrication.
To fabricate the CdTeSe core QDs, we quickly
injected the mixed precursors TOP-Se and TOP-Te
into a three-necked flask containing the Cd precursor solution at 120°C for 1 h, in N2 gas. We
increased the temperature gradually to 180°C,
200°C and 220°C, and kept it stable at each
temperature for a period from 10 min to 1 h, while
vigorously stirring the reacting solution, to create
nanoparticle seeds and grow them. Then, we
allowed the solution to cool slowly while stirring
with a magnetic stirrer.
The Process of Coating ZnSe and ZnTe for CdTeSe
Core QDs
Similar to fabricating the core. When coating
ZnSe or ZnTe for the CdTeSe cores, we also had to
fabricate the precursors for the shell material. The
process of fabricating the precursors for Se and Te is
completely identical to the one presented above. We
obtained the zinc stock solution by dissolving 0.28 g
zinc acetate in 4.2 mL TOP in a flask at 120°C in N2
gas until the zinc acetate was completely dissolved,
which took around 30 min.
The masses of Zn and Te were calculated for 1
ML, 2 ML, 4 ML and 6 ML of ZnSe and ZnTe. The
Synthesis, Structural and Optical Characterization of CdTeSe/ZnSe and CdTeSe/ZnTe Core/
Shell Ternary Quantum Dots for Potential Application in Solar Cells
ML thickness is based on the lattice constant a of
ZnSe or ZnTe crystals, depending on the type of
shell. The molar ratio of Zn:Te was 1:1.
In order to coat the CdTeSe cores, we used
46.4 mL of the CdTeSe core QD solution
($1.6 mmol) and poured it into a three-necked
flask, and quickly raised the temperature to
220°C. At this temperature, we quickly injected
2.8 mL of the Zn precursor solution (corresponding
to a monolayer of Zn ions) and stirred vigorously for
15 min. Then, we quickly injected 1.3 mL of TOP-Te
and stirred vigorously for 15 min to grow the shell.
Next, we removed 25 mL of the solution containing
QDs, which was comprised of CdTeSe/ZnTe 1 ML.
With the remaining volume, we continued to quickly
inject 1.4 mL of Zn precursor, stirred vigorously for
10 min, then injected TOP-Se (0.7 mL), stirred
vigorously to grow the ZnTe particles’ shell for
15 min. We obtained CdTeSe/ZnTe 2 ML. We performed the same operations when coating ZnSe for
CdTeSe QD cores to form CdTeSe/ZnSe.
All ternary quantum dots were purified by several
rounds of precipitation and centrifugation and were
stored at room temperature for later characterization and use.
Characterization of CdTeSe/ZnSe (Te)
Core/Shell Ternary Quantum Dots
The size of the core QDs and the shell thicknesses
were determined by transmission electron microscopy (TEM) with a JEOL Jem 1010 microscope
operating at 100 kV. Powder x-ray diffraction (XRD;
Siemens D5005) was used to confirm the wurtzite
(w) or zinc-blende (zb) crystalline structure.
The ultraviolet–visible (UV–Vis) absorption spectra of the QDs in toluene were scanned within the
wavelength range of 200 nm–600 nm using a Shimadzu (UV-1800) UV–Vis spectrophotometer. All
UV–Vis measurements were performed at 25°C and
automatically corrected for the solvent medium.
The fluorescence spectra measurement was carried out on a Fluorolog-322 system by Yvon using
Xenon 450 W light; the detector is a photomultiplier, measuring range from 250 nm to 800 nm. An
Acton SpectraPro-2300i spectrometer with He-Cd
laser emitted at two wavelengths, 442 nm and
325 nm, was also used to measure the emission
spectra. The PL decays were analyzed with a PM
Hamamatsu R5600U and a Tektronix TDS 784A
scope with a time resolution of 1 ns.
The QD samples were analyzed by Micro Raman
spectroscopy (XploRA; Horiba) using 532 nm
(90 mW) or 785 nm (25 mW) excitation lines from
a diode-pumped, solid-state laser to analyze the
vibration bonds and their Raman frequencies. The
laser power was 100 mW. Objectives of 910 were
used to focus the excitation laser light on the right
spot of the investigated samples. The spot size of
laser beam was 1 lm. The spectral resolution was
2 cmÀ1. The acquisition time ranged from 30 s to
120 s, but normally was 30 s. The system uses a
charge coupled device (CCD) receiver with four
gratings, 600 g/mm, 1200 g/mm, 1800 g/mm and
to
2400 g/mm,
measuring
from
100 cmÀ1
À1
4000 cm .
With XRD, EDS and Raman measurements, the
CdTeSe QD samples were used in solid form. These
samples were purified by washing thrice with
isopropanol. The sample that was used to measure
TEM, absorption and fluorescence spectra was in
solution in toluene, after being purified of ligands
and any remaining excess substances after QD
fabrication.
RESULTS AND DISCUSSION
The aim of this research was to fabricate CdTeSe
QDs, whose emission can change in the range from
red to near-infrared, to apply in sensitizers for solar
cells or biology. This study was also conducted to
discover the method that uses a small amount of
TOP and no trioctylphosphine oxide (TOPO) or
hexadecylamine (HDA), and grows QDs at a moderate temperature ($220°C). To eliminate the electronic traps on the surface of the QDs and make it
easy to modify and functionalize their surfaces, the
QDs were coated. Two kinds of shell materials were
used: ZnTe and ZnSe. Here, we present some
experimental results on the CdTeSe cores fabricated
under the conditions described in the experimental
sections above, along with the results on QDs with
core/shell structure.
TEM Images
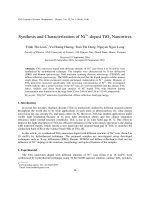
Figure 1 presents the TEM images of samples
CdTeSe QDs prepared at 220°C, the samples
CdTeSe/ZnSe nML (n = 0, 2 and 4) and the samples
CdTeSe/ZnTe nML (n = 0 and 4), to show the shape,
size and size distribution of the fabricated QDs. The
shape of the QDs cores is rather elongated. We
estimated an average of the QD diameter over 80–
90 particles. For the sample series, CdTeSe coated
with ZnSe, the sizes of the three QD samples (in the
longer dimension) are as follows: 6.3 nm for the
CdTeSe core, 7.3 nm when coated with an additional 2 ML ZnSe shell, and 7.2 nm with 4 ML. For
the CdTeSe coated with ZnTe, the core size is
7.3 nm and the QDs are 8.1 nm with ZnTe 4 ML.
The size obtained by fitting to the Lorentz function
and the average error of the measured size is ±5%.
The shorter dimension reaches $5 nm. The size
distribution curve of these QDs samples is rather
narrow.
Raman Spectra
We used the phonon spectrum provided by Raman
spectroscopy in order to have the information on the
crystalline phase of CdTeSe QDs coated with ZnTe
and ZnSe, forming CdTeSe/ZnTe and CdTeSe/ZnSe
core/shell structures. Figure 2 shows the Raman
Hung, Thang, van Nong, Yen, Chinh, van Vu, Hien, de Marcillac, Hong, Loan,
Schwob, Maıˆtre, Liem, Be´nalloul, Coolen, and Nga
Fig. 1. TEM images of the CdTeSe QDs prepared at 220°C. (a), (b) and (c) correspond to the CdTeSe/ZnSe nML (n = 0, 2 and 4, respectively)
samples; (d) and (e) correspond to the CdTeSe/ZnTe nML (n = 0 and 4, respectively) samples. Scale bars 20 nm.
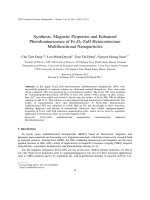
spectra of the series of CdTeSe coated with ZnTe
and ZnSe, when the shell thickness changes from 1
ML to 6 ML. In this figure, the Raman spectrum of
CdTe is brought in to be referred and compared to
the Raman spectra of the QD samples presented in
this research. The peak at 159 cmÀ1 is characteristic of CdTe longitudinal optical (LO) phonon15,16 and
its two-phonon replica are also seen weakly at
315 cmÀ1. The spectrum of the CdTeSe cores show a
second peak at 190 cmÀ1, which corresponds to the
characteristic vibration of the CdTeSe alloy.16–18
When CdTeSe is coated with a ZnTe monolayer, we
observe a similar spectrum: the frequency position
of the first peak lies at 159 cmÀ1 and that of the
second peak lies at 190 cmÀ1. The intensity of the
peak at 159 cmÀ1 is stronger compared to the peak
at 190 cmÀ1. However, when the shell thickness
increases from 2 ML to 6 ML, only one peak remains
Synthesis, Structural and Optical Characterization of CdTeSe/ZnSe and CdTeSe/ZnTe Core/
Shell Ternary Quantum Dots for Potential Application in Solar Cells
at 159 cmÀ1 (again with a two-phonon replica at
315 cmÀ1), while the other peak appears as a
shoulder that decreases as the shell thickness
increases. These results suggest that, when the
ZnTe shell thickness is increased above 2 ML, the
CdTeSe ternary alloy QDs become CdTe-rich QDs.
This may be explained by the strong chemical
activity of the Te element, so that when a large
amount is brought into the reaction flask for the
shell growth, it immediately reacts with the abundant Cd ions from the CdTeSe core fabrication (the
Cd molar ratio is 5 times larger than Te and Se), to
create a CdTe layer around CdTeSe.
When the CdTeSe QDs are coated with a ZnSe
shell from 2 ML to 6 ML thickness to form core/shell
QDs, we can observe a similar phenomenon, but this
time it is the characteristic line of the CdSe
vibration that increases. Figure 2 also shows the
Raman spectra of the CdTeSe/ZnSe nML (n = 0, 1,
2, 4 and 6) series. On the Raman spectra, there are
two observable peaks at 159 cmÀ1 and 190 cmÀ1 of
the CdTeSe core and CdTeSe/ZnSe 1 ML. These
lines are characteristic of the vibration of the
ternary alloy CdSeTe QD phase, as discussed
previously. When the nominal shell thickness
increases above 2 ML, a vibration line at 200 cmÀ1
appears and prevails, which can be assigned to the
LO peak of CdSe (200 cmÀ1). This result suggests
that, when the Zn and Se precursors are introduced
for the shell growth, since excess Cd ions are still
present while all Te ions have reacted, in this case a
Fig. 2. Raman spectra of CdTeSe QDs cores and cores coated with
shells of ZnSe and ZnTe with different monolayer thicknesses (nML,
n = 1, 2, 4 and 6).
CdSe material layer forms gradually on the CdTeSe
core, thus we obtain CdSe-rich QDs.
XRD Data
For the core and core–shell samples, the XRD
data (Figs. 3 and 4), although broadened due to the
finite size of the nanocrystallites, provides evidence
of the zinc-blende type of crystalline structure. The
samples exhibit the three peaks (a singlet peak at
low angle and a doublet of peaks at high angle)
characteristic of the zb patterns, whereas the
wurtzite patterns have four peaks (a singlet at low
angle and a triplet at high angle).1,19,20
For the CdTeSe cores prepared at different temperatures or Cd:Te:Se ratios (figure not shown), we could
observe the characteristic peaks for CdTe (zb) and
CdSe (zb) located between the crystalline phase.
Therefore, we can assume that the QDs have crystallized into zb CdTeSe crystals in the fabricated samples.
The peaks are generally slightly closer to the zb-CdTe
lines than to the zb-CdSe lines, which would indicate a
Te-rich alloy, in agreement with Raman data.
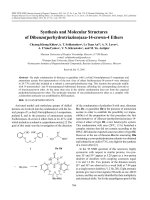
Figure 3 presents the x-ray diffraction patterns of
the core–shell CdTeSe/ZnSe sample series. The
XRD spectrum is not changed when coating with
ZnSe at 1 ML. However, when the ZnSe shell
thickness reaches 2 or 4 ML, the XRD peaks are
broadened, possibly due to sample inhomogeneities
or to non-uniform crystalline phases inside a QD.
The positions of the peaks for the 4-ML sample are
shifted towards the tabulated ZnSe peaks positions;
however, their proximity to the peaks of CdSe might
also reflect the presence of CdSe indicated by the
Raman spectra.
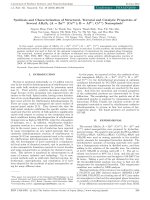
Figure 4 shows the XRD patterns for the core–shell
CdTeSe/ZnTe nML (n = 0, 1, 2, 4 and 6) sample
series. The position of the observable diffraction
peaks are inbetween the characteristic lines of zb
Fig. 3. Powder XRD patterns of CdTeSe ternary QD cores and
CdTeSe/ZnSe nML (n = 0, 1, 2, 4 and 6) prepared at temperature
equal to 220°C (for Cd:Te:Se = 10:1:1). The tabulated values of the
bulk diffraction peaks for zinc blend (zb) CdTe, (zb) CdSe and
wurtzite (w) CdSe (bottom) are shown.
Hung, Thang, van Nong, Yen, Chinh, van Vu, Hien, de Marcillac, Hong, Loan,
Schwob, Maıˆtre, Liem, Be´nalloul, Coolen, and Nga
Fig. 4. Powder XRD patterns of ternary core/shell QDs CdTeSe/
ZnTe nML (n = 0, 1, 2, 4 and 6) prepared at 220°C (10 min). The
tabulated positions of the bulk diffraction peaks for zinc blend (zb)
CdTe and (zb) CdSe are shown.
CdTe and zb CdSe crystalline phases, which hardly
change for different samples. This leads to the idea
that the ZnTe shell layers have not been grown well
on CdTeSe cores, so we can only observe the diffraction lines characteristic of the cores. However, on the
Raman spectra of these samples, the lines appear at
159 cmÀ1 for CdTeSe/ZnTe 4 ML and 6 ML, characteristic for the CdTe, and appear with significantly
stronger intensity than that of the others (Fig. 2),
meaning that there is a formation of a CdTe layer on
the CdTeSecore, which we could not detect on the
XRD spectra. Therefore, the usage of precursor to
fabricate the shell with the molar ratio Zn:Te = 1:1 in
this fabrication method needs to be improved.
Fig. 5. Absorption (dotted lines) and normalized photoluminescence
(dash dot and solid lines) spectra of the CdTeSe core samples
prepared by two different molar ratios (norm. units).
Photoluminescence Properties
Figure 5 shows the absorption spectra and normalized photoluminescence (PL) spectra of two samples of
alloyed CdSeTe core QDs that we fabricated, with two
different molar ratios: Cd:Te:Se = 1:1.8:1.8 and
10:1:1, as noted on the figure. The absorption spectra
display a clear exciton peak showing the quality of the
QDs. However, the QD samples fabricated with the
ratio Cd:Te:Se = 1:1.8:1.8 has clearer and sharper
exciton peaks. The QD emission wavelength ranges
from 650 nm to 700 nm; this could depend on both the
alloy band gap and on the QD diameter. However,
given the similar sizes of these samples, we expect
that most of the contribution to the optical transition
energy comes from the change in the QDs’ compositions (the Cd/(Te + Se) ratio). Figure 6 shows the PL
decay curve for two CdTeSe QD core samples: N3 and
N4. These two samples were fabricated under the
same conditions. These curves are slightly multiexponential, with a typical decay time (measured at 1/
e decay) t = 41 ns (N3) and t = 43 ns (N4). These
values are of the same order and suitable with the
lifetime values reported in.21 The fact that these decay
times are of the same order as the typical radiative
Fig. 6. PL decay curves (in ln scale) of the samples CdTeSe N3 and
N4.The lifetime (measured at 1/e decay) of the CdTeSe core
quantum dots are 41 ns (N3) and 43 ns (N4).
decay times for CdSe nanocrystals22,23 and that there
is not a shorter-lived component suggests that the
non-radiative decay rate is low and that the quantum
efficiency of these samples is good.
We have also fabricated CdTeSe QD samples with
an emission band at 828 nm, and coated with ZnSe
shells up to 6 ML thick. Their characteristics on
size, shape and crystalline phase are presented in
Figs. 1, 2, and 3. When coated with ZnSe, the
absorption and emission band (Fig. 7) shifts
towards the longer wavelengths, increasing with
the thickness of ZnSe. The emission peak of these
QDs reaches 866 nm at 1 ML, 915 nm at 2 ML,
925 nm at 4 ML and 940 nm at 6 ML.The reason for
this shift is not yet fully understood; it may involve
Synthesis, Structural and Optical Characterization of CdTeSe/ZnSe and CdTeSe/ZnTe Core/
Shell Ternary Quantum Dots for Potential Application in Solar Cells
ZnSe or ZnTe 2 ML shell, the QDs still display a
crystalline phase similar to that of alloyed QD cores.
The QDs with a core/shell structure, like CdTeSe/
ZnSe, can absorb up to nearly 800 nm and emit up
to nearly 900 nm. We are presently working on the
application of these QDs to improve NIR absorption
of solar cell devices.
ACKNOWLEDGEMENTS
This research is funded by Vietnam National
Foundation for Science and Technology Development
(NAFOSTED) under Grant Number 103.03-2014.66,
the PICS cooperation projects between CNRS and
VAST (Project Number 6456 and VAST.HTQT.
Phap. 01/15-16), by the Centre de Compe´tences
C’Nano–Ile de France (NanoPlasmAA project) and
the Agence Nationale de la Recherche (Ponimi project). The authors thank the National Key Laboratory for Electronic Materials and Devices—IMS and
Duy Tan University for the use of facilities.
REFERENCES
Fig. 7. Absorption (dotted lines, normalized) and photoluminescence (solid lines, normalized) spectra of the five CdTeSe/ZnSe
nML, n = 0, 1, 2, 4 and 6. (norm. units). T = 220°C (10 min) T
shell = 200°C (10 min).
decay through surface traps created at the shell
surface. The emission intensity increases when
coated with ZnSe 1 ML and 2 ML. However, when
the thickness reaches 4 ML, the emission intensity
decreases. Therefore, it can be said that, for CdTeSe
QDs, the optimum ZnSe-shell thickness is 2 ML.
The measurement of the lifetime of these QD
samples (not shown here) also shows that, when
CdTeSe is coated with a 1- or 2-ML layer of ZnSe, its
lifetime is longer than the core’s. This matches the
results on the increase of emission intensity when
the shell reaches 2 ML of ZnSe.
CONCLUSION
In summary, we have successfully fabricated
CdTeSe QDs with a core/shell structure with the
molar ratio Cd:Te:Se = 10:1:1, at temperatures from
180°C to 220°C. The use of ZnSe and ZnTe allowed
protection of the core. These core/shell CdTeSe QDs
have an elongated shape, with size $8 nm, changing depending on each sample. The characterization
of these QDs with Raman spectroscopy has shown
that it is a strong tool to detect the forming of the
ternary alloyed CdTeSe crystalline phase. This
research shows that some incorporation of the Se
or Te inside the core might occur, and that the best
thickness of the ZnSe or ZnTe shell for the CdTeSe
QDs’ core is 2 ML, since the results from the Raman
spectra and XRD show that ,when coated with a
1. R.E. Bailey and S. Nie, J. Am. Chem. Soc. 125, 7100 (2003).
2. T. Pons, N. Lequeux, B. Mahler, S. Sasnouski, A. Fragola,
and B. Dubertret, Chem. Mater. 21, 1418 (2009).
3. P. Yang, S. Wang, and N. Murase, Nanoscale Res. Lett. 7,
615 (2012).
4. J.L.C. Espinola, T.V. Torchynska, J.A.J. Go´mez, J. Douda,
and K. Gazarian, Mater. Res. Soc. Symp. Proc. 1534, 127A
(2013).
5. T.V. Torchynsk, Phys. E 51, 55 (2013).
6. G.X. Liang, L.L. Li, H.Y. Liu, J.R. Zhang, C. Burda, and J.
Zhu, Chem. Commun. 46, 2974 (2010).
7. X. Xu, Y. Wang, W. Xia, L. Zhou, F. Gong, and L. Wu,
Mater. Chem. Phys. 139, 210 (2013).
8. H. Zhou, G. Zhou, J. Zhou, D. Xu, X. Zhang, P. Kong, and Z.
Yang, Mater. Res. Bull. 65, 53 (2015).
9. R. Wang, O. Calvignanello, C.I. Ratcliffe, X. Wu, D.M.
Leek, MdB Zaman, D. Kingston, J.A. Ripmeester, and K.
Yu, J. Phys. Chem. C 113, 3402 (2009).
10. L. Liu, X. Xu, T. Luo, Y. Liu, Z. Yang, and J. Lei, Solid
State Commun. 152, 1103 (2012).
11. L. Liao, H. Zhang, and X. Zhong, J. Lumin. 131, 322 (2011).
12. F. Yang, Z. Xu, J. Wang, F. Zan, C. Dong, and J. Ren, J.
Lumin. 28, 392 (2013).
13. N.H. Yen, W.D.D. Marcillac, C. Lethiec, P.N. Hong, C.
Schwob, A. Maıˆtre, N.Q. Liem, L.V. Vu, P. Be´nalloul, L.
Coolen, and P.T. Nga, Opt. Mater. 36, 1534 (2014).
14. Z. Pan, K. Zhao, J. Wang, H. Zhang, Y. Feng, and X. Zhong,
ACS Nano 7, 5215 (2013).
15. V. Dzhagan, I. Lokteva, C. Himcinschi, X. Jin, J.K. Olesiak,
and D.R.T. Zahn, Nanoscale Res. Lett. 6, 79 (2011).
16. S. Li, G. Tan, J.B. Murowchick, C. Wisner, N. Leventis, T.
Xia, X. Chen, and Z. Peng, J. Electron. Mater. 42, 3373
(2013).
17. B.T. Spann and X. Xu, Appl. Phys. Lett. 105, 083111 (2014).
18. Z. Chai, W. Wu, D. Kong, Y. Gao, Q. Chang, and J. NonCryst, Solids 82, 121 (2013).
19. S.H. Tolbert and A.P. Alivisatos, Science 265, 373 (1994).
20. S.H. Tolbert and A.P. Alivisatos, Annu. Rev. Phys. Chem.
46, 595 (1995).
21. L. Li, Y. Chen, Q. Lu, J. Ji, Y. Shen, M. Xu, R. Fei, G. Yang,
K. Zhang, J.R. Zhang, and J.J. Zhu, Sci. Rep. 3, 1529
(2013).
22. B.R. Fisher, H.-J. Eisler, N.E. Stott, and M.G. Bawendi, J.
Phys. Chem. B 108, 143 (2004).
23. X. Brokmann, L. Coolen, M. Dahan, and J.-P. Hermier,
Phys. Rev. Lett. 93, 107403 (2004).