DSpace at VNU: Motives for Mergers and Acquisitions: Ex-PostMarket Evidence from the US
Bạn đang xem bản rút gọn của tài liệu. Xem và tải ngay bản đầy đủ của tài liệu tại đây (521.55 KB, 19 trang )
Journal of Business Finance & Accounting
Journal of Business Finance & Accounting, 39(9) & (10), 1357–1375, November/December 2012, 0306-686X
doi: 10.1111/jbfa.12000
Motives for Mergers and Acquisitions:
Ex-Post Market Evidence from the US
HIEN THU NGUYEN, KENNETH YUNG AND QIAN SUN∗
Abstract: Despite extensive research, merger motivation is largely inconclusive. Incomparable
methodologies further exacerbate debates in the extant literature. This study uses a recently
developed technique to examine post-acquisition evidence as to the motives behind merger and
acquisition activity. Using a sample of 3,520 domestic acquisitions in the United States, we find
that 73% are related to market timing; 59% are related to agency motives and/or hubris; and
3% are responses to industry and economic shocks. Our results also show that about 80% of the
mergers in our sample involved multiple motives. Thus, in general it is very difficult to have a
clear picture of merger motivation because value-increasing and value-decreasing motives may
coexist.
Keywords: mergers and acquisitions, merger motivation, MB ratio decomposition
1. INTRODUCTION
In 1995, completed mergers and acquisitions (M&As) among corporations in the US
reached an aggregate value of US$377 billion. In 2005, the amount exceeded US$1.1
trillion.1 Despite extensive research, the motivation behind mergers has been largely
illusive. Event studies typically find that mergers create shareholder value over shortterm windows, despite the fact that the gain predominantly accrues to shareholders
of target firms. There is also ample evidence that acquirers have significant negative
returns over long-term windows that overwhelm their positive short-term returns,
making the net wealth effect negative (Loughran and Vijh, 1997; Rau and Vermaelen,
1998; and Andrade et al., 2001). If mergers do not create value for acquiring firms,
it is unclear what bidders intend to achieve in merger activity. Research studies of
non-US mergers have also reported inconclusive results on merger motivation. For
example, several researchers report that multiple motives may be involved in UK
mergers (Hodgkinson and Partington, 2008; and Arnold and Parker, 2009). Agarwal
∗ The first author is from the University of Technology, Vietnam National University, Ho Chi Minh City,
Vietnam. The second author is Professor of Finance at the College of Business and Public Administration,
Old Dominion University, Norfolk, USA. The third author is Associate Professor of Finance at the College
of Business, Kutztown University of Pennsylvania, USA. (Paper received February, 2008, revised version
accepted June, 2012)
Address for correspondence: Qian Sun, Associate Professor of Finance, Department of Accounting and
Finance, Kutztown University of Pennsylvania, Kutztown, PA19530, USA.
e-mail:
1 Source: Mergers and Acquisitions Magazine. Various issues.
C 2013 Blackwell Publishing Ltd, 9600 Garsington Road, Oxford OX4 2DQ, UK
and 350 Main Street, Malden, MA 02148, USA.
1357
1358
NGUYEN, YUNG AND SUN
and Bhattacharjea (2006) argue that corporate mergers in India are significantly
related to industry shocks but unrelated to managerial motives. Mehrotra et al. (2011)
find that merger announcements in Japan do not create wealth gains for shareholders
of either target or bidder firms.
There are several potential solutions to this merger motivation quandary. One
solution could be achieved by examining the stated goals in M&A announcements.
However, it would be difficult to implement because acquirers sometimes do not
announce their acquisition motives. In addition, even if there is an announcement,
there could be additional motives that are not announced. Another solution is to
infer the underlying merger motivations from ex-post market data. In other words,
we let the market tell us the motives behind the mergers. A major advantage of this
approach is that there is no need to rely on announcements of goals by acquirers in
corporate takeovers. This is particularly appealing given that some acquirers are not
straightforward about their motives.
Evaluating the motivation behind a merger can be a daunting task even if expost market data are used. The empirical literature on M&As is crisscrossed with
methodologies that show differences in time frameworks (event-time vs. calendartime), abnormal return metrics, benchmarks, and weighting procedures. The differences often lead to conflicting results and make comparisons difficult (Agrawal
and Jaffe, 2000; and Bruner, 2002). Hodgkinson and Partington (2008) specifically
report that their UK results are sensitive to whether merger gains are measured over
a long or short window and the method of measuring abnormal returns. In addition,
conclusions that are based on event studies could be biased because the abnormal
returns of bidders could be correlated due to findings that mergers often occur in
waves (Shleifer and Vishny, 2003; and Rhodes-Kropf and Viswanathan, 2004). In this
study, we overcome the issue of non-comparable methodologies by using the technique
of Rhodes-Kropf et al. (2005, henceforth RKRV) to detect the different motives
for mergers. Instead of examining the abnormal returns of acquirers, the RKRV
methodology decomposes the market-to-book (M/B) ratio and makes inferences
based on the characteristics of the components. RKRV compared the M/B ratio
components of bidders and non-bidders to infer the underlying merger motivation.
We go beyond the original RKRV study and apply RKRV’s methodology to examine
the M/B ratio components of bidders before and after a merger. We argue that the
changes in the M/B ratio components after mergers can serve as ex-post evidence of
merger motivation.
We examine a sample of 3,520 US domestic M&As in the twenty-year period between
1984 and 2004. Our results contribute to the literature in several ways. First, we
find that single-motive mergers are relatively less common. Of the 3,520 mergers
examined, 78% are related to at least two motives simultaneously. Our results show
that 73% of the mergers are related to market timing; 59% are related to agency
motives and/or hubris; and only 3% are responses to industry and economic shocks.
Our results confirm the postulations of a number of researchers that mergers could
involve multiple motives. Our finding suggests that it is generally difficult to have
a clear picture of the underlying motivation for mergers as value-increasing and
value-decreasing motives frequently coexist. Second, in using the same methodology
in evaluating merger motivation, we overcome the issue of comparability across
methodologies. In addition, our results are reliable because the conclusions are not
based on announcement period abnormal returns that are correlated across acquiring
C
2013 Blackwell Publishing Ltd
MOTIVES FOR MERGERS AND ACQUISITIONS
1359
firms in merger waves. Third, our results are based on ex-post market evidence and
are consistent with reported results that are based on pre-acquisition information.
Lastly, we show that acquirers frequently exhibit firm characteristics that may promote
multiple objectives in corporate mergers.
The rest of the paper is organized as follows. Section 2 is a review of the literature
on the motives for M&As. Section 3 describes the methodology and our hypotheses
development. Section 4 describes the sample. Results are presented in Section 5 and
the conclusion is given in Section 6.
2. LITERATURE REVIEW
Acquirer motives for M&As can be classified as either value-increasing or non-valueincreasing. Value-increasing M&As are primarily undertaken to benefit from the
synergy in combining the physical operations of the two merging firms (Bradley
et al., 1988). Various considerations drive synergistic acquisitions, including increased
market power, response to industry shocks, economies of scale, financial synergy, taxes,
and exploitation of the asymmetric information between the acquiring and target
firms. Empirical evidence on acquisitions driven by value-increasing motives is mixed.
Pound (1988) suggests that acquirers do not benefit from taking over undervalued
targets. Contradicting the market power theory, Eckbo (1985) finds competitors enjoy
positive abnormal returns around acquisition announcements. Although Hayn (1989)
finds evidence of depreciation-related tax benefits in M&As, Auerbach and Reishus
(1988) suggest that these benefits are not enough to justify mergers. Supporting
the operating synergy argument, Healy et al. (1992) find that merged firms have
a higher level of operating efficiency. Ghosh and Jain (2000) support the financial
synergy arguments by showing that financial leverage increases significantly after a
merger. Consistent with the response to industry shock theory, Weston and Chung
(1990) observe that takeovers in the 1980s were numerous in industries undergoing
deregulations and fundamental changes. Jensen (1993) also suggests that many
mergers in the 1980s were a response to the energy price shocks during that
period.
Value-decreasing motives for M&As consist of three major types: agency, hubris and
market timing. Agency problems arise when managers consume perquisites at the
expense of shareholders. Other forms of agency problems arise when managers pursue
excessive growth to promote personal interests (Morck et al., 1990), or diversify to
reduce risk to managerial human capital (Amihud and Lev, 1981), or avoid activities
that may reduce discretionary cash flows (Jensen, 1986; Stulz, 1990). The literature
has ample evidence of agency problems related to M&As. Malatesta (1983) finds
that mergers that are probably motivated by agency problems typically are valuedecreasing transactions for the acquiring firm. Morck et al. (1990) report that many
acquirers are more interested in maximizing firm size than firm value, and that many
M&As are driven by managerial objectives. Shleifer and Vishny (1989) conclude that
some acquisitions are made to enhance the dependence of the firm on the skills of
the acquiring managers, even though such acquisitions may reduce the value of the
acquiring firm.
Hubris is the second type of value-decreasing motive behind M&As. According to
Roll (1986), many corporate managers are infected by hubris and overpay for targets.
Managers affected by hubris engage in acquisitions even when there is no synergy.
C
2013 Blackwell Publishing Ltd
1360
NGUYEN, YUNG AND SUN
Moeller et al. (2004) show that larger firms, which are more likely to be run by
hubristic managers, tend to offer higher takeover premiums and are more likely to
complete a takeover than their smaller counterparts. Hayward and Hambrick (1997)
find that the size of acquisition premium is highly associated with indicators of CEO
hubris. According to Berkovitch and Narayanan (1993) and Barnes (1998), there is
strong evidence that many takeovers are motivated by hubris.
Market timing is another motive that results in value-decreasing M&As. Shleifer
and Vishny (2003) introduce a model in which overvalued acquirers use stock to buy
relatively undervalued targets even though both firms could be overvalued. According
to Shleifer and Vishny, acquisitions are basically stock market driven. Supporting the
market timing hypothesis, Dong et al. (2006) find that acquirers are on average more
highly overvalued than their targets; and high-valuation acquirers are more likely to
use stock as the payment method. In addition, acquisitions by overvalued acquirers
are typically followed by lower post-merger abnormal returns. RKRV (2005) introduce
a market timing model that is slightly different from that of Shleifer and Vishny and
provide empirical support for the market timing motive.
Some researchers have suggested that mergers may involve multiple motives. For
example, Donaldson and Lorsch (1983) posit that acquiring firms pursue growth to
enhance their long run survival and at the same time protect acquiring managers from
outside monitoring. Amihud and Lev (1981) suggest that corporate diversification
allows the firm to achieve more stable operating performance yet enables the firm’s
manager to reduce risk to his human capital. Shleifer and Vishny (1989) find evidence
that some mergers are conducted to benefit the long-term growth of the acquiring
firm and simultaneously improve the acquiring manager’s job security. Berkovitch and
Narayanan (1993) investigate synergy, hubris, and agency as motives for mergers and
conclude that the three motives simultaneously exist in some takeovers. Hodgkinson
and Partington (2008) and Arnold and Parker (2009) examine acquisitions in the
UK and conclude that mergers may involve multiple motives. Specifically, both studies
report that UK mergers are probably related to synergy and market-timing motives.
Moreover, the lack of wealth gains during merger announcements periods in Japan is
consistent with the implication that conflicting merger motivations may be involved
(Mehrotra et al., 2011).
3. TRACKING THE MOTIVES FOR M&AS AND HYPOTHESIS DEVELOPMENT
In identifying merger motivation from ex-post market data, we use the methodology
developed by RKRV. According to RKRV, the M/B ratio of a firm can be decomposed
into three components: firm-specific error, time-series sector error, and long-run valueto-book. The decomposition equation is written as:
m − b = (m − v1 ) + (v1 − v2 ) + (v2 − b),
(1)
where m and b are the market and book values of shares in logarithmic forms,
respectively. The first component, (m – v 1 ), is the difference between market value
and the fundamental value implied by industry averages at time t. This component
measures firm-specific pricing deviations from short-run industry pricing, and it exists
when the firm is experiencing short-run irrational mispricing in the market. The
second component, (v 1 – v 2 ), is the difference between the firm’s fundamental value
C
2013 Blackwell Publishing Ltd
MOTIVES FOR MERGERS AND ACQUISITIONS
1361
implied by industry averages at time t and the firm’s fundamental value implied by
long-run industry averages. This component arises when contemporaneous multiples
differ from long-run multiples. The component reflects that firms in the same industry
could share common misvaluation factors. The third component, (v 2 – b), is the
difference between the firm’s fundamental value implied by long-run industry averages
and the book value of the firm. According to RKRV, it is the third component that
captures the long-run growth opportunities of the firm.
RKRV use their model to compare the three M/B ratio components of acquirers
and non-acquirers. In this study, we take one step forward by investigating the changes
in the three M/B ratio components (i.e., firm-specific error, time-series sector error,
and long-run value-to-book) of acquirers after merger. Given that our objective is not
to identify what causes valuation errors, a negative change in the firm-specific error of
the acquiring firm after a merger is sufficient to imply that the market has recognized
the overvaluation of the firm’s common stock. Therefore, we argue that changes in the
firm-specific error are suitable for tracking the market timing motive for M&As. Based
on the findings of Dong et al. (2006), we posit that the firm-specific error component
of the acquiring firm’s M/B ratio will experience a negative change if market timing is
the motive behind the acquisition. We develop the two following hypotheses:
Hypothesis 1: In stock mergers, the firm-specific error of the acquiring firm will
experience a negative correction if market timing is the motive.
Hypothesis 2: Cash acquirers will likely experience less firm-specific error corrections than stock acquirers.
The second component of the M/B ratio in RKRV, the time-series sector error,
implies that the acquirers having this component share some temporary industry-wide
valuation adjustments. In merger activity, this is likely to occur when the acquirers
respond to system-wide fundamental shocks and attempt to obtain some benefits.
Thus, we argue that changes in the second component of the M/B ratio can be
used to track M&A motives that represent responses to industry and/or economic
shocks.
Hypothesis 3: For M&As motivated by industry and economic shocks, acquiring
firms would experience an increase in the time-series sector-wide
error after the acquisitions.
The last component of the M/B ratio, the long-run value-to-book, reflects longterm growth opportunities. We argue that this component is suitable for tracking
M&A motives that are related to agency, hubris and synergy. We posit that acquiring
firms that experience a decline in long-run value are likely to be those that suffer
from managerial entrenchment. For M&As that are related to hubris, however, we
may observe either a decline or no change in the long-run firm value. If we observe
positive changes in the long-run value of the acquiring firm, then it is likely that the
merger motive is synergy related.
Hypothesis 4: The third component, the long-run value of the M/B ratio of the
acquiring firm, is increased (decreased) if the merger is motivated by
synergy (agency or hubris).
C
2013 Blackwell Publishing Ltd
1362
NGUYEN, YUNG AND SUN
4. THE SAMPLE
Information on completed M&A deals involving publicly traded US acquirers and
targets with a deal value larger than US$10 million is collected from the Thomson
One Mergers and Acquisitions database for the 1984 to 2004 period. The initial
sample of 7,199 acquisitions includes information on announcement date, effective
date, method of payment, deal value, and proportion of acquirer’s ex-post ownership.
Stock price data are collected from the Center for Research in Securities Prices (CRSP)
database. Other relevant financial variables are collected from the Compustat data
files, including 4-digit SIC Codes, fiscal year-end dates, and accounting data.
We use the method suggested by RKRV in merging data from the three sources to
take into account that firms have different fiscal year-end dates and to ensure that the
price data reflect the corresponding year’s accounting information. This approach
of merging the three sets of data, after eliminating those observations with missing
variables or outliers, gives us a final sample of 3,520 completed merger events involving
1,973 acquiring firms. We classify the firms in the sample into two groups: merger and
non-merger. A firm is included in the merger group in the year that the firm has a
merger announcement. A firm is included in the non-merger group in the years in
which it has no merger activity.
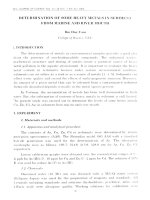
Table 1 reports the frequency distribution of the sampled mergers by year and
payment method. Of the 3,520 events, 26.70% are stock acquisitions, 40.39% are cash
offers, and 32.90% are mixed payment acquisitions. Cash is the dominant payment
method for acquisitions before 1990; stock is used more often after 1990. The number
of stock acquisitions in the 1990s is almost twice that in the 1980s. The mean deal value
in the 1990s almost doubles that in the 1980s; the median deal value increased slightly
in the 1990s.
5. M/B RATIO DECOMPOSITION RESULTS
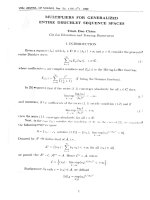
The mean and median values of M/B of acquirers one year before and up to three
years after merger are reported in Table 2. Firms that are involved in more than one
merger are grouped together as active acquirers. In Panel A, the mean M/B ratio
of all the acquirers decreases gradually from 4.01 before merger to 3.59 three years
afterwards. Similar declines are found for one-time and active acquirers. In Panel B,
the logarithm form of M/B ratio, (m – b), shows similar changes. All the declines are
significant at the 1% level, implying that mergers destroy shareholder value in general.
Changes in the three M/B components one, two and three years after merger are
reported in Table 3. In this study, we name these corrections to highlight the ex-post
market reaction regarding the acquiring firm’s valuation. Panel A reports the market
corrections of the components over the three event windows for the whole sample.
Panel B compares the corrections experienced by acquirers with those experienced
by non-merger firms. In Panels C–G of Table 3, changes in the three components of
the M/B ratio are reported, with the sample grouped according to the frequency of
merger, method of payment, proportion of shares acquired, pre-merger M/B ratio,
and acquirer’s market value.
(i) Evidence for the Market Timing Motive
For the entire sample, the firm-specific error significantly and consistently declines
in the one, two and three years after merger. Specifically, in Panel A of Table 3, the
C
2013 Blackwell Publishing Ltd
C
2013 Blackwell Publishing Ltd
5
7
5
13
11
18
13
16
18
21
21
54
62
93
128
131
117
85
40
51
31
940
1984
1985
1986
1987
1988
1989
1990
1991
1992
1993
1994
1995
1996
1997
1998
1999
2000
2001
2002
2003
2004
Total
17.86
12.00
6.90
12.94
12.16
14.85
17.81
26.42
24.59
21.18
29.85
28.75
25.85
32.64
37.33
33.33
32.67
32.73
18.68
20.77
20.00
26.70
Row%
15
38
52
54
53
56
40
21
25
30
33
79
99
91
115
145
142
85
94
93
62
1,422
Freq
53.57
64.00
75.86
54.12
60.81
47.52
46.58
33.96
36.07
38.82
47.76
41.88
40.98
31.82
33.56
36.94
39.93
32.73
43.96
38.16
37.86
40.40
Row%
All-cash Acquisitions
8
14
12
33
24
45
31
23
28
44
18
45
80
101
100
117
98
89
80
100
68
1,158
Freq
28.57
24.00
17.24
32.94
27.03
37.62
35.62
39.62
39.34
40.00
22.39
29.38
33.17
35.54
29.11
29.73
27.39
34.55
37.36
41.06
42.14
32.90
Row%
Mixed Payment
Acquisitions
28
59
68
100
87
119
88
62
72
100
79
188
240
285
344
392
357
259
204
224
165
3,520
Freq
0.80
1.67
1.94
2.84
2.47
3.38
2.44
1.77
2.04
2.84
2.24
5.35
6.85
8.09
9.76
11.13
10.13
7.36
6.08
6.92
4.68
100.00
Column%
108.7
122.1
113.2
133.1
97.2
59.5
37.3
72.3
59.7
75.4
47.2
86.3
78.5
131.2
111.1
149.2
172.9
110.4
86.4
111.0
167.2
Median
Deal Value
397.5
410.8
323.7
346.2
392.5
421.5
110.1
187.7
164.0
262.3
194.9
516.3
521.4
471.1
833.0
1, 280.5
1, 450.1
897.1
766.5
646.7
1, 311.7
Mean
All Acquisitions
Notes:
This table provides the distribution of merger events by year. Merger events are collected from the Thomson One database and are required to have acquirer
information on the Center for Research in Securities Prices (CRSP) and Compustat data tapes. Only completed deals with value greater than US$10 million are
included. All-stock and all-cash acquisitions refer to transactions that are paid wholly in stock or cash, respectively. Freq is the number of events. The mean and
median of deal value are in millions of US dollars.
Freq
Year
All-stock
Acquisitions
Table 1
Frequency Distribution of Mergers and Acquisitions by Year
MOTIVES FOR MERGERS AND ACQUISITIONS
1363
1364
NGUYEN, YUNG AND SUN
Table 2
The Market-to-Book Ratio Before and After Merger
All Acquirers
Panel A. The M/B Ratio in Base Form
N
3,520
Before event
4.01∗∗∗
2.38∗∗∗
One year after event
3.71∗∗∗
2.27∗∗∗
Two years after event
3.52∗∗∗
2.31∗∗∗
Three years after event
3.59∗∗∗
2.37∗∗∗
One-time Acquirers
Active Acquirers
992
3.20∗∗∗
1.92∗∗∗
2.79∗∗∗
1.79∗∗
2.32∗∗∗
1.74∗∗
2.83∗∗∗
1.85∗∗
2,528
4.26∗∗∗
2.52∗∗∗
3.98∗∗∗
2.40∗∗∗
3.84∗∗∗
2.48∗∗∗
3.77∗∗∗
2.60∗∗∗
Panel B. The M/B Ratio in Logarithmic Form, log(M) – log(B)
N
3,520
992
Before event
1.379∗∗∗
1.172∗∗
0.869∗∗∗
0.651∗
One year after event
1.347∗∗∗
1.095∗∗
0.823∗∗∗
0.580∗∗
Two years after event
1.250∗∗∗
1.004∗∗
0.840∗∗∗
0.555∗∗
Three years after event
1.206∗∗∗
0.935∗∗
0.867∗∗∗
0.617∗
2,528
1.425∗∗
0.923∗∗∗
1.405∗∗
0.876∗∗∗
1.301∗∗
0.908∗∗
1.225∗∗
0.954∗∗
Notes:
This table presents the average M/B ratio of acquirers before and after merger. Mean (median)
values are reported in the first and second rows, respectively. ∗∗∗ , ∗∗ and ∗ denote significance at the 1%,
5%, and 10% levels, respectively.
firm-specific error is reduced by 0.058 in one year, 0.160 in two years, and 0.172 in
three years after merger.
Panel B of Table 3 shows that the corrections of the firm-specific error of acquirers
are significantly larger than those of non-merger firms over the three windows. On
average, the correction of the firm-specific error of acquirers is 0.038 more than that
of non-merger firms in one year, 0.141 in two years, and 0.134 in three years. The result
is consistent with the implication that the market has corrected its overvaluation of the
acquirer’s share value relative to the fair value based on short-run industry averages.
The correction of the firm-specific error persists over the three event windows after
merger. This finding strongly supports Hypothesis 1 that market timing is a motive for
acquisitions. In untabulated results, Hypothesis 1 was tested by excluding finance and
utility industries and similar results were found.
Panel C of Table 3 shows that the firm-specific error of one-time acquirers is reduced
by 0.111 in one year, 0.166 in two years, and 0.224 in the three years after merger,
and all the changes are significant at the 1% level. For the active-acquirer group,
firm-specific error is reduced by 0.040 in one year, 0.158 in two years, and 0.155 in
three years. The difference between the two groups in each window is not statistically
significant. An implication is that once the market has recognized its overvaluation of
an acquirer, a one-time correction is adequate and further acquisitions by the same
acquirer do not lead to further valuation revisions by the market.
C
2013 Blackwell Publishing Ltd
MOTIVES FOR MERGERS AND ACQUISITIONS
1365
Panel D of Table 3 provides results supporting Hypothesis 2 that stock payers suffer
more firm-specific error corrections than cash payers. Panel D shows that stock payers
experience significant reductions in firm-specific mispricing over all the three event
windows, whereas cash payers experience a significant reduction only in the first two
years. The corrections experienced by stock payers range from –0.070 to –0.473 and
are much larger than those experienced by cash payers, which range from –0.039 to
–0.046. The difference between the stock and cash payers is significant at the 1% level.
The result shows a strong support for Hypothesis 2 that stock payers experience larger
firm-specific error corrections than cash payers, implying that market timing is a more
important motive among stock acquirers.
To further evaluate the market timing motive, we divide the acquirers into five
quintiles based on the pre-acquisition M/B ratio and compare the correction of the
firm-specific error between quintile one (value stocks) and quintile 5 (glamour stocks).
In Panel F of Table 3, the correction of the firm-specific error of glamour acquirers is
0.374 more than that of the value acquirers in one year, 0.366 in two years, and 0.438
in three years; and the difference between the two groups is significant at the 1% level
in each window. The result is consistent with implications that the market considers
higher-valuation acquirers more likely to have the market timing motive.
We also divide the sample into five quintiles based on the pre-acquisition market
value of the acquirer and report the result in Panel G of Table 3. We find that large
acquirers experience larger firm-specific error corrections than small acquirers. That
is, the market believes that overvaluation is more serious among glamour and/or large
acquirers and therefore corrects more strongly.
(ii) Evidence for the Response to Industry/Economic Shocks Motive
In Panel A of Table 3, the mean time-series sector error for the whole sample increases
after merger and is significant at the 1% level for both the two and three years
windows. The median value is also significant in each of the three event windows.
The result implies that the acquiring firms experience higher levels of sector-wide
valuation error after merger as the mergers are likely responses to industry/economic
shocks. However, in Panel B of Table 3, when compared with the non-merger firms’
time-series sector error corrections, the corrections of acquirers are not significantly
different from those of the non-merger firms. One possible explanation is that sectorwide errors also exist in industries that do not have industry/economic shocks; another
possible reason is that the non-merger firms are able to react to sector-wide changes
without going through mergers.
In Table 3, an increase in time-series sector error among the acquirers is consistently
found in the various sub-category analyses when the sample is sorted by the frequency
of M&A (Panel C), method of payments (Panel D), proportion of acquired shares
(Panel E), pre-acquisition M/B ratio (Panel F), and acquirer’s pre-acquisition market
value of shares (Panel G). The findings suggest that many M&As are driven by industry
and/or economic shocks.
In untabulated results, we examine the correction of time-series sector error by
industry and find that about one-third of the industries show significant increases
in time-series sector error after merger. The increase happens mainly in the business equipment, finance, chemicals, and consumer non-durables industries. These
industries experienced many price and regulatory shocks over the sample period;
C
2013 Blackwell Publishing Ltd
[0, 2]
0.012
0.016∗∗
Panel D. Post M&A Corrections: Stock vs. Cash Payers
Stock payers
−0.070∗∗∗ −0.378∗∗∗ −0.473∗∗∗
N = 940 events
−0.066
−0.180∗∗∗ −0.279∗∗∗
Cash payers
−0.039∗∗∗ −0.097∗∗∗ −0.046
N = 1,422 events
0.003∗∗∗ −0.084∗∗∗ −0.015
Other method payers
−0.048
−0.038
−0.077∗
N = 1,158 events
−0.004
−0.041∗∗∗ −0.059∗∗∗
Difference (Stock – Cash) −0.031∗∗∗ −0.281∗∗∗ −0.426∗∗∗
Difference (Cash – Other) −0.022
−0.058
0.031
Difference (Stock – Other) 0.0087
−0.339∗∗∗ −0.395∗∗∗
Panel C. Post M&A Corrections: One-time vs. Active Acquirers
One-time acquirers
−0.111∗∗∗ −0.166∗∗∗ −0.224∗∗∗
N = 992 events
−0.103∗∗∗ −0.067∗∗∗ −0.173∗∗∗
Active acquirers
−0.040∗
−0.158∗∗∗ −0.155∗∗∗
N = 2,528 events
−0.018
−0.105∗∗∗ −0.076∗∗∗
Difference (Once – Active) −0.071
−0.008
−0.069
0.046∗∗∗
0.011
0.051∗∗∗
0.050∗∗∗
−0.005
0.046∗
0.165∗∗∗
0.053∗∗∗ 0.109∗∗∗
0.001
0.010
0.015∗
0.020∗
0.028
0.014
0.006
0.028∗∗
0.045∗
0.1544∗∗∗
−0.027
−0.004
0.018
0.150∗∗∗
0.026
0.029∗
0.006
0.014
0.020
0.050∗∗∗
0.041∗∗∗
0.041∗∗∗
0.036∗∗∗
0.009
0.050∗∗∗
0.041∗∗∗
[0, 2]
0.222∗∗∗
0.141∗∗∗
0.038∗∗∗
0.016∗∗
0.056∗∗∗
0.037∗
0.184∗∗∗
−0.017
0.167∗∗∗
0.086∗∗∗
0.043∗∗∗
0.078∗∗∗
0.045∗∗∗
0.008
0.080∗∗∗
0.045∗∗∗
0.061∗∗∗
0.051∗∗∗
0.019
0.080∗∗∗
0.045∗∗∗
[0, 3]
Time-series Sector Error Correction
[0, 1]
Panel B. Post M&A Corrections: Acquiring Firms vs. Non-merger Firms
All Acquiring firms (A)
−0.058∗∗∗ −0.160∗∗∗ −0.172∗∗∗
0.012
−0.039∗∗∗ −0.089∗∗∗ −0.090∗∗∗
0.016∗∗
Non-merger firms (NM)
−0.020∗∗ −0.019∗∗∗ −0.038∗∗∗
0.016∗∗∗
N = 33,085
−0.022∗∗∗ −0.012∗∗∗ −0.027∗∗
0.001∗∗∗
Difference (A – NM)
−0.038∗∗ −0.141∗∗∗ −0.134∗∗∗ −0.004
−0.172∗∗∗
−0.090∗∗∗
[0, 3]
Firm-specific Error Correction
[0, 1]
Panel A. Post M&A Corrections: All Acquirers
All events
−0.058∗∗∗ −0.160∗∗∗
N = 3,520
−0.039∗∗∗ −0.089∗∗∗
Event windows [year]
Table 3
The Three Components of M/B
−0.019∗
0.005
−0.026
−0.006
0.021
0.033∗∗∗
−0.006
0.000
−0.047∗
0.027
−0.020
0.008
−0.002
0.009
0.022∗∗
−0.001
−0.084∗∗∗
−0.040∗∗∗
−0.007
0.026∗
0.014
0.007
−0.077∗∗
−0.021
−0.097∗∗∗
−0.068∗∗∗
−0.045∗∗∗
−0.003
0.021∗∗
−0.065∗∗
0.009
−0.019∗
0.017∗∗
0.005
−0.019∗∗∗ −0.047∗∗∗
−0.003∗∗ −0.028∗∗
0.027∗∗∗ 0.028∗∗
0.009
0.017∗∗
[0, 2]
−0.153∗∗∗
−0.069∗∗∗
−0.076∗∗∗
−0.042∗∗∗
−0.012
−0.016∗∗
−0.077∗∗
−0.064∗
−0.141∗∗∗
−0.140∗∗∗
−0.118∗∗∗
−0.062∗∗∗
−0.025∗∗∗
−0.077∗∗
−0.081∗∗∗
−0.040∗∗∗
−0.069∗∗∗
−0.045∗∗∗
−0.012
−0.081∗∗∗
−0.040∗∗∗
[0, 3]
Long-run Value Correction
[0, 1]
1366
NGUYEN, YUNG AND SUN
C
2013 Blackwell Publishing Ltd
C
2013 Blackwell Publishing Ltd
0.121∗∗∗
0.082∗∗∗
0.055∗
0.014
−0.017
0.016
−0.008
0.038∗
0.106∗∗∗
0.072∗∗∗
0.015
0.135∗∗∗
0.100∗∗∗
0.096∗∗∗
0.052∗∗
−0.025
−0.032∗
0.025
0.017
0.163∗∗∗
0.102∗∗∗
0.028
0.035
0.029
−0.006
0.087∗∗∗
0.050∗∗∗
0.058∗∗∗
0.044∗∗∗
−0.005
0.014
0.087∗∗
0.055
−0.033
0.093∗∗∗
0.066∗∗∗
0.091∗∗∗
0.084∗∗∗
0.040
0.026
0.016
−0.028∗
−0.044
0.058∗∗∗
0.018∗
0.004
0.017
0.024
0.015
Panel F. Post M&A Corrections: By the Pre-acquisition M/B Ratio of Acquirers
M/B ratio of Acquirers
Quintile 1 (value)
0.060∗∗∗ −0.048
−0.002
0.023
0.072∗∗∗
0.010
0.007
0.006
Quintile 2
−0.135∗∗∗
0.007
−0.053
0.000
−0.057∗∗∗
0.019
0.006
0.014
Quintile 3
−0.024
−0.070
−0.025
0.011
−0.040
−0.049
−0.023
0.007
Quintile 4
−0.020∗∗
−0.169∗∗∗ −0.214∗∗∗ −0.027
−0.028
−0.144∗∗∗ −0.103∗∗∗
0.016
∗∗∗
Quintile 5 (glamour)
−0.314
−0.414∗∗∗ −0.440∗∗∗
0.049∗∗
−0.246∗∗∗ −0.172∗∗∗ −0.272∗∗∗
0.050∗∗∗
∗∗∗
∗∗∗
∗∗∗
Difference (Q5 – Q1)
−0.374
−0.366
−0.438
0.027
Panel E. Post M&A Corrections: By Proportion of Shares Acquired
Acquired shares less than
−0.079
−0.060∗
−0.063∗
∗∗∗
∗
10% (Group 1)
−0.066
−0.046
−0.023
N = 869
Acquired shares greater
−0.063
−0.076
−0.050
than 10% and less than
−0.013
−0.019
−0.078
100% (Group 2)
N = 675
Acquired shares of 100%
−0.046∗
−0.240∗∗∗ −0.272∗∗∗
(Group 3)
−0.031∗
−0.129∗∗∗ −0.137∗∗∗
N = 1,976
Difference
(Group 2 – Group 1)
0.017
−0.016
0.013
(Group 3 – Group 1)
0.033
−0.180∗∗∗ −0.209∗∗∗
(Group 3 – Group 2)
0.017
−0.164∗∗∗ −0.222∗∗∗
Table 3 (Continued)
−0.053∗∗
−0.037∗∗
−0.009
−0.022∗∗
−0.014
−0.011
0.036
0.033∗∗∗
0.056∗∗∗
0.047∗∗∗
0.110∗∗∗
−0.029
0.002
0.031
0.015
0.018∗∗
−0.015
−0.028
0.014
0.032∗∗∗
−0.218∗∗∗
−0.196∗∗∗
−0.117∗∗∗
−0.103∗∗∗
−0.008
0.005
0.082∗∗∗
0.049∗∗∗
0.081∗∗∗
0.059∗∗∗
0.299∗∗∗
−0.048
−0.053∗∗
−0.005
−0.035∗∗∗
−0.011
−0.030
−0.030∗∗
0.018
0.033∗∗
−0.167∗∗∗
−0.149∗∗∗
−0.138∗∗∗
−0.122∗∗∗
−0.068∗∗
−0.044∗∗∗
−0.021
0.001
−0.048∗∗
−0.011
0.118∗∗∗
−0.076∗
−0.123∗∗∗
−0.046
−0.124∗∗∗
−0.082∗∗∗
−0.078∗∗∗
−0.069∗∗∗
−0.002
0.007
MOTIVES FOR MERGERS AND ACQUISITIONS
1367
[0, 2]
[0, 3]
Firm-specific Error Correction
[0, 1]
0.047
0.026
0.079∗∗∗
0.035∗∗
0.063∗∗
0.043∗∗
0.093∗∗∗
0.032∗∗
0.108∗∗∗
0.070∗∗∗
0.061
[0, 3]
C
3,520
(1)
377
10.7
(2)
113
3.2
(3)
278
7.9
(4)
387
11.0
(5)
1550
44.0
−0.065∗∗∗
−0.073∗∗
−0.058∗
−0.033∗∗
−0.022
0.002
−0.027
0.021
0.055∗∗∗
0.051∗∗∗
0.120
(6)
308
8.8
(7)
262
7.4
Mergers with Mergers with
both
all the three
time-series
corrections
sector error
and changes
in long-run
value
0.024
0.002
−0.012
−0.006
−0.022
−0.003
0.011
0.031
0.042∗∗
0.034∗∗∗
0.018
[0, 2]
−0.064∗
−0.055∗
−0.095∗∗∗
−0.072∗∗∗
−0.109∗∗∗
−0.103∗∗∗
−0.068∗∗∗
−0.029∗∗∗
−0.070∗∗∗
−0.019∗
−0.006
[0, 3]
Long-run Value Correction
[0, 1]
Notes:
This table provides information on decomposed M/B ratio components of acquirers over three event windows after merger. The M/B ratio in logarithmic
form is decomposed into three components: firm-specific mispricing (m – v 1 ), time-series sector error (v 1 – v 2 ), and long-run value to book value (v 2 – b). m and b
are market and book values of shares in logarithmic forms. v 1 is the firm’s fundamental value implied by industry averages at time t. v 2 is the firm’s fundamental value
implied by long-run industry averages. The changes in each component over one-, two-, and three-year windows are reported. First and second row statistics in Panels
A to G are the mean and median, respectively. ∗∗∗ , ∗∗ and ∗ denote significance at the 1%, 5%, and 10% levels, respectively.
Group number
Number of events
Percentage of total
Panel H. Number of Observations by the Type of Error Correction
All mergers Mergers with Mergers with Mergers with Mergers with Mergers with
both
both
changes in
firm-specific time-series
firm-specific firm-specific
long-run
sector error
error
and
error and
value
correction
correction
time-series
changes in
sector error
long-run
corrections
value
0.064∗∗
0.061∗∗∗
0.018
0.020
0.026
0.019
0.107∗∗∗
0.038∗∗∗
0.032
0.070∗∗∗
0.033
[0, 2]
Time-series Sector Error Correction
[0, 1]
Panel G. Post M&A Corrections: By the Market Value of Acquirers
Market value of Acquirers
Quintile 1
−0.068∗∗ −0.019
0.016
0.006
−0.017∗∗∗
0.037
0.060
0.008
Quintile 2
−0.071∗
−0.090∗
−0.178∗∗∗
0.005
−0.087∗∗∗ −0.061∗
−0.094∗∗∗
0.025∗
Quintile 3
0.042
−0.089∗∗
−0.128∗∗
−0.030
0.011
−0.047∗
−0.047∗
0.005
Quintile 4
−0.103∗∗ −0.262∗∗∗ −0.234∗∗∗
0.056∗∗
−0.037∗
−0.144∗∗∗ −0.115∗∗∗
0.024∗∗
Quintile 5
−0.094∗∗ −0.284∗∗∗ −0.280∗∗∗
0.016
−0.101
−0.130∗∗∗ −0.129∗∗∗
0.016
Difference (Q5 – Q1)
−0.026
−0.266∗∗∗ −0.296∗∗∗
0.010
Event windows [year]
Table 3 (Continued)
1368
NGUYEN, YUNG AND SUN
2013 Blackwell Publishing Ltd
MOTIVES FOR MERGERS AND ACQUISITIONS
1369
mergers in these industries account for more than one-third of the aggregate M&A
transactions. Our result is consistent with the observations of many researchers that
mergers frequently take place in industries that have experienced input price and
deregulation shocks (Mulherin and Boone, 2000). The analysis of the time-series
sector error correction by industry suggests that response to industry/economic shocks
is a common merger motivation.
(iii) Evidence for Synergy, Agency, and Hubris Motives
We explain above that the long-run value component of the market-to-book ratio
can be affected by motives related to synergy, agency and hubris. However, seeking
evidence for motives that may have conflicting valuation implications from aggregate
data may not be meaningful. For example, in Panels A and B of Table 3, the mean and
median long-run values of the whole sample change inconsistently over the first two
event windows. Thus, it is better that we focus on subcategory results that are directly
related to synergy, agency and hubris, respectively.
The results in Panel C of Table 3 show that active acquirers experience inconsistent
changes in long-run value-to-book. In the first year after merger, the long-run value
experienced an insignificant positive gain. For the two-year window, the mean change
is insignificantly negative, whereas the median change is insignificantly positive. Only
the mean change for the three-year window period is significant but negative. Inconsistent changes in the long-run value of active acquirers are consistent with implications
that the acquirers are motivated by hubris and have engaged in acquisitions that may
or may not increase firm value.
Panel D of Table 3 shows that stock payers experience significantly larger decreases
in the long-run value component than cash payers in each of the three event windows.
In one, two, and three years after merger, stock payers lose 0.026, 0.084 and 0.153
of the long-run value, respectively, whereas cash payers gain 0.021 in one year and
lose 0.007 and 0.076 of the long-run value in two and three years after merger. The
median long-run value for cash payers significantly increases in the first two event
windows. The result shows that stock payers are more likely to be associated with
value-decreasing acquisitions, whereas cash payers are more likely to be associated with
value-increasing acquisitions. This implies that stock-financed mergers are more often
affected by agency-related motives and/or hubris.
Panel E of Table 3 provides additional evidence that mergers could be driven by
managerial objectives. In Panel E of Table 3, acquirers that purchase 100% of the
target experience a significantly larger reduction in long-run value than acquirers
seeking less than 10% of the target firm. The difference between the two groups
is significant for both the two- and three-year windows. This is consistent with
implications that mergers driven by empire-building incentives reduce the long-term
value of the firm more significantly.
Panel F of Table 3 provides evidence for the synergy motive. High-valuation
acquirers significantly gain in long-run value in the one and two years after merger
by 0.056 and 0.081, respectively, although suffer a significant loss in the three-year
window. That is, it appears that M&As by the glamour acquirers could be synergistic at
first, yet become value-decreasing later. One the other hand, low-valuation acquirers
experience a significant reduction in the long-run value component in each of the
three event windows. The declines are –0.053 in one year, –0.218 in two years, and
C
2013 Blackwell Publishing Ltd
1370
NGUYEN, YUNG AND SUN
–0.167 in three years. In Panel G where the sample is grouped by the market value of
the acquirer, the result shows that large acquirers create value initially but eventually
experience a decrease in value.
(iv) Summary of the MB Ratio Decomposition Evidence
The results in Table 3 show that the market timing motive is more significant
among stock payers and high-valuation acquirers. Mergers that represent responses to
industry/economic shocks are confined to industries that have undergone significant
fundamental changes. Stock payers and empire builders are more associated with the
agency and hubris motives, and they typically experience a decline in long-run value.
Cash payers are more likely to be related to the synergy motive. On the other hand,
high-valuation and large acquirers are able to create synergy in the one to two years
after a merger, but they will eventually experience a decline in long-run value.
In Panel H of Table 3, we sort the whole sample into the following seven groups
based on the type of misvaluation correction over the one-year window: (1) mergers
that have the firm-specific error correction only; (2) mergers that have the timeseries sector error correction only; (3) mergers that have the long-run value-to-book
correction only; (4) mergers that have both the firm-specific error and time-series
sector error corrections; (5) mergers that have both the firm-specific error and longrun value to book corrections; (6) mergers that have both the time-series sector error
and long-run value-to-book corrections; and (7) mergers that have all three types of
error corrections. The sorting based on the one-year window provides some interesting
statistics.2 Of the 3,520 M&As examined, 377 (10.7%) experienced only the firmspecific error correction; 113 (3.2%) experienced only the time-series sector error
correction; and 278 (7.9%) experienced only the long-run value-to-book correction.
Among mergers that have more than one type of mispricing correction, 1,550 (44%)
have both the firm-specific error and long-run value corrections. This implies that
many acquiring managers use overvalued shares to achieve personal goals. Aggregating the seven groups, 2,576 (73%) acquirers have motives that are related to firmspecific mispricing; 762 (21.6%) acquirers have motives that are related to responses
to industrial and economic shocks; and 2,090 acquirers (59.2%) have motives that are
related to long-run value-to-book mispricing. In short, the results suggest that singlemotive acquisitions are relatively less common. This is consistent with the postulations
of Amihud and Lev (1981) and Donaldson and Lorsch (1983). Our finding of multiple
motives for mergers also supports the findings of Shleifer and Vishny (1989) and
Berkovitch and Narayanan (1993) which are based on the announcement period
abnormal returns of bidders and targets.3 The existence of competing motivations
in a single merger is not impossible. For example, mergers motivated by synergy
could be value-decreasing at the same time if they are also intended to enhance the
2 Consistent sorting results are found based on the two- and three-year windows.
3 Many acquiring firms prefer the pooling-of-interests to purchase accounting in merger activity due to
alleged tax advantages and higher reported earnings. However, researchers have shown that the pooling
method has no real economic advantage as it does not increase assets, reduce liabilities, nor modify tax
treatment. Hong et al. (1978) and Aboody et al. (2000) confirm that the choice of accounting method
produces no abnormal stock returns in mergers as investors are able to see through the window dressing
effect of pooling. Thus, it is likely that the choice of acquisition accounting method would have no impact
on the M/B ratio decomposition results reported in this study. We thank the journal editors for directing
our attention to the literature on acquisition accounting.
C
2013 Blackwell Publishing Ltd
MOTIVES FOR MERGERS AND ACQUISITIONS
1371
CEO’s entrenchment and personal objectives. Value-deceasing diversifications could
also be value-increasing if the co-existing motive is to obtain operating or financial
synergy. Similarly, conflicting motivations exist when a CEO carries out a synergyrelated takeover but overpays for the target because of his hubris. Gao (2010) finds
that acquiring managers with a short managerial horizon tend to emphasize more the
short-term value than the long-term value of a firm. He reported evidence that shorthorizon acquiring managers undertake mergers that increase the short-term firm value
whether or not these mergers may destroy firm value in the long run.
(v) Logistic Regressions on Merger Motivation
Next, we perform logistic regressions to see whether we can find results consistent
with our earlier findings on merger motivation without relying on the M/B error
components. In these logistic regressions, the dependent variable is equal to 1 if
the firm is a bidder and zero otherwise. The four groups of independent variables
are intended to reflect overvaluation, agency motives, growth opportunities and
managerial hubris. The first group of independent variables includes proxies for firm
overvaluation. The chosen variables are M/B ratio and the pre-acquisition three-year
buy-and-hold stock return. We expect the coefficients on the variables to be positive
as it has been well documented in the literature that overvalued firms are more likely
to acquire targets that are less-overvalued. The second group of independent variables
is a set of firm-specific characteristics commonly used as proxies for agency problems:
firm size, sales and free cash flow. Moeller et al. (2004) report that larger firms are
more likely to attempt value-destroying acquisitions than smaller firms, which indicates
that the market for corporate control is less effective in disciplining the managers of
larger firms than the managers of smaller firms. Masulis et al. (2007) hypothesize that
undisciplined managers are more likely to indulge in value-destroying empire building
acquisitions. Jensen (1986) stipulates that firms with high levels of free cash flow are
often associated with agency problems and tend to overinvest. Thus, we expect firms
that are larger in size or sales as well as firms that have high levels of free cash flow are
more likely to pursue corporate acquisitions. The third group of independent variables
includes proxies for growth opportunities: three-year income growth and three-year
sales growth before acquisition. These variables are included to determine if the
acquisitions represent attempts to buy growth. We expect the coefficients on income
growth and sales growth to be negative based on the results in the existing literature.
Finally, we include Tobin’s Q as an independent variable that proxies for managerial
hubris. To the extent that Tobin’s Q reflects the ability of firm management (Lang
et al., 1989), Q also reflects the manager’s tendency to become overconfident. Thus,
a positive coefficient on the variable is consistent with the implication that managers
acquire other firms to satisfy their hubris.
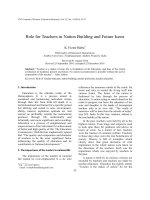
Table 4 presents the results of the logistic regressions. The first column shows that
bidders are indeed more acquisitive when their firms are overvalued. The coefficient
on the M/B ratio is positive and significant at the 1% level. The coefficient on the preacquisition three-year raw stock return is also positive and significant at 1%. The results
lend support to the M/B ratio decomposition findings reported earlier that shortterm firm misvaluation is common among acquiring firms. That is, market timing is a
common merger motivation. In the first column, the coefficients on firm size and sales
are both positive and significant at the 1% level, although the coefficient on free cash
C
2013 Blackwell Publishing Ltd
1372
NGUYEN, YUNG AND SUN
Table 4
Logistic Regressions on Motives of Corporate Mergers
Predicted Sign
Intercept
M/B ratio
RET(raw)
RET (excess)
Sales
Size
FCF
ROA
NIg
Salesg
Q
LR ratio
Wald Statistic
+
+
+
+
+
+
−
−
−/+
+
(1)
(2)
(3)
(4)
−4.56∗∗∗
0.01∗∗∗
0.59∗∗∗
−4.86∗∗∗
0.01∗∗∗
−4.47∗∗∗
0.01∗∗∗
0.64∗∗∗
−4.82∗∗∗
0.01∗∗∗
0.68∗∗∗
0.01∗∗∗
0.01
0.18
−0.03
0.03∗∗∗
1,441∗∗∗
799∗∗∗
0.28∗∗
0.70∗∗∗
0.01∗∗∗
0.01
0.09
−0.45∗∗∗
3.04∗∗∗
0.04∗∗∗
1,546∗∗∗
791∗∗∗
0.68∗∗∗
0.01∗∗∗
0.01
0.19
−0.02
0.03∗∗∗
1,439∗∗∗
789∗∗∗
0.35∗∗∗
0.69∗∗∗
0.01∗∗∗
0.01
0.09
−0.46∗∗∗
3.05∗∗∗
0.04∗∗∗
1,547∗∗∗
769∗∗∗
Notes:
This table presents results of logistic regressions on motives of corporate mergers. The dependent
variable is a (0, 1) dummy with a value of 1 if the firm is an acquiring firm. RET(raw) and RET(excess) are
three-year buy-and-hold returns before merger. FCF is sales growth. NIg and Salesg are net income growth
and sales growth rates before acquisition. Q is Tobin’s Q. ∗∗∗ , ∗∗ and ∗ denote significance at the 1%, 5%,
and 10% levels, respectively.
flow is insignificant. We can nevertheless make a general conclusion that firms that are
more acquisitive are likely to be associated with higher levels of agency problems. This
observation is consistent with the existing literature that one of the motives for mergers
is that managers of acquiring firms use overvalued stocks to achieve personal goals.
Regarding growth opportunities, the coefficient on income growth (NIg ) is negative.
The sign of the coefficient is consistent with our expectation, although insignificant.
The coefficient of Tobin’s Q in the first column is positive and significant at the 1%
level, consistent with the implication that CEO hubris is present among acquiring
firms. The results in the other columns are similar to those in the first column. The
coefficients on the pre-acquisition three-year excess stock return in columns 2 and 4
are consistent with the coefficients on the raw return in columns 1 and 3. The negative
coefficients on income growth (NIg ) in columns 2 and 4 have become significant. This
finding supports the implication that one of the motives for mergers is to buy growth
through acquisitions, suggesting that bidders might be seeking synergy in acquisitions
in addition to other motives. In columns 2 and 4, we have added sales growth (Salesg )
to the independent variables. The positive and significant coefficient on sales growth is
consistent with an empire building implication. Overall, the results in Table 4 indicate
that corporate acquisitions are most likely intertwined with multiple motives such as
market timing, managerial self-interest, synergy and hubris. The results in Table 4 also
provide empirical support for our earlier findings on the M/B ratio decomposition
that different types of valuation errors could simultaneously exist among bidders.
6. CONCLUSIONS
We decompose the M/B ratio of corporate acquirers into firm-specific error, timeseries sector error, and long-run value-to-book and observe how they change in the
C
2013 Blackwell Publishing Ltd
MOTIVES FOR MERGERS AND ACQUISITIONS
1373
post-acquisition period in order to decipher merger motivation. We find evidence that
merger motivation includes market timing, agency/hubris, synergy and response to
industry/economic shocks. However, our results show that single-motive acquisitions
are relatively uncommon. About 80% of the 3,520 sampled acquirers have multiple
merger motives. It appears that many acquiring managers use overvalued shares to
promote personal goals and/or other objectives through merger activity. Our finding
of multiple motivations in corporate takeovers is consistent with the predictions of
a number of researchers. Our results suggest that it is generally difficult to have
a clear picture of the underlying motivations for M&As because value-increasing
and value-decreasing motives frequently coexist. Our methodology allows us to draw
conclusions based on ex-post market evidence. Since we use the same methodology in
evaluating merger motives, we overcome the issue of comparability across different
methodologies in the existing literature.
Despite the interesting findings of our investigation, some caveats should be noted.
First, the result of this study is based on a sample of takeovers that took place in the
US only. Institutional differences in non-US countries may lead to results that are
different from the current study. For example, the less rigorous corporate disclosure
requirements in emerging markets may affect firm value in developing countries and
render the M/B decomposition analysis less effective (Leuz et al., 2003; and Jiao,
2011). Second, even among developed markets, some studies of non-US corporate
takeovers suggest that the non-US experience may be different. For example, despite
Hodgkinson and Partington (2008) and Arnold and Parker (2009) find that multiple
motives are present in UK takeovers, the researchers also suggest that there is less
evidence of agency related motives in UK mergers. Arnold and Parker attribute their
conclusion to the policies of the competition authorities in monitoring corporate
behavior. In contrast to the existing evidence on US firms, Bi and Gregory (2011)
find that overvaluation is a more important determinant of acquisition activity in the
UK. Third, there is also recent evidence that cultural factors have a significant impact
on the acquiring firm’s ability to assimilate merger gains (Steigner and Sutton, 2011).
In short, generalizing the result of this study to non-US examples should be done with
caution.
Notwithstanding these limitations, the present study offers new contributions to the
literature. Our study extends the debate on merger motivation and brings into the
picture a methodology that may have overcome previous drawbacks.
REFERENCES
Aboody, D., R. Kasznik and M. Williams (2000), ‘Purchase versus Pooling in Stock-for-Stock
Acquisitions: Why Do Firms Care?’ Journal of Accounting Economics, Vol. 29, pp. 261–86.
Agarwal, M. and A. Bhattacharjea (2006), ‘Mergers in India’, Emerging Markets Finance and Trade,
Vol. 42, pp. 46–65.
Agrawal, A. and J. Jaffe (2000), ‘The Post-Merger Performance Puzzle’, in C. Cooper and A.
Gregory (eds.), Advances in Mergers and Acquisitions (JAI Press), pp. 7–41.
Amihud, K. and B. Lev (1981), ‘Risk Reduction as a Managerial Motive for Conglomerate
Mergers’, Bell Journal of Economics, Vol. 12, pp. 605–17.
Andrade, G., M. Mitchell and E. Stafford (2001), ‘New Evidence and Perspectives on Mergers’,
Journal of Economic Perspectives, Vol. 15, pp. 103–12.
Arnold, M. and D. Parker (2009), ‘Stock Market Perceptions of the Motives for Mergers in
Cases Reviewed by the UK Competition Authorities: An Empirical Analysis’, Managerial and
Decision Economics, Vol. 30, pp. 211–33.
C
2013 Blackwell Publishing Ltd
1374
NGUYEN, YUNG AND SUN
Auerbach, A. and D. Reishus (1988), ‘The Impact of Taxation on Mergers and Acquisitions’,
Mergers and Acquisitions, Vol. 20, pp. 69–85.
Barnes, P. (1998), ‘Why Do Bidders Do Badly out of Mergers? Some UK Evidence’, Journal of
Business Finance and Accounting , Vol. 25, pp. 571–94.
Berkovitch, E. and M. Narayanan (1993), ‘Motives for Takeovers: An Empirical Investigation’,
Journal of Financial and Quantitative Analysis, Vol. 28, pp. 347–62.
Bi, X. G. and A. Gregory (2011), ‘Stock Market Driven Acquisitions versus the Q Theory of
Takeovers: The UK Evidence’, Journal of Business Finance and Accounting , Vol. 38, pp. 628–56.
Bradley, M., A. Desai and E. H. Kim (1988), ‘Synergistic Gains from Corporate Acquisitions and
their Division between the Stockholders of Target and Acquiring Firms’, Journal of Financial
Economics, Vol. 21, pp. 31–49.
Bruner, R. (2002), ‘Does Mergers and Acquisitions Pay? A Survey of Evidence for the Decisionmaker’, Journal of Applied Finance, Vol. 12, pp. 48–68.
Donaldson, G. and G. Lorsch (1983), Decision Making at the Top, (Basic Books, New York).
Dong, M., D. Hirschleifer, S. Richardson and S. Teoh (2006), ‘Does Investor Misvaluation Drive
the Takeover Market?’ Journal of Finance, Vol. 61, pp. 725–62.
Eckbo, B. (1985), ‘Mergers and the Market Concentration Doctrine: Evidence from the Capital
Market’, Journal of Business, Vol. 58, pp. 325–49.
Gao, H. (2010), ‘Market Misvaluation, Managerial Horizon, and Acquisitions’, Financial Management, Vol. 39, pp. 833–50.
Ghosh, A. and P. Jain (2000), ‘Financial Leverage Changes Associated with Corporate Mergers’,
Journal of Corporate Finance, Vol. 6, pp. 377–402.
Hayn, C. (1989), ‘Tax Attributes as Determinants of Shareholder Gains in Corporate Acquisitions’, Journal of Financial Economics, Vol. 23, pp. 121–53.
Hayward, M. and D. Hambrick (1997), ‘Explaining Premiums Paid for Large Acquisitions:
Evidence of CEO Hubris’, Administrative Science Quarterly, Vol. 42, pp. 103–27.
Healy, P., K. Palepu, and R. Ruback (1992), ‘Does Corporate Performance Improve after
Mergers?’ Journal of Financial Economics, Vol. 31, pp. 135–175.
Hodgkinson, L. and G. Partington (2008), ‘The Motivation for Takeovers in the UK’, Journal of
Business Finance and Accounting , Vol. 35, pp. 102–26.
Hong, H., R. Kaplan and G. Mandelker (1978), ‘Pooling vs. Purchase: The Effects of Accounting
for Mergers on Stock Prices’, The Accounting Review, Vol. 53, pp. 31–47.
Jensen, M. (1986), ‘Agency Cost of Free Cash Flow, Corporate Finance and Takeovers’, American
Economics Review, Vol. 76, pp. 323–29.
——— (1993), ‘The Modern Industrial Revolution, Exit, and the Failure of Internal Control
System’, Journal of Finance, Vol. 48, pp. 831–80.
Jiao, Y. (2011), ‘Corporate Disclosure, Market Valuation, and Firm Performance’, Financial
Management, Vol. 30, pp. 647–76.
Lang, L., R. Stulz and R. Walkling (1989), ‘Managerial Performance, Tobin’s Q, and the Gains
from Successful Tender Offers’, Journal of Financial Economics, Vol. 24, pp. 137–54.
Leuz, C., D. Nanda and P. Wysocki (2003), ‘Earnings Management and Investor Protection: An
International Comparison’, Journal of Financial Economics, Vol. 69, pp. 505–27.
Loughran, T. and A. Vijh (1997), ‘Do Long-term Shareholders Benefit from Corporate
Acquisitions?’ Journal of Finance, Vol. 52, pp. 1765–90.
Malatesta, P. (1983), ‘The Wealth Effect of Merger Activity and the Objective Functions of
Merging Firms’, Journal of Financial Economics, Vol. 11, pp. 155–81.
Masulis, R., C. Wang and F. Xie (2007), ‘Corporate Governance and Acquirer Returns’, Journal
of Finance, Vol. 62, pp. 1,851–1,889.
Mehrotra, V., D. Schaik, J. Spronk and O. Steenbeek (2011), ‘Creditor-Focused Corporate
Governance: Evidence from Mergers and Acquisitions in Japan’, Journal of Financial and
Quantitative Analysis, Vol. 46, pp. 1051–72.
Moeller, S., F. Schlingemann and R. Stulz (2004), ‘Firm Size and the Gains from Acquisitions’,
Journal of Financial Economics, Vol. 73, pp. 201–28.
Morck, R., A. Shleifer and R. Vishny (1990), ‘Do Managerial Objectives Drive Bad Acquisitions?’
Journal of Finance, Vol. 45, pp. 31–48.
Mulherin, J. and A. Boone (2000), ‘Comparing Acquisitions and Divestitures’, Journal of Corporate
Finance, Vol. 6, pp. 117–39.
C
2013 Blackwell Publishing Ltd
MOTIVES FOR MERGERS AND ACQUISITIONS
1375
Pound, J. (1988), ‘The Information Effects of Takeover Bids and Resistance’, Journal of Financial
Economics, Vol. 22, pp. 207–27.
Rau, P. and T. Vermaelen (1998), ‘Glamour, Value and the Post-acquisition Performance of
Acquiring Firms’, Journal of Financial Economics, Vol. 49, pp. 223–53.
Rhodes-Kropf, M. and S. Viswanathan (2004), ‘Market Valuation and Merger Waves’, Journal of
Finance, Vol. 59, pp. 2685–718.
———, D. Robinson and S. Viswanathan (2005), ‘Valuation Waves and Merger Activity:
The Empirical Evidence’, Journal of Financial Economics, Vol. 77, pp. 561–603.
Roll, R. (1986), ‘The Hubris Hypothesis of Corporate Takeovers’, Journal of Business, Vol. 59, pp.
197–216.
Shleifer, A. and R. Vishny (1989), ‘Management Entrenchment: The Case of Manager-specific
Investments’, Journal of Financial Economics, Vol. 25, pp. 123–39.
——— and R. Vishny (2003), ‘Stock Market Driven Acquisitions’, Journal of Financial Economics,
Vol. 70, pp. 295–311.
Steigner, T. and N. Sutton (2011), ‘How Does National Culture Impact Internalization Benefits
in Cross-Border Mergers and Acquisitions?’ Financial Review, Vol. 46, pp. 103–25.
Stulz, R. (1990), ‘Managerial Discretion and Optimal Financing Policies’, Journal of Financial
Economics, Vol. 26, pp. 3–27.
Weston, J. and K. Chung (1990), ‘Takeovers and Corporate Restructuring: An Overview’,
Business Economics, Vol. 25, pp. 6–11.
C
2013 Blackwell Publishing Ltd