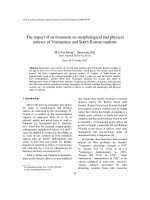
Macro Determinants on Non performing Loans and Stress Testing of Vietnamese Commercial
Bạn đang xem bản rút gọn của tài liệu. Xem và tải ngay bản đầy đủ của tài liệu tại đây (381.77 KB, 16 trang )
VNU Journal of Science: Economics and Business, Vol. 30, No. 5E (2014) 1-16
RESEARCH
Macro Determinants on Non-performing Loans and Stress
Testing of Vietnamese Commercial Banks’ Credit Risk
Võ Thị Ngọc Hà*, Lê Vĩnh Triển, Hồ Diệp ác
International University, Vietnam National University,
Quarter 6, Linh Trung Ward, Thủ Đức District,
Hồ Chí Minh City, Vietnam
Received 8 December 2014
Revised 15 December 2014; Accepted 25 December 2014
Abstract: This study investigates the relationship between several macroeconomic factors and the
nonperforming loan ratio in the Vietnamese banking system by using panel regression models. The
study employs a sample of eight listed banks representing approximately 50% of the market share
of the banking system operating from the fourth quarter of 2008 to the second quarter of 2013.
Consistent with international and domestic evidence, we have found that the GDP growth rate is
negatively related to nonperforming loans (NPL) while the lending rate is positively related to
NPL. Contrary to other studies, the inflation and exchange rates have not been found statistically
significant with nonperforming loans for the Vietnamese commercial banks. The study also
employs both a conventional approach and a value-at-risk (VaR) approach to conduct macro stress
testing in order to predict the levels of the nonperforming loans and the expected losses that banks
could suffer. The forecast result shows that under adverse and stressed scenarios the minimum
capital requirement for banks to survive is about 6% at the end of 2014. Implications will then be
provided for bankers and policy makers accordingly.
Keywords: Nonperforming loans, capital adequacy, stress testing, vector autoregressive model.
1. Introduction *
caused by nonperforming loans (NPL)
(Brownbridge, 1998) [1], e.g. the 1997 Asian
financial crisis (Yang, 2003) [2] and the recent
2008 global financial crisis (Diwa, 2010) [3].
As the main operations of commercial banks
are to accept deposits and provide loans, they
are exposed to the credit risk of having bad
loans, which are known as NPL. NPL have
increasingly gained international attention over
the last several decades. As the increase in NPL
has been found to be associated with bank
A sound financial system is crucial for
every economy since financial institutions,
especially commercial banks, not only facilitate
the credit flow in the economy but also promote
the productivity of business units via funding
investment. During past decades, studies have
shown that most banking failures or crises are
_______
*
Corresponding author. Tel.: 84-903987693
E-mail:
1
2
V.T.N. Hà et al. / VNU Journal of Science: Economics and Business, Vol. 30, No. 5E (2014) 1-16
failures and financial crises in both developing
and developed countries, emphasis is placed on
NPL when financial vulnerabilities are
examined (Khemraj and Pasha, 2009) [4].
NPL are claimed as one of the main
reasons causing a significant decrease in the
Vietnamese banks’ profitability during
Vietnam’s economic slowdown in 2012. Many
banks used a huge amount of provisions to
deal with bad debts, capital that could have
been deployed elsewhere, and this resulted in a
reduction of banking system’s aggregate
profitability to only 28,600 billion VND in
2012, a decrease of about 50% when compared
to 2011 (SBV). That situation prompted the
need to control the rising NPL for the
economic growth of the country. Therefore,
this study is conducted to explore the reasons
behind these NPL.
Since the 1990s, in response to the
increased financial instability in many
countries, a number of policy makers and
researchers have become interested in studying
vulnerability in financial systems. Therefore,
stress testing credit risk and other types of risk
with various techniques have been increasingly
used to assess the resilience of individual banks
as well as financial systems in extreme
scenarios (Christian, Claus, and Maher, 2011)
[5]. Moreover, stress testing is also required as
part of banks’ internal analysis under Basel II
and III requirements.
The SBV’s Circular 13/2010/TT-NHNN
issued in 2010 is considered as one of the first
legal documents requiring stress-testing for
liquidity risk, but it does not detail the
implementation. For example, the circular states
that the credit institutions should stress test that
it would remain solvent under stress
circumstances of cash flow from operating
activities. In fact, while there is growing
concern about stress testing in Vietnam, there
are still limitations on knowledge and
application of this issue at management levels
in commercial banks, especially domestic ones
(Vinh, 2012) [6]. Importantly, the shortage of
instructions on stress testing techniques and
their
application
prevents
consistent
implementation. Therefore, the objective of this
paper is twofold: firstly, we attempt to analyze
the sensitivity of NPL to the macroeconomic
factors; then, we expand the results to develop a
macro stress testing framework for the credit
risk of commercial banks in Vietnam.
A comprehensive review ofmaterials
relating to NPL and the banking stress testing
technique will be briefly presented in the next
section. Then, the paper describes the Vietnam
banking sector in the current situation with
regards to the determinants of NPL. In Part four
we introduce the research methodology. Part
five presents the empirical analysis and
findings. Finally, in Part six we conclude the
research.
2. Materials
2.1. Determinants of NPL
Sinkey and Greenwalt (1991) [7] focused
on large commercial banks during the period
1984-1987. Their model presented the
significant negative relationship between loss
rates and the average ratio of capital to assets.
Their model suggested that the stronger a
capital position a bank maintained, the lower its
loss rate would be.
Berger and DeYoung (1997) [8]
investigated problem loans and cost efficiency
in commercial banks using Granger-causality
techniques to test hypotheses on the
relationship of loan quality, cost efficiency and
bank capital. They indicated that banks with
low capital would have incentives to add more
risky loans to their portfolios, hence, increasing
the number of NPL.
Recently, Saba et al. (2012) [9] studied
determinants of NPL in the US banking sector
employing correlation and regression tests
V.T.N. Hà et al. / VNU Journal of Science: Economics and Business, Vol. 30, No. 5E (2014) 1-16
during the years from 1985 to 2010. The tests
indicated that Real GDP per Capita, Inflation
and Total loans had significant impacts on the
nonperforming loan ratio.
Louzis et al. (2012) [10], Salas and Saurina
(2002) used dynamic panel data methods to
investigate the determinants of NPL in the
banking sector and found that NPL were caused
primarily by macro-fundamentals like GDP,
unemployment, interest rates and by
management quality. More recently, Klein
(2013) [11] studied NPL in Central, Eastern and
South-Eastern Europe (CESSE) in the period
1998-2011 and found that NPL strongly
responded to macroeconomic factors such as GDP
growth, unemployment rate, and inflation. In
addition, bank specific factors were also found to
be correlated with the nonperforming loan ratio.
Rajan and Dhal (2003) [12] investigated the
response of NPL to terms of credit, bank size
and macroeconomic conditions in India. The
empirical analysis suggested that terms of credit
variables had a significant effect on the banks’
non-performing loans in the presence of bank
size and macroeconomic shocks. Moreover,
alternative measures of bank size could give
rise to differential impacts on bank's nonperforming loans.
Yang (2003) [2] investigated the
relationship of the 1997 Asian financial crisis to
the non-performing loans of commercial banks
in Taiwan. Diwa (2010) [3] investigated the
impact of the 2008 global financial crisis on the
Philippine’s financial system.
Along with the development of financial
institutions, the problem of nonperforming
loans also emerges as a controversial issue in
Vietnam’s banking system. Q. Anh and N. D.
Hung (2013) [13] investigated the factors
leading to bad loans of commercial banks in
Vietnam by employing a panel data set with 10
large Vietnamese commercial banks operating
in the period from 2005-2006 and 2010-2011.
Their findings supported most studies on the
3
impacts of GDP growth rate, inflation, former
NPLs, cost inefficience, bank size, and fast
credit growth on nonperforming loans.
2.2. Banking stress testing
Wong et al. (2006) [14] developed a
framework for stress testing of the credit risk of
banks in Hong Kong. They showed a
significant relationship between the default rate
of bank loans and key macroeconomic factors,
including Hong Kong’s GDP, interest rates and
property prices and the Mainland’s GDP. They
also performed macro stress testing to assess
the vulnerability and risk exposures of banks’
overall loan portfolios and mortgage exposures
to a variety of shocks, similar to those that had
occurred during the Asian financial crisis. The
results indicated that even with VaR at a
confidence level of 90%, banks would continue
to make a profit in most stress scenarios.
However, in extreme cases of the VaR at a
confidence level of 99%, some banks could
incur material losses, but the probability of such
events was extremely low.
In Vietnam, one of a few studies on stress
testing is P. D. Quyen (2012) [15] which
employed a Vector autoregressive model and
historical data to construct macro scenarios with
GDP growth rate, inflation, lending rate and
exchange rate. In the research, the author used a
panel data of 54 developing economies during
2000-2011 to estimate the impact of some
macro elements on NPL, and finally
constructed scenarios to gauge the change in the
NPL of Vietnamese commercial banks.
3. Overview of the nonperforming loan
situation in Vietnam
3.1. NPL in relation with macroeconomic
indicators
In the following section, five macroeconomic
indicators, including GDP growth, inflation,
V.T.N. Hà et al. / VNU Journal of Science: Economics and Business, Vol. 30, No. 5E (2014) 1-16
4
unemployment, lending rates as well as the
exchange rate in Vietnam over the period from
2002 to 2012, are observed in their relationship
with nonperforming loan ratios.
3.2. Real GDP growth rate
On average, the annual growth rate of
Vietnam was about 7% a year between 2003
and 2012. In this period the average growth was
8.1% in 2003-2007, and 5.9% in 2008-2012.
The GDP growth of Vietnam was as high as
8.5% until 2007; however, due to the global
financial crisis and economic downturn, the
growth rate came down to 6.31% in 2008, 5.32%
in 2009, and more recently, only 5.03% in 2012,
the lowest level since 1999 (GSO).
As shown in Figure 1, in general, like other
economies, there is a negative relationship
between GDP and NPL. The explanation
provided by the literature for this relationship is
that strong positive growth in real GDP usually
translates into more income, which improves the
debt servicing capacity of borrower, which in turn
contributes to lower non-performing loans.
3.3. Consumer price index
Figure 2 shows that NPL were positively
related to inflation from 2008 to 2011.
Meanwhile, Figure 2 also displays an inverse
relationship between these two variables from
2002 to 2007. Typically, the inflation increased
significantly from approximately 5% in 2002 to
nearly 10% in 2004 while the NPL ratio
decreased from more than 7% to about 3%
during the same period. The rise of inflation in
2004 may be explained by the governmental
promotion of economic growth and domestic
demand. In the meantime, as the total
outstanding loans of the whole system
increased, the decline in the nonperforming
loan ratio was recognized. In 2008, due to the
lagged effects of the global crisis as well as the
soar in inflation and other adverse events, those
factors have simultaneously caused Vietnam’s
NPL to increase. As shown, NPL changed
along with the movement of inflation from
2008 till 2011.
3.4. Unemployment rate
As presented, most previous studies found a
positive relationship between unemployment
and nonperforming loan ratios (Ahlem and
Fathi, 2013) [16]. Figure 3 illustrates the
relationship
between
NPL
and
the
unemployment ratio in Vietnam context and, in
general, there is a positive relationship between
the unemployment rate and the NPL.
3.5. Lending rate
Figure 1: NPL and GDP growth rate
Source: SBV, GSO.
G
In recent years, the lending rates in Vietnam
are considered to have been driven by the
market even though deposit rates are still
capped by the SBV. Nevertheless, according to
the Civil Law, the bank lending rate is capped
at 1.5 times the prime rate given by the SBV,
which has been maintained at 9% since 2010 in Vietnam the SBV apply both direct and
indirect measures to control interest rates.
D
V.T.N. Hà et al. / VNU Journal of Science: Economics and Business, Vol. 30, No. 5E (2014) 1-16
5
Figure 2: The relationship between NPL and inflation
Source: SBV, GSO.
Figure 3: The relationship between NPL and unemployment rate
Source: SBV, GSO.
From Figure 4, NPL are assumed to be
negatively associated with the lending rate for
some periods before 2006; however, they have
moved together since 2007. In 2008, due to a
surge in the inflation rate, banks’ lending rates
had fluctuated abnormally. In the third quarter
of 2008, the deposit rates experienced 19-20%
per year and the lending rate climbed to 21%
accordingly (SBV). This might have a negative
impact on the economy such as a decline in
business production, as well as borrowers’
capability to service debts.
3.6. Exchange rate
The foreign exchange rates such as the
EUR/USD, the USD/JPY or the USD/VND are
critical because of their impacts on import and
export activities, trade balances, national debt,
and direct and indirect foreign investments.
Figure 5 depicts the change of the USD/VND
exchange rate in terms of the fluctuation of the
NPL ratio in Vietnam from 2002 to 2012.
6
V.T.N. Hà et al. / VNU Journal of Science: Economics and Business, Vol. 30, No. 5E (2014) 1-16
Figure 4: NPL and lending rate
Source: WB, SBV.
Figure 5: NPL and VND/USD exchange rate
Source: ADB, SBV.
Figure 5 shows that the USD/VND
exchange rate did not vary much from 2002 to
2007; however, since 2008, this rate
accelerated dramatically due to the impact of
high inflation in the first half of 2008 and the
effect of the global crisis on the Vietnamese
economy in the second half of the same year.
In 2009 and 2010, the exchange rate continued
to increase and hence the VND depreciated.
Specifically, within five years, the Vietnam
Dong has been devaluated nearly 30%, from
around 16,000 VND/USD in 2007 to nearly
21,000 VND/USD in 2011 (SBV). In general,
NPL and the VND/USD display a slight
positive relationship.
In summary, several relationships between
the NPL ratio and some key macroeconomic
variables have been observed. Typically, the
negative relationship between NPL and GDP
growth rates is consistent with the literature.
The lending and inflation rates are likely to
V.T.N. Hà et al. / VNU Journal of Science: Economics and Business, Vol. 30, No. 5E (2014) 1-16
used the extra data to improve our macroeconomic forecasting part of the analysis.
correlate positively with NPL in recent years.
The exchange rate and unemployment seems to
show a slight positive relationship with NPL
during the period 2002-2012.
The statistical description presents the
characteristics of the data of each variable used
in the study. Notably, the average NPL ratio of
examined banks is 2.12% and the standard
deviation is 0.014759. The disparity between
the nonperforming loan ratios among banks and
among examined periods is relative high,
ranging from 0.34% to 9.04%.
4. Methodology
4.1. The data employed
The data relating to NPL are obtained and
calculated from banks’ financial statements. As
the data for all Vietnamese banks are not widely
available, we take a sample of 8 commercial
banks currently listed in the stock exchanges.
Two reasons for choosing these banks are that
they contain approximate 50% of the assets of
the Vietnam banking system and they provide
more sufficient data compared to others. The
data was obtained quarterly from Q4 in 2008 to
Q2 in 2013 from the banks and hence includes
152 observations of NPL. We have chosen this
particular range since there is inadequate
quality data before 2008.
Concerning macroeconomic variables, the
GDP growth rate’s average is 6.31% and its
standard deviation is 0.014954. The range of
GDP is from 3.1% to 8.5%, relatively narrow
compared to other macroeconomics indicators
like inflation, with the range from 2.4% to
20.1% and LEN from 9.54% to 20.1%. It
should be noted that each macro variable
consists of 34 observations, since we obtained
data in 34 time periods from Q1 in 2005 to Q2
in 2013.
As the objectives of this study are to define
the macroeconomic determinants of NPL and to
apply macro stress testing to the Vietnam
banking system, the analysis will include two
primary stages: Firstly, we define the
determinants of NPL using a panel regression
model. Secondly, we conduct macro stress
testing using the VaR approach.
The data relating to macroeconomic factors
are taken from the websites of the General
Statistics Offices, the State Bank of Vietnam and
the World Bank, and also from Vietnam
Economic Times and Vietnam Banking news, etc.
The macroeconomic data was taken over a longer
period from Q1 in 2005 to Q2 in 2013, and we
Table 1: Summary statistics
NPL
GDP
CPI
LEN
EXR
0.021238
0.06305
0.110773
0.126347
0.008384
Median
0.01851
0.0635
0.085974
0.1185
0.001191
Maximum
0.09044
0.085
0.279041
0.201
0.093545
Minimum
0.003358
0.031
0.024019
0.0954
-0.00974
Std. Dev.
0.014759
0.014954
0.064316
0.023594
0.020185
152
34
34
34
34
Mean
Observations
7
V.T.N. Hà et al. / VNU Journal of Science: Economics and Business, Vol. 30, No. 5E (2014) 1-16
8
4.2. Defining the determinants of NPL - Panel regression model
The panel regression model used is as follow:
NPLi, t = ß0 + ß1NPLi, t – 1 + ß2GDPt + ß3LENt + ß4INFt + ß5EXRt + ε (Equation 1)
Where
• NPLi, t: The nonperforming loan ratio of
bank i at time t. This is measured by the sum of
sub-standard (group 3), doubtful (group 4), and
potentially irrecoverable loans (group 5) to total
loans lent to customers.
• NPLi, t – 1: The nonperforming loan ratio of
the previous quarter. According to Salas and
Saurina (2002), the nonperforming loan ratio is
closely related to that of the previous period
since it is not immediately written down from a
bank’s balance sheet. The nonperforming loan
ratio is assumed to be autoregressive, hence the
coefficient of this variable (
should
be positive.
• GDPt: Year-on-year GDP growth rate at
quarter t. A growing economy is likely to be
associated with rising incomes and less
financial distress. GDP growth is therefore
expected to be negatively related with NPL.
• LENt: Interest rate of the economy at time
t. It is understood that a hike in interest rate
weakens borrowers’ ability to service debts.
So, NPL may be positively related with
lending rate.
• INFt: Year-on-year change in CPI
representing the inflation at quarter t.
According to Nkusu (2011) [17], inflation
affects borrowers’ debt servicing capacity
through different channels. On the one hand,
higher inflation can make debt servicing easier,
either by reducing the real value of outstanding
loans or being associated with low
unemployment, as the Phillips’ curve suggests.
On the other hand, inflation can also weaken
some borrowers’ ability to service debt by
reducing real income when wages are sticky.
Therefore, the coefficient of this variable can be
positive or negative.
• EXRt: The quarterly change in the
VND/USD exchange rate at time t. An
appreciation of exchange rate can have mixed
effects. It may weaken the competitiveness of
export-oriented firms and adversely affect their
ability to pay their debts (Fofack, 2005) [18].
However, it may improve the debt servicing
capacity of borrowers whose loans are in
foreign currencies. So, the relationship between
EXR and NPL may be mixed.
4.3. Conduct macro stress testing using - VaR
approach
VaR is one of the most important and
widely used statistics that measures the
potential of economic losses. VaR measures the
worst case loss over a specified time period.
Similar to the previous approach, the VaR
approach also includes three steps as follows:
Step 1: Construct the macroeconomic scenarios
Sensitivity analysis is applied to conduct
stress testing in the VaR approach. In particular,
one macro variable is shocked artificially while
the other variables are obtained stochastically in
each stress scenario.
Step 2: Predict bank’s NPL ratio with
constructed scenarios
Using the panel regression results, the
forecast values of macroeconomic variables
are substituted to obtain the levels of NPL.
Since both the baseline and stress scenarios
contain stochastic macroeconomic indicators,
the forecast NPL in this approach should be
stochastic instead of deterministic as in the
conventional approach. In general, we
V.T.N. Hà et al. / VNU Journal of Science: Economics and Business, Vol. 30, No. 5E (2014) 1-16
9
variables are related. Secondly, we run
regression Equation 1 with three alternative
regression methods of Panel data including the
Pooled OLS, the Fixed effect model (FEM),
and the Random effect model (REM). Then, we
conduct the F-test, LM test, Hausman test and
other tests to choose the most suitable model
for the second stage.
calculate the forecast values of NPL by the
following equation:
NPLt = ß0 + ß1NPLt-1 + ß2[Zt] (Equation 2)
Z ~ N(µ z, σz)
Where Zt is a vector of economic variable,
normally distributed at time t.
Step 3: Measure banks’ capital adequacy
under the predicted NPL in Equation 3
5.2. Correlation
collinearity
CARt = CLPt = NPLt x [LGDt] (Equation 3)
LGD ~ Beta(µ LGD, σLGD)
coefficient
and
multi-
Table 2 presents a pearson’ s correlation
analysis for a pair of variables. The test shows
that all of the independent variables are
significantly related to NPL at a critical value of
at least 10%. The auto regression parameter,
NPL at one period lag, is found to have a strong
and positive linear relationship with NPL, while
other variables have negative but weak
associations with NPL. Initially, LEN has a
negative coefficient as expected.
In VaR approach, stochastic Loss Given
Default (LGD) is used to measure the VaR for
bank’s expected losses or capital adequacy
ratio. Following Greg and Rogers (2002) [19],
we assume LGD follows a beta distribution that
is bound between 0 and 1.
5. Results
5.1. Descriptive findings
Also shown in Table 2, the absolute values
of correlation coefficients between independent
variables vary from -0.22 to 0.81. There is a
correlation coefficient of 0.81 of CPI and LEN
indicating an issue of multi-collinearity among
these variables.
Stage 1 - Define the determinants of NPL
using a Panel regression model
This section examines the relationship
between the macroeconomic variables and NPL
ratios. Firstly, we calculate the pearson’ s
correlation coefficient to test how well the
Table 2: Pearson correlation
Correlation
Probability
NPL
NPL
1.000000
----NPL_L1
0.908753
0.0000
GDP
-0.202574
0.0149
LEN
-0.144476
0.0840
CPI
-0.187280
0.0246
EXR
-0.202181
0.0151
NPL_L1
1.000000
-----0.176047
0.0348
-0.206793
0.0129
-0.221201
0.0077
-0.160389
0.0548
GDP
1.000000
----0.514724
0.0000
0.288876
0.0004
0.220900
0.0078
H
LEN
1.000000
----0.810514
0.0000
0.094999
0.2574
CPI
1.000000
----0.017258
0.8373
EXR
1.000000
-----
V.T.N. Hà et al. / VNU Journal of Science: Economics and Business, Vol. 30, No. 5E (2014) 1-16
10
Based on the result of initial regression we
find that LEN has a consistently better significant
p-value than CPI, therefore we choose LEN
instead of CPI to remain in the model.
5.3. Pooled OLS, fixed effects and random
effects models
Three main regression methods were used
consisting of: (i) the Pooled OLS, (ii) the Fixed
Effects Model (FEM), and (iii) the Random
Effects Model (REM). In order to decide which
model is suitable for our study, a fixed effect is
tested by the F-test, while a random effect is
examined by Breusch and Pagan’s (1980)
Lagrange multiplier (LM) test. The former
compares the FEM and Pooled OLS to see how
much the fixed effect model can improve the
goodness-of-fit, whereas the latter contrasts a
random effect model with OLS. When both
fixed effects and random effects are statistically
significant, we will conduct a Hausman test to
choose the better.
Using E-views to conduct the F-test, the
p-value of 0.0982 obtained is more than 0.05,
hence we cannot reject
at significant level
α = 0.05 and therefore the Pooled OLS model
is chosen.
Further conducting the LM test, as presented
in Table 3, we cannot reject
because the pvalues of the three estimations are all higher than
the critical level α = 0.05. Therefore, the Pooled
OLS is preferred to the REM.
Table 3: Lagrange multiplier (LM) test for panel data
Probability in ()
Null (no rand. effect)
Alternative
Cross-section
Period
One-sided
One-sided
Breusch-Pagan
0.932880
(0.3341)
0.127890
(0.7206)
Both
1.060770
(0.3030)
H
Based on the results of the F-test and the
LM test, the Pooled OLS is the best choice. We
continued examining the Hausman test which
compares the FEM with the REM to verify our
choice. The p-value of 0.9584 was obtained much higher than 0.05. So the REM is more
favored than the FEM.
To sum up, when combining the results of
the three tests altogether, the Pooled OLS is
considered as the most appropriate model.
5.4. Redundant variables test
The Pooled OLS model presents four
independent variables having statistically
significant coefficients with NPL, including
lagged NPL, GDP, LEN and CPI. Only EXR
has no significant relationship with NPL. In
addition, we are interested in finding the most
appropriate model for the purpose of
forecasting for our next stage.
As mentioned, CPI should be removed from
the regression model. In addition, since the
EXR has no significant coefficient with NPL,
this raises a concern if the regression model has
a redundant variable. Hence, a redundancy test
(Wald test) is used to examine the suspected
variable EXR. EXR is removed from the
regression after the test. Consequently, GDP,
LEN and the lagged NPL are left in the model
where the F-statistic increases to 233.56 from
144.27 in the former model.
F
V.T.N. Hà et al. / VNU Journal of Science: Economics and Business, Vol. 30, No. 5E (2014) 1-16
11
Table 4: Pooled OLS after removing CPI and EXR
Dependent variable: NPL
Sample (adjusted): 2009Q1 2013Q2
Total panel (balanced) observations: 144
Variable
C
NPL(-1)
GDP
LEN
R-squared
Adjusted R-squared
S.E. of regression
Sum squared resid
Log likelihood
F-statistic
Prob (F-statistic)
Coefficient
8.05E-05
0.992068
-0.139309
0.062007
0.833467
0.829899
0.006077
0.005169
532.5798
233.5589
0.000000
Std. Error
0.003779
0.038490
0.063842
0.028169
t-statistic
0.021303
25.77459
-2.182073
2.201262
Mean dependent var
S.D. dependent var
Akaike info criterion
Schwarz criterion
Hannan-Quinn criter.
Durbin-Watson stat
Prob.
0.9830
0.0000
0.0308
0.0294
0.021124
0.014733
-7.341386
-7.258891
-7.307865
1.873308
Stage 2 - Macro stress testing for credit risk - VaR approach
The VaR method is very popular in risk
management, especially in developed countries;
yet the VaR is rarely applied in Vietnam due to
the immaturity of risk management in the
country. Therefore, this section aims at
introducing the more sophisticated Monte-Carlo
method of VaR approach to conduct stress
testing for credit risk in Vietnam’s banking
system. The framework for the VaR approach is
based on Wong et al (2006) [14].
Step 1: Construct the macroeconomic scenarios
As mentioned earlier, GDP and LEN
variables are obtained to establish the
macro scenarios.
For the baseline scenario, the values of
GDP and LEN in the forecast periods have been
obtained stochastically, based on the means and
standard deviations from the historical data (see
Table 1, above).
For stress scenarios, the effect of artificial
shocks are introduced, including GDP shock
and LEN shock, to test a bank’s resilience in
adverse circumstances. Because data has been
obtained since 2005, the baseline scenario
already captures the adverse situation of the
global financial crisis that occurred in 20072008. In each stress scenario, one out of two
variables- GDP or LEN - will be shocked, and
the other will be obtained randomly as those in
the baseline. The two stress scenarios are
defined as follows:
• Stress scenario with decreasing GDP
shocks: Vietnam’s real y-o-y GDP growth rate
reduce to 4.90%, 4.95%, 2.5%, 3.3%, 3.6% and
4% respectively in each of the six consecutive
quarters starting from 2013: Q3.
• Stress scenario with increasing LEN
shocks: The Bank lending rate is 14.5% in the
first quarter, then increases to 16.6% in the
second, followed by no change in the third
quarter, then accelerates to 20.1% in the fourth
and fifth quarters, and finally goes to a peak of
22% in the sixth quarter.
Step 2: Prediction of the bank’s NPL ratio
with constructed scenarios
This
section
applies
Monte-Carlo
simulation to conduct stress-testing in the VaR
V.T.N. Hà et al. / VNU Journal of Science: Economics and Business, Vol. 30, No. 5E (2014) 1-16
12
d) Stress scenario with increasing LEN shock
approach. The forecast NPL in the baseline and
stress scenarios will be measured by the
following equations:
e) NPLt = 8.05-5 + 0.992068 NPLt-1 –
0.139309 [GDPt] + 0.062007 [LENt]
a) Baseline scenario
GDP ~ N(0.06305,0.014954)
-5
NPLt = 8.05 + 0.992068 NPLt-1 – 0.139309
[GDPt] + 0.062007 [LENt] (Equation 4)
Applying
Monte-Carlo
simulation,
thousands or even millions of results for NPL
will be obtained; yet, as the number of runs is
increased, the mean and standard deviation of
NPL fluctuate closely to a specific value. Table
13 presents as to result of each the baseline,
stress scenarios and the corresponding NPL of a
hypothetical bank (assuming the bank’s NPL
equal 3% as end of Jun 2013).
GDP ~ N(0.06305,0.014954)
LEN ~ N(0.126347,0.023594)
The constant and correlation parameters’
values are employed from the Pooled OLS’s
results in Table 4. GDP and LEN are normally
distributed in this scenario. For simplicity, we
assume GDP and LEN are normal distribution,
After running a number of simulations, the
mean levels of forecast NPL are obtained as
they are for the end of 2014 which are
approximately 3% in the baseline scenarios, and
around 5.5% in the stress scenarios. The
expected level of NPL under the stress
scenarios in the VaR approach is much lower
than that in the conventional approach. This is
because either the macro variable GDP or LEN
(sensitivity analysis) is shocked in the former
approach, instead of both variables GDP and
LEN (scenario analysis) in the latter one.
b) Stress scenario with decreasing GDP shock
c) NPLt = 8.05-5 + 0.992068 NPLt-1 – 0.139309
GDPt + 0.062007 [LENt] (Equation 5)
LEN ~ N(0.126347,0.023594)
In this scenario, the LEN variable is
stochastic while the GDP variable is shocked
with the artificial values mentioned in the first
step of this approach. The reverse method will
be applied for the second stress scenario.
Table 5: Predicted NPL from 2013: Q3 to 2014:
Q4 under baseline and stress scenarios using Monte Carlo simulation
(Unit: %)
Baseline
Period
Stress scenario
Stress scenario
GDP
LEN
NPL
GDP
shock
LEN
NPL
GDP
LEN
shock
NPL
2013:Q3f
8.37
14.43
2.71
4.90
13.95
3.17
4.85
14.50
3.21
2013:Q4f
4.80
14.25
2.91
4.95
10.70
3.12
4.30
16.60
3.62
2014:Q1f
7.08
10.46
2.56
2.50
15.04
3.69
5.09
16.60
3.92
2014:Q2f
4.43
13.46
2.77
3.30
10.30
3.85
5.82
20.10
4.33
2014:Q3f
8.22
15.31
2.56
3.60
14.28
4.21
5.35
20.10
4.81
2014:Q4f
7.31
13.57
2.37
4.00
14.90
4.55
5.51
22.00
5.37
f
V.T.N. Hà et al. / VNU Journal of Science: Economics and Business, Vol. 30, No. 5E (2014) 1-16
Step 3: Measureof banks’ capital adequacy
under the predicted NPL
Wong et al. (2006) [14] used 10,000 MonteCarlo simulation runs to simulate future paths to
conduct credit losses distribution for each baseline
and stress scenario. However, a range of 1,000;
2,000; 5,000 and 10,000 simulations can be used
for market risk; but a minimum number of 50,000
simulations is recommended for credit risk
(financial-risk-manager.com).
In order to conduct a Monte Carlo
simulation, lots of professional simulation software can be applied, such as multi-GPU
systems or Frontline Systems’ Risk Solver, etc.
Of the available software, Microsoft Excel is
one of the common tools used to perform
Monte Carlo simulations; for 50,000 simulation
paths, Excel 2007 is adequate for our
calculation purposes for both baseline and
stress scenarios. The simulated 50,000 NPL in
2014: Q4 is then used to construct the
frequency distributions of Credit Loss
Percentages (CLP). For a given bank, the
percentage of credit loss is simply the product
of the default rate and Loss Given Default
(LGD) (Greg and Rogers, 2002) [19]. The LGD
is the loss amount when a borrower defaults on
a loan (investopedia.com).
In this section, the default rate can be
obtained by the forecast NPL in the second step
of this approach. However, to calculate bank
CLP also depends on the appropriate LGD
measured by the recovery rate (RR).
Based on the results of S&P’s recent study
on the US recovery rate from 1987-2012: Q1
(see Table 6) the US senior secured bonds’
recovery rate of 62.7% and standard deviation
of 32.7% are used as proxies for the recovery
rate of the Vietnam banking system. However,
instead of using the mean of 62.7% as a
deterministic value for the recovery rate, the
authors conduct a beta distribution to model the
stochastic recovery value.
Our calculation processes in this section can
be described as follows:
CARt = CLPt = NPLt x LGDt (Equation 6)
LGDt = 1 – [RRt]
RR ~ Beta(62.7%,32.7%)
Noticeably, the beta distribution of the
bank’s recovery rate is bound between 0 and 1.
Figure 6(a) and 6(b) illustrate the simulated
frequency distributions of CLP under the baseline
and stress scenarios. As shown in the figures, the
stress scenarios with GDP and LEN shocks will
shift the CLP distribution to the right, suggesting
that the shocks have resulted in increases in the
expected percentage of credit losses.
Table 7 summarizes the distributions of
credit loss for a typical Vietnamese commercial
bank under the baseline and the two stress
scenarios. For the baseline scenario in 2014:
Q4, the expected CLP is 0.84% whereas for the
stress scenarios, the expected CLP is higher,
1.59% and 1.61% respectively. The maximum
CLP is more interesting; this equals the
adequate amount of capital that bank should
reserve to absorb for the credit losses.
Table 6: S&P’s recovery ratings: Historical ultimate recovery rates
Recovery as % or par at emergence: 1987 - 1Q2012
Bank debt
Senior secured bonds
Senior unsecured bonds
Senior subordinated bonds
Subordinated bonds
Junior subordinated bonds
Recovery
78.0%
62.7%
46.9%
32.9%
28.5%
18.7%
13
Standard deviation
30.3%
32.7%
33.7%
35.2%
34.2%
29.6%
Source: Standard & Poor’s.
Observations
1,670
375
1,223
561
432
54
V.T.N. Hà et al. / VNU Journal of Science: Economics and Business, Vol. 30, No. 5E (2014) 1-16
14
a) Stress scenario 1: GDP shock
b) Stress scenario 2: LEN shock
Figure 6: Simulated frequency distributions of credit loss under baseline scenario and stress scenarios
Note: Each distribution is constructed with 50,000 simulated future paths of default rates.
Table 7: The mean and VaR statistics of simulated credit loss distributions
(Unit: %)
Credit losses
fg
Baseline scenario
Stress scenario
GDP shock
LEN shock
Mean
0.84
1.59
1.61
VaR at 90% CL
2.04
3.75
3.81
VaR at 95% CL
2.39
4.08
4.21
VaR at 99% CL
2.96
4.51
4.78
VaR at 99.9% CL
3.55
4.92
5.34
VaR at 99.99% CL
4.12
5.27
5.70
V.T.N. Hà et al. / VNU Journal of Science: Economics and Business, Vol. 30, No. 5E (2014) 1-16
Table 7 presents the VaR at confidence
levels of 90%, 95%, 99%, 99.9% and 99.99% to
examine the change of CLP under each
scenario. For instance, under the extreme case
for the VaR at a 95% confidence level, the
maximum of CLP is 4.21% under all scenarios,
i.e. if the bank had a reserve of 4.21% in capital
this would be adequate capital to absorb losses
without the bank becoming insolvent for all
three scenarios-baseline, GDP shock and LEN
shock. If we require a 99.99% confidence level,
then banks would need to reserve at least 5.70%
in capital. Typically, a bank would add an
additional buffer to the 5.70% number to give
themselves additional cushion. Hence, the
results of CLP in this table also suggest that
banks should reserve a minimum capital level
of 6% of total loans in order to promote
stability and efficiency in the adverse scenarios.
15
Secondly, the study provides a framework
of macro stress testing using the credit risk
model to calculate the VaR and to forecast the
value of NPL and banks’ performance at a point
in future time or specifically the fourth quarter
of 2014. The forecast results indicate that the
minimum capital requirement for banks to
survive the shocks is about 6%. This figure is
lower than the typical Basel I 8% figure. We
believe the difference may be due to: (i)
Vietnamese banks incorrectly reporting their
NPLs, with a figure lower than those reported
by the SBV in 2014 (3.79%), and rating
agencies such as Moody’s in 2014 (15%); and
(ii) Basel are designed for all regions and all
kinds of banks hence their number has to be
more conservative. Therefore, banks need to
manage their capital above this level and
regulators may need to consider this level of
capitalas the benchmark for banks to follow.
6. Conclusions
References
Firstly, in line with previous research, our
empirical results confirm that macro factors,
such as the GDP growth rate (GDP) and the
lending rate (LEN), have significant impacts on
the level of NPL. In particular, GDP is found to
have a strong negative association with NPL
reported by Vietnamese commercial banks,
suggesting an improvement in economic growth
is an outcome of lower NPL. We have also
confirmed a significant positive relationship
between LEN and NPL. Hence a higher lending
rate may cause an increase in the level of NPL.
However, unlike other researchers our results
reveal that, in the Vietnamese commercial
banks, inflation and the exchange rate are
significant determinants of NPL. It is therefore
suggested that the banks should focus their
attention particularly on the growth rate of the
economy as well as the lending rate to
borrowers, when providing loans in order to
restrain the level of defaulted loans.
[1]
[2]
[3]
[4]
[5]
[6]
Martin Brownbridge, “The Causes of Financial
Distress in Local Banks in Africa and
Implications for Prudential Policy”, UNCTAD
Discussion Papers, No. 132, March 1998.
Li Yang, “The Asian Financial Crisis and NonPerforming Loans: Evidence from Commercial
Banks in Taiwan”, International Journal of
Management 20 (2003) 1
Diwa C Guinigundo, “The Impact of the Global
Financial Crisis on the Philippine Financial
System - An Assessment”, BIS Papers 54, 2010.
Tarron Khemraj and Sukrishnalall Pasha, “The
Determinants of Non-performing Loans: An
Econometric Case Study of Guyana”, The
Caribbean Centre for Banking and Finance Biannual Conference on Banking and Finance, St.
Augustine, Trinidad, 2009.
Christian Schmieder, Claus Puhr, and Maher
Hasan, “Next Generation Balance Sheet Stress
Testing”, IMF Working Paper, April 2011,
Pham Do Nhat Vinh, “Stress Testing of the
Banking Sector in Vietnam: How and When?”,
Banking Supervision Department, 2012.
16
[7]
V.T.N. Hà et al. / VNU Journal of Science: Economics and Business, Vol. 30, No. 5E (2014) 1-16
Sinkey, J. F. and Greenawlat, M.B., “Loan-Loss
Experience and Risk-taking Behaviour at Large
Commercial Banks”, Journal of Financial Services
Research, Vol. 5, no. 1, 1991, pp. 43-59
[8] Allen N. Berger and Robert DeYoung,
“Problem Loans and Cost Efficiency in
Commercial Banks”, Journal of Banking &
Finance, Elsevier 21 (1997) 849.
[9] Irum Saba, Rehana Kouser and Muhammad
Azeem, “Determinants of Non Performing
Loans: Case of US Banking Sector”, The
Romanian Economic Journal, Year XV No. 44
(2012) 141.
[10] Dimitrios P. Louzis, Angelos T. Vouldis and
Vasilios L. Metaxas, “Macroeconomic and
Bank-specific Determinants of Non-performing
Loans in Greece: A Comparative Study of
Mortgage, Business and Consumer Loan
Portfolios”, Journal of Banking & Finance,
Elsevier, 36 (2012) 1012.
[11] Nir Klein, “Non-Performing Loans in CESSE:
Determinants and Impact on Macroeconomic
Performance”, IMF Working Paper, European
Department, 2013.
[12] Rajiv Ranjan and Sarat Chandra Dhal, “NonPerforming Loans and Terms of Credit of
Public Sector Banks in India: An Empirical
Assessment”, Reserve Bank of India Occasional
Papers 24 (2003) 3.
[13] Do Quynh Anh and Nguyen Duc Hung,
“Practical Analysis of the Determinants of
Nonperforming Loans in the Vietnamese
Commercial Banks”, Vietnam Centre for
Economic and Policy Research, Hanoi, Jan, 2013.
[14] Jim Wong, Ka-fai Choi, and Tom Fong, “A
Framework for Macro Stress Testing the Credit
Risk of Banks in Hong Kong”, Hong Kong
Monetary authority quarterly bulletin, 2006.
[15] Phung Duc Quyen, “Stress Testing the Large
Commercial Banks in Vietnam”, Vietnam
Centre for Economic and Policy Research,
Hanoi, 2012.
[16] Ahlem Messai and Fathi Jouini, “Micro and
Macro Determinants of Non-performing
Loans”, International Journal of Economics and
Financial Issues 3 (2013) 852.
[17] Nkusu, M., “Nonperforming Loans and Macro
financial
Vulnerabilities
in
Advanced
Economies”, International Monetary Fund, WP
No. 11/161, 2011.
[18] Hippolyte L. Fofack, “Nonperforming Loans in
Sub-Saharan Africa: Causal Analysis and
Macroeconomic Implications”, World Bank
Policy Research Working Paper 3769, 2005.
[19] Greg M. Gupton and Roger M. Stein,
“LossCalc(TM): Moody’s Model for Predicting
Loss Given Default (LGD)”, New York:
Moody’s Investors Service, 2002.